Accurate prediction of patient-specific ventilator parameters is crucial for optimizing patient-ventilator interaction. Current approaches encounter difficulties in concurrently observing long-term, time-series dependencies and capturing complex, significant features that influence the ventilator treatment process, thereby hindering the achievement of accurate prediction of ventilator parameters. To address these challenges, we propose a novel approach called the long short-term memory relation network (LSTMRnet). Our approach uses a long, short-term memory bank to store rich information and an important feature selection step to extract relevant features related to respiratory parameters. This information is obtained from the prior knowledge of the follow up model. We also concatenate the embeddings of both information types to maintain the joint learning of spatio-temporal features. Our LSTMRnet effectively preserves both time-series and complex spatial-critical feature information, enabling an accurate prediction of ventilator parameters. We extensively validate our approach using the publicly available medical information mart for intensive care (MIMIC-III) dataset and achieve superior results, which can be potentially utilized for ventilator treatment (i.e., sleep apnea-hypopnea syndrome ventilator treatment and intensive care units ventilator treatment.
Citation: Xihe Qiu, Xiaoyu Tan, Chenghao Wang, Shaotao Chen, Bin Du, Jingjing Huang. A long short-temory relation network for real-time prediction of patient-specific ventilator parameters[J]. Mathematical Biosciences and Engineering, 2023, 20(8): 14756-14776. doi: 10.3934/mbe.2023660
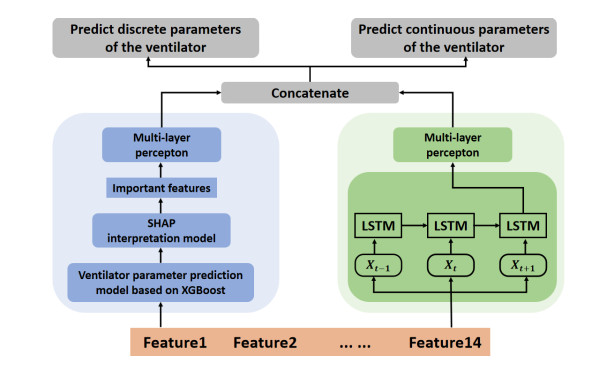
Accurate prediction of patient-specific ventilator parameters is crucial for optimizing patient-ventilator interaction. Current approaches encounter difficulties in concurrently observing long-term, time-series dependencies and capturing complex, significant features that influence the ventilator treatment process, thereby hindering the achievement of accurate prediction of ventilator parameters. To address these challenges, we propose a novel approach called the long short-term memory relation network (LSTMRnet). Our approach uses a long, short-term memory bank to store rich information and an important feature selection step to extract relevant features related to respiratory parameters. This information is obtained from the prior knowledge of the follow up model. We also concatenate the embeddings of both information types to maintain the joint learning of spatio-temporal features. Our LSTMRnet effectively preserves both time-series and complex spatial-critical feature information, enabling an accurate prediction of ventilator parameters. We extensively validate our approach using the publicly available medical information mart for intensive care (MIMIC-III) dataset and achieve superior results, which can be potentially utilized for ventilator treatment (i.e., sleep apnea-hypopnea syndrome ventilator treatment and intensive care units ventilator treatment.

| [1] |
P. H. Wicky, M. S. Niedermann, J. F. Timsit, Ventilator-associated pneumonia in the era of COVID-19 pandemic: How common and what is the impact?, Crit. Care, 25 (2021), 1–3. https://doi.org/10.1186/s13054-021-03571-z doi: 10.1186/s13054-021-03571-z

|
| [2] |
M. M. Cvach, J. E. Stokes, S. H. Manzoor, P. O. Brooks, T. S. Burger, A. Gottschalk, et al., Ventilator alarms in intensive care units: frequency, duration, priority, and relationship to ventilator parameters, Anesth. Analg., 130 (2020), 9–13. https://doi.org/10.1213/ANE.0000000000003801 doi: 10.1213/ANE.0000000000003801
|
| [3] |
S. C. Auld, M. Caridi-Scheible, J. M. Blum, C. Robichaux, C. Kraft, J. T. Jacob, et al., ICU and ventilator mortality among critically ill adults with coronavirus disease 2019, Crit. Care Med., 48 (2020), 799–804. https://doi.org/10.1097/CCM.0000000000004457 doi: 10.1097/CCM.0000000000004457
|
| [4] |
N. J. Meyer, L. Gattinoni, C. S. Calfee, Acute respiratory distress syndrome, Lancet, 398 (2021), 622–637. https://doi.org/10.1016/S0140-6736(21)00439-6 doi: 10.1016/S0140-6736(21)00439-6
|
| [5] |
R. Chand, E. R.Swenson, D. S. Goldfarb, Sodium bicarbonate therapy for acute respiratory acidosis, Curr. Opin. Nephrol. Hypertens., 30 (2021), 223–230. https://doi.org/10.1097/MNH.0000000000000687 doi: 10.1097/MNH.0000000000000687
|
| [6] |
T. Nemoto, G. E. Hatzakis, C. W.Thorpe, R. Olivenstein, S. Dial, J. H. T. Bates, Automatic control of pressure support mechanical ventilation using fuzzy logic, Am. J. Respir. Crit. Care Med., 160 (1999), 550–556. https://doi.org/10.1164/ajrccm.160.2.9809013 doi: 10.1164/ajrccm.160.2.9809013
|
| [7] |
S. E. Rees, C. Allerød, D. Murley, Y. Zhao, B. W. Smith, S. Kjaergaard, et al., Using physiological models and decision theory for selecting appropriate ventilator settings, J. Clin. Monit. Comput., 20 (2006), 421–429. https://doi.org/10.1007/s10877-006-9049-5 doi: 10.1007/s10877-006-9049-5
|
| [8] |
D. S. Karbing, C. Allerød, L. P. Thomsen, K. Espersen, P. Thorgaard, S. Andreassen, et al., Retrospective evaluation of a decision support system for controlled mechanical ventilation, Med. Biol. Eng. Comput., 50 (2012), 43–51. https://doi.org/10.1007/s11517-011-0843-y doi: 10.1007/s11517-011-0843-y
|
| [9] |
R. L. Chatburn, E. Mireles-Cabodevila, Closed-loop control of mechanical ventilation: description and classification of targeting schemes, Respir. Care, 56 (2011), 85–102. https://doi.org/10.4187/respcare.00967 doi: 10.4187/respcare.00967
|
| [10] |
F. D. Marco, S. Centanni, A. Bellone, G. Messinesi, A. Pesci, R. Scala, et al., Optimization of ventilator setting by flow and pressure waveforms analysis during noninvasive ventilation for acute exacerbations of COPD: a multicentric randomized controlled trial, Crit. Care, 15 (2011), 1–9. https://doi.org/10.1186/cc10567 doi: 10.1186/cc10567
|
| [11] |
D. S. Karbing, S. Spadaro, N. Dey, R. Ragazzi, E. Marangoni, F. D. Corte, et al., An open-loop, physiologic model-based decision support system can provide appropriate ventilator settings, Crit. Care Med., 46 (2018), 642–648. https://doi.org/10.1097/CCM.0000000000003133 doi: 10.1097/CCM.0000000000003133
|
| [12] |
N. Burkart, N. F. Huber, A survey on the explainability of supervised machine learning, J. Artif. Intell. Res., 70 (2021), 245–317. https://doi.org/10.1613/jair.1.12228 doi: 10.1613/jair.1.12228
|
| [13] |
S. Kushwaha, S. Bahl, A. K. Bagha, K. S. Parmar, M. Javaid, A. Haleem, et al., Significant applications of machine learning for COVID-19 pandemic, J. Ind. Integr. Manage., 5 (2020), 453–479. https://doi.org/10.1142/S2424862220500268 doi: 10.1142/S2424862220500268
|
| [14] |
Y. Ru, X. Qiu, X. Tan, B. Chen, Y. Gao, Y. Jin, Sparse-attentive meta temporal point process for clinical decision support, Neurocomputing, 485 (2022), 114–123. https://doi.org/10.1016/j.neucom.2022.02.028 doi: 10.1016/j.neucom.2022.02.028
|
| [15] |
A. S. Kwekha-Rashid, H. N. Abduljabbar, B. Alhayani, Coronavirus disease (COVID-19) cases analysis using machine-learning applications, Appl. Nanosci., 13 (2023), 2013–2025. https://doi.org/10.1007/s13204-021-01868-7 doi: 10.1007/s13204-021-01868-7
|
| [16] |
L. Yang, A. Shami, On hyperparameter optimization of machine learning algorithms: Theory and practice, Neurocomputing, 415 (2020), 295–316. https://doi.org/10.1016/j.neucom.2020.07.061 doi: 10.1016/j.neucom.2020.07.061
|
| [17] |
X. Qiu, X. Tan, Q. Li, S. Chen, Y. Ru, Y. Jin, A latent batch-constrained deep reinforcement learning approach for precision dosing clinical decision support, Knowl.-Based Syst., 237 (2022), 107689. https://doi.org/10.1016/j.knosys.2021.107689 doi: 10.1016/j.knosys.2021.107689
|
| [18] |
M. Barish, S. Bolourani, L. F. Lau, S. Shah, T. P. Zanos, External validation demonstrates limited clinical utility of the interpretable mortality prediction model for patients with COVID-19, Nat. Mach. Intell., 3 (2021), 25–27. https://doi.org/10.1038/s42256-020-00254-2 doi: 10.1038/s42256-020-00254-2
|
| [19] |
X. Li, H. Xiong, X. Li, X. Wu, X. Zhang, J. Liu, et al., Interpretable deep learning: Interpretation, interpretability, trustworthiness, and beyond, Knowl. Inf. Syst., 64 (2022), 3197–3234. https://doi.org/10.1007/s10115-022-01756-8 doi: 10.1007/s10115-022-01756-8
|
| [20] |
S. Chen, X. Qiu, X. Tan, Z. Fang, Y. Jin, A model-based hybrid soft actor-critic deep reinforcement learning algorithm for optimal ventilator settings, Inf. Sci., 611 (2022), 47–64. https://doi.org/10.1016/j.ins.2022.08.028 doi: 10.1016/j.ins.2022.08.028
|
| [21] |
H. Carmichael, J. Coquet, R. Sun, S. Sang, D. Groat, S. M. Asch, et al., Learning from past respiratory failure patients to triage COVID-19 patient ventilator needs: A multi-institutional study, J. Biomed. Inf., 119 (2021), 103802. https://doi.org/10.1016/j.jbi.2021.103802 doi: 10.1016/j.jbi.2021.103802
|
| [22] |
F. P. Akbulut, E. Akkur, A. Akan, B. S. Yarman, A decision support system to determine optimal ventilator settings, BMC Med. Inf. Decis. Making, 14 (2014), 1–11. https://doi.org/10.1186/1472-6947-14-3 doi: 10.1186/1472-6947-14-3
|
| [23] |
S. Ghazal, M. Sauthier, D. Brossier, W. Bouachir, P. A. Jouvet, R. Noumeir, Using machine learning models to predict oxygen saturation following ventilator support adjustment in critically ill children: A single center pilot study, PloS One, 14 (2019), 0198921. https://doi.org/10.1371/journal.pone.0198921 doi: 10.1371/journal.pone.0198921
|
| [24] |
A. Peine, A. Hallawa, J. Bickenbach, G. Dartmann, L. B. Fazlic, A. Schmeink, et al., Development and validation of a reinforcement learning algorithm to dynamically optimize mechanical ventilation in critical care, NPJ. Digit. Med., 4 (2021), 32. https://doi.org/10.1038/s41746-021-00388-6 doi: 10.1038/s41746-021-00388-6
|
| [25] |
S. Radhakrishnan, S. G. Nair, J. Isaac, Multilayer perceptron neural network model development for mechanical ventilator parameters prediction by real time system learning, Biomed. Signal Process. Control, 71 (2022), 103170. https://doi.org/10.1007/s10877-006-9049-5 doi: 10.1007/s10877-006-9049-5
|
| [26] |
M. A. Deif, A. A. A. Solyman, M. H. Alsharif, P. Uthansakul, Automated triage system for intensive care admissions during the COVID-19 pandemic using hybrid XGBoost-AHP approach, Sensors, 21 (2021), 6379. https://doi.org/10.3390/s21196379 doi: 10.3390/s21196379
|
| [27] |
L. Zhuo, M. Yoneda, M. Zhao, W. Yingsung, N. Yoshida, Y. kitagawa, et al., Defect in SHAP-hyaluronan complex causes severe female infertility: A study by inactivation of the bikunin gene in mice, J. Biol. Chem., 276 (2001), 7693–7696. https://doi.org/10.1074/jbc.C000899200 doi: 10.1074/jbc.C000899200
|
| [28] |
H. Niu, K. Xu, A hybrid model combining variational mode decomposition and an attention-GRU network for stock price index forecasting, Math. Biosci. Eng., 17 (2020), 7151–7166. https://doi.org/10.3934/mbe.2020367 doi: 10.3934/mbe.2020367
|
| [29] |
F. Tehrani, M. Rogers, T. Lo, T. Malinowski, S. Afuwape, M. Lum, et al., A dual closed-loop control system for mechanical ventilation, J. Clin. Monit. Comput., 18 (2004), 111–129. https://doi.org/10.1023/B:JOCM.0000032744.99885.38 doi: 10.1023/B:JOCM.0000032744.99885.38
|
| [30] |
L. Yan, H. T. Zhang, J. Goncalves, X. Yang, M. Wang, Y. Guo, et al., An interpretable mortality prediction model for COVID-19 patients, Nat. Mach. intell., 2 (2020), 283–288. https://doi.org/10.1038/s42256-020-0180-7 doi: 10.1038/s42256-020-0180-7
|
| [31] |
W. Chen, H. Huang, P. Ko, W. Su, C. Kao, S. Su, A simple algorithm using ventilator parameters to predict successfully rapid weaning program in cardiac intensive care unit patients, J. Pers. Med., 12 (2022), 501. https://doi.org/10.3390/jpm12030501 doi: 10.3390/jpm12030501
|
| [32] |
Y. Zhu, J. Zhang, G. Wang, R. Yao, C. Ren, C. Chen, et al., Machine learning prediction models for mechanically ventilated patients: analyses of the MIMIC-III database, Front. Med., 8 (2021), 955. https://doi.org/10.3389/fmed.2021.662340 doi: 10.3389/fmed.2021.662340
|
| [33] |
S. S. O. Venkata, A. Koenig, R. M. Pidaparti, Mechanical ventilator parameter estimation for lung health through machine learning, Bioengineering, 8 (2021), 60. https://doi.org/10.3390/bioengineering8050060 doi: 10.3390/bioengineering8050060
|
| [34] |
A. I. A. Osman, A. N. Ahmed, M. F. Chow, Y. F. Huang, A. El-Shafie, Extreme gradient boosting (Xgboost) model to predict the groundwater levels in Selangor Malaysia, Ain Shams Eng. J., 12 (2021), 1545–1556. https://doi.org/10.1016/j.asej.2020.11.011 doi: 10.1016/j.asej.2020.11.011
|
| [35] |
K. Aas, M. Jullum, A. Løland, Explaining individual predictions when features are dependent: More accurate approximations to Shapley values, Artif. Intell., 298 (2021), 103502. https://doi.org/10.1016/j.artint.2021.103502 doi: 10.1016/j.artint.2021.103502
|
| [36] |
A. Chaddad, J. Peng, J. Xu, A. Bouridane, Survey of explainable AI techniques in healthcare, Sensors, 23 (2023), 634. https://doi.org/10.3390/s23020634 doi: 10.3390/s23020634
|
| [37] |
Y. Meng, N. Yang, Z. Qian, G. Zhang, What makes an online review more helpful: An interpretation framework using XGBoost and SHAP values, J. Theor. Appl. Electron. Commer. Res., 16 (2021), 466–490. https://doi.org/10.3390/jtaer16030029 doi: 10.3390/jtaer16030029
|
| [38] |
G. Van Houdt, C. Mosquera, G. Nápoles, A review on the long short-term memory model, Artif. Intell. Rev., 53 (2020), 5929–5955. https://doi.org/10.1007/s10462-020-09838-1 doi: 10.1007/s10462-020-09838-1
|
| [39] | Z. He, Y. Gao, X. Wang, Analysis of related factors of 48 non-survivors transferred or re-admitted to intensive care unit, Chin. Crit. Care Med., 18 (2006), 740–742. |
| [40] |
L. Zhao, J. Liu, J. Ren, Impact of various ventilation modes on IAQ and energy consumption in Chinese dwellings: First long-term monitoring study in Tianjin, China, Buil. Environ., 143 (2018), 99–106. https://doi.org/10.1016/j.buildenv.2018.06.057 doi: 10.1016/j.buildenv.2018.06.057
|
| [41] |
S. Cao, C. Ren, Ventilation control strategy using low-dimensional linear ventilation models and artificial neural network, Build. Environ., 144 (2018), 316–333. https://doi.org/10.1016/j.buildenv.2018.08.032 doi: 10.1016/j.buildenv.2018.08.032
|
| [42] |
G. Bellani, A. Grassi, S. Sosio, S. Gatti, B. P. Kavanagh, A. Pesenti, et al., Driving pressure is associated with outcome during assisted ventilation in acute respiratory distress syndrome, Anesthesiology, 131 (2019), 594–604. https://doi.org/10.1097/ALN.0000000000002846 doi: 10.1097/ALN.0000000000002846
|


Figures(6) / Tables(7)

Xihe Qiu, Xiaoyu Tan, Chenghao Wang, Shaotao Chen, Bin Du, Jingjing Huang. A long short-temory relation network for real-time prediction of patient-specific ventilator parameters[J]. Mathematical Biosciences and Engineering, 2023, 20(8): 14756-14776. doi: 10.3934/mbe.2023660


 DownLoad: