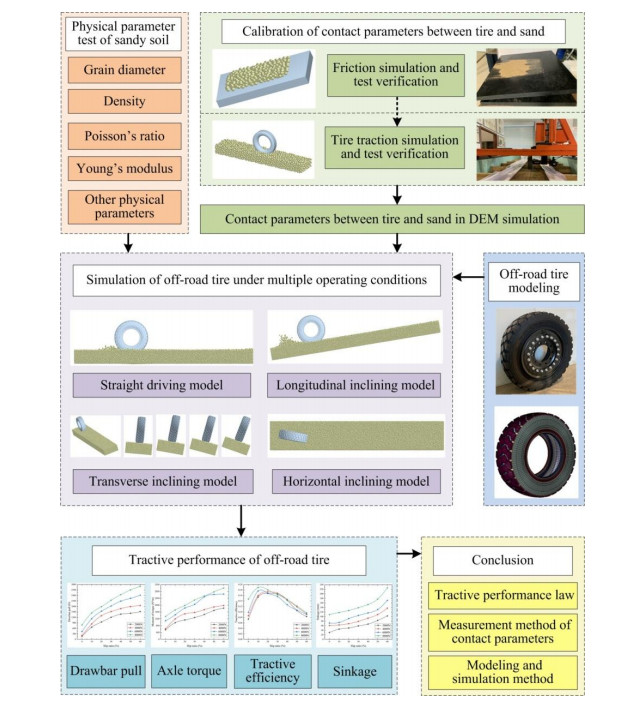
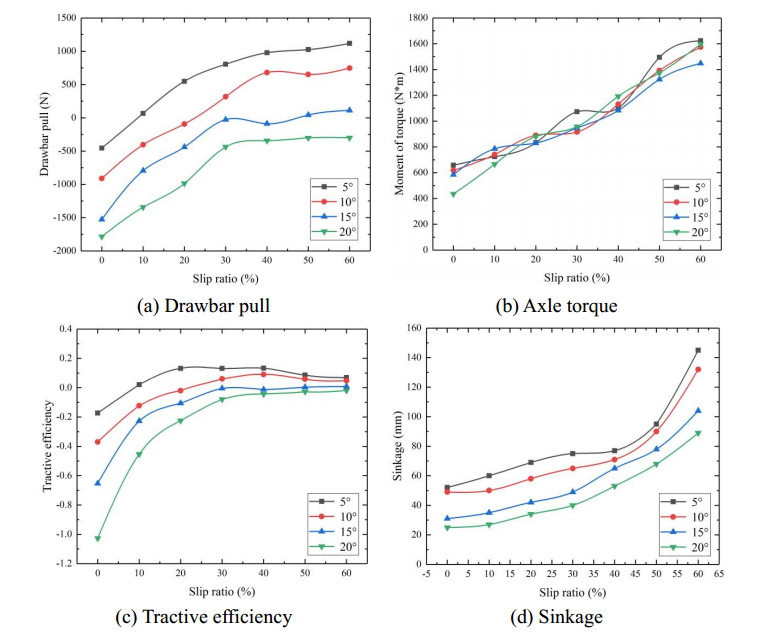
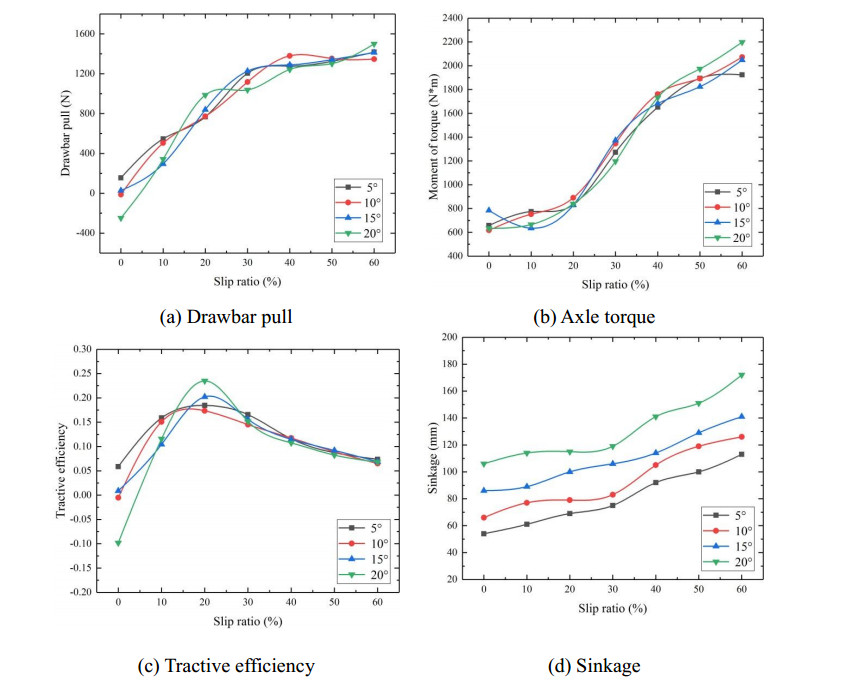
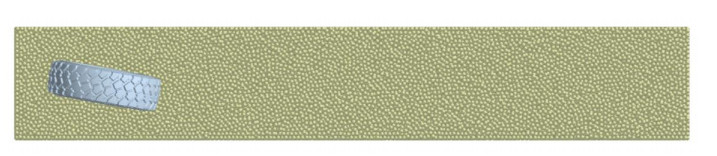
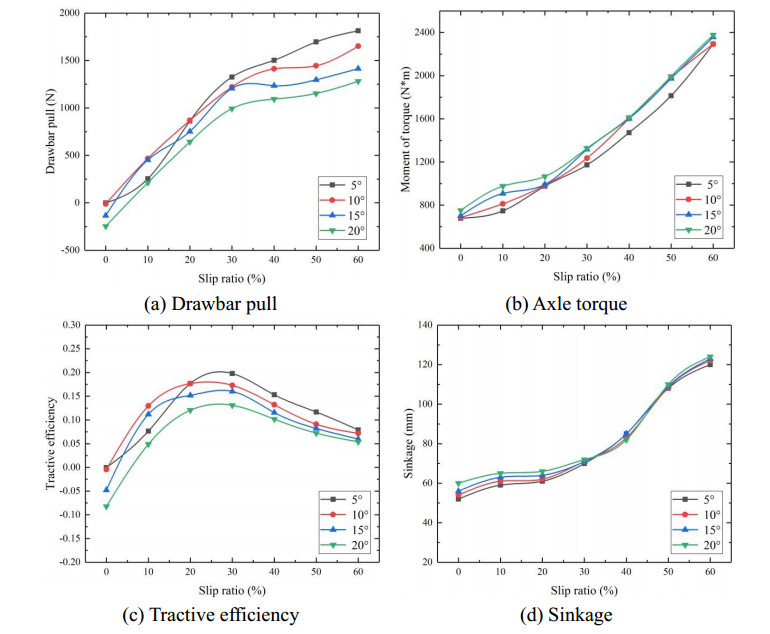
In order to improve the applicability and prediction accuracy of the existing simulation test methods of vehicle tractive performance on sandy soil, the off-road tire model using the discrete element method (DEM) under each operating condition is separately established in this paper. The contact parameters of DEM model are calibrated by rubber-sand friction test and soil bin test combined with corresponding simulation test. On this basis, the tire-sand simulation model is calculated under straight and inclining driving conditions, and the variation law of drawbar pull, torque, tractive efficiency and sinkage is obtained. This paper proves the feasibility of DEM simulation in studying vehicle tractive performance, and also provides a systematic parameter calibration method for improving the accuracy of DEM simulation, which is of great significance to enrich vehicle testing methods.
Citation: Linxuan Zhou, Jingwei Gao, Qiao Li, Cheng Hu. Simulation study on tractive performance of off-road tire based on discrete element method[J]. Mathematical Biosciences and Engineering, 2020, 17(4): 3869-3893. doi: 10.3934/mbe.2020215
In order to improve the applicability and prediction accuracy of the existing simulation test methods of vehicle tractive performance on sandy soil, the off-road tire model using the discrete element method (DEM) under each operating condition is separately established in this paper. The contact parameters of DEM model are calibrated by rubber-sand friction test and soil bin test combined with corresponding simulation test. On this basis, the tire-sand simulation model is calculated under straight and inclining driving conditions, and the variation law of drawbar pull, torque, tractive efficiency and sinkage is obtained. This paper proves the feasibility of DEM simulation in studying vehicle tractive performance, and also provides a systematic parameter calibration method for improving the accuracy of DEM simulation, which is of great significance to enrich vehicle testing methods.

| [1] |
Y. Du, J. Gao, L. Jiang, Development and numerical validation of an improved prediction model for wheel-soil interaction under multiple operating conditions, J. Terramech., 79 (2018), 1-21. doi: 10.1016/j.jterra.2018.04.005

|
| [2] |
Y. Zhang, J. Gao, Q. Li, Experimental study on friction coefficients between tire tread rubber and ice, AIP. Adv., 8 (2018), 075005. doi: 10.1063/1.5041049
|
| [3] | Y. Zhang, J. Gao, Q. Li, Study on tire-ice traction using a combined neural network and secondary development finite element modeling method, Concurr. Comp. Pract. E., 31 (2019), e5045. |
| [4] |
I. C. Schmid, Interaction of vehicle and terrain results from 10 years research at IKK, J. Terramech., 32 (1995), 3-26. doi: 10.1016/0022-4898(95)00005-L
|
| [5] |
M. Momozu, A. Oida, M. Yamazaki, Simulation of a soil loosening process by means of the modified distinct element method, J. Terramech., 39 (2002), 207-220. doi: 10.1016/S0022-4898(03)00011-9
|
| [6] |
F. Koichiro, U. Masami, H. Koichi, Mathematical models for soil displacement under a rigid wheel, J. Terramech., 43 (2006), 287-301. doi: 10.1016/j.jterra.2005.05.005
|
| [7] |
W. Smith, H. Peng, Modeling of wheel-soil interaction over rough terrain using the discrete element method, J. Terramech., 50 (2013), 277-287. doi: 10.1016/j.jterra.2013.09.002
|
| [8] | P. A. Cundall, The Measurement and Analysis of Acceleration on Rock Slopes, Doctoral dissertation, University of London, 1971. |
| [9] | P. A. Cundall, In A computer model for simulating progressive large scale movements in blocky rock systems, Proceedings of the Symposium of the International Society of Rock Mechanics, France, 1 (1971), 8-12. |
| [10] | J. Li, Y. Zhang, J. Zhou, Study on prediction method of the sinkage of track with big shoes, Agri. Equip. Veh. Eng., 51 (2013), 33-36. |
| [11] | F. Dai, X. Song, W. Zhao, F. Zhang, H. Ma, M. Ma, Simulative calibration on contact parameters of discrete elements for covering soil on whole plastic film mulching on double ridges, Trans. Chin. Soc. Agri. Mach., 50 (2019), 50-56. |
| [12] | X. Wang, H. Hu, Q. Wang, H. Li, J. He, W. Chen, Calibration method of soil contact parameters based on DEM theory, J. Agri. Mach., 48 (2017), 78-85. |
| [13] | A. Oida, S. Ohkubo, In Effect of tire lug cross section on tire performance simulated by distinct element method, Proceedings of 13th International Conference of ISTVS, (1999), 345-352. |
| [14] | H. Fujii, A. Oida, H. Nakashima, In Analysis of Interaction between lunar terrain-wheel and treaded wheel by distinct element method, Proceedings of 14th International Conference of ISTVS, (2002), 323-328. |
| [15] | Y. Xu, Modeling and methodological strategy of discrete element method simulation for tillage soil dynamics, Trans. Chin. Soc. Agri. Eng., 19 (2003), 34-37. |
| [16] |
H. Nakashima, A. Oida, Algorithm and implementation of soil-tire contact analysis code based on dynamic FE-DE method, J. Terramech., 41 (2004), 127-137. doi: 10.1016/j.jterra.2004.02.002
|
| [17] |
Z. Asaf, D. Rubinstein, I. Shmulevich, Evaluation of link-track performances using DEM, J. Terramech., 43 (2006), 141-161. doi: 10.1016/j.jterra.2004.10.004
|
| [18] | H. Nakashima, H. Fujii, A. Oida, M. Momozu, Y. Kawase, H. Kanamori, et al., Parametric analysis of lugged wheel performance for a lunar microrover by means of DEM, J. Terramech., 44 (2007), 153-162. |
| [19] | M. Zou, Study on Traction Ability for Driving Wheel of the Lunar Rover, Doctoral dissertation, Jilin University, 2009. |
| [20] | Y. Zuo, Dynamic modeling and application of soil for vehicle terramechanics, J. Lanzhou. Univ., 45 (2009), 110-113. |
| [21] |
T. Koizumi, N. Tsujiuchi, R. Akatsuka, Analysis of interaction between grouser and soil using distinct element method (DEM), J. Syst. Des. Dynam., 4 (2010), 914-927. doi: 10.1299/jsdd.4.914
|
| [22] |
F. Wakui, Y. Terumichi, Three-dimensional numerical simulation of tire behavior on soft ground, Trans. Jpn. Soc. Mech. Eng., 77 (2011), 3264-3277. doi: 10.1299/kikaic.77.3264
|
| [23] | Y. Wang, The Analysis of the Interaction Between Wheel and Soft Ground Based on DEM, Doctoral dissertation, Jilin University, 2012. |
| [24] | F. Liu, Research on Dynamic Simulation System of the Interaction Between Irregular Structure Wheel and Loose Lunar Soil Simulant, Doctoral dissertation, Jilin University, 2013. |
| [25] | R. Zhang, Bionic design of configuration of rigid wheel moving on sand and numerical analysis on its traction performance, Trans. Chin. Soc. Agri. Eng., 31 (2015), 122-128. |
| [26] |
W. Smith, D. Melanz, C. Senatore, Comparison of discrete element method and traditional modeling methods for steady-state wheel-terrain interaction of small vehicles, J. Terramech., 56 (2014), 61-75. doi: 10.1016/j.jterra.2014.08.004
|
| [27] | R. Shi, Research on Influencr of Low Gravity to Mechanical Properties of Lunar Soil Simulant and Interaction Between Lunar Soil Simulant and Lunar Rover, Doctoral dissertation, Jilin University, 2014. |
| [28] |
C. Zhao, M. Zang, Analysis of rigid tire traction performance on a sandy soil by 3D finite element-discrete element method, J. Terramech., 55 (2014), 29-37. doi: 10.1016/j.jterra.2014.05.005
|
| [29] |
J. Johnson, A. Kulchitsky, P. Duvoy, Discrete element method simulations of Mars exploration rover wheel performance, J. Terramech., 62 (2015), 31-40. doi: 10.1016/j.jterra.2015.02.004
|
| [30] | X. Li, Analysis of Tractive Performance for Wheel on Sandy Road Using Discrete Element Method, Doctoral dissertation, National University of Defense Technology, 2015. |
| [31] |
Y. Du, J. Gao, L. Jiang, Numerical analysis of lug effects on tractive performance of off-road wheel by DEM, J. Braz. Soc. Mech. Sci. Eng., 39 (2017), 1977-1987. doi: 10.1007/s40430-016-0633-4
|
| [32] |
K. Nishiyama, H. Nakashima, H. Shimizu, 2D FE-DEM analysis of contact stress and tractive performance of a tire driven on dry sand, J. Terramech., 74 (2017), 25-33. doi: 10.1016/j.jterra.2017.09.003
|
| [33] |
S. Kumar, Effect of ballasting on performance characteristics of bias and radial ply tyres with zero sinkage, Measurement, 121 (2018), 218-224. doi: 10.1016/j.measurement.2018.02.043
|
| [34] | R. Kumar, Deflection characteristics for radial-ply tractor tyres, J. Pharmacogn. Phytochem., 7 (2018), 2016-2021. |
| [35] | J. F. Peters, F. Vahedifard, B. Jelinek, G. Mason, In The discrete element method for vehicle-terrain analysis, Proceedings of the 15th European-African Regional Conference of the International Society for Terrain-Vehicle Systems, Prague, 2019. |
| [36] |
S. Kumar, Performance characteristics of mode of ballast on energy efficiency indices of agricultural tyre in different terrain condition in controlled soil bin environment, Energy, 182 (2019), 48-56. doi: 10.1016/j.energy.2019.06.043
|
| [37] | G. Wang, W. Hao, J. Wang, Discrete Element Method and Its Practice in EDEM, Northwestern Polytechnical University Press, Xi'an, (2010), 26-74. |
| [38] |
P. Jayakumar, D. Melanz, J. Maclennan, Scalability of classical terramechanics models for lightweight vehicle applications incorporating stochastic modeling and uncertainty propagation, J. Terramech., 54 (2014), 37-57. doi: 10.1016/j.jterra.2014.04.004
|
| [39] |
C. Senatore, K. Iagnemma, Analysis of stress distributions under lightweight wheeled vehicles, J. Terramech., 51 (2014), 1-17. doi: 10.1016/j.jterra.2013.10.003
|
| [40] |
J. Y. Wong, A. R. Reece, Prediction of rigid wheel performance based on the analysis of soil-wheel stresses: Part I: Performance of driven rigid wheels, J. Terramech., 4 (1967), 81-98. doi: 10.1016/0022-4898(67)90105-X
|
| [41] | GB/T50123-1999, Industrial Standards of the People's Republic of China, Standard for Soil Test Method, 1999. |
| [42] | L. Shi, W. Zhao, W. Sun, Parameter calibration of soil particles contact model of farmland soil in northwest arid region based on discrete element method, Trans. Chin. Soc. Agri. Eng., 33 (2017), 181-187. |
| [43] | R. Zhang, T. Han, Q. Ji, Y. He, J. Li, Calibration methods of sandy soil parameters in simulation of discrete element method, J. Agri. Mach., 48 (2017), 49-56. |
| [44] |
Y. Du, J. Gao, L. Jiang, Numerical analysis on tractive performance of off-road wheel steering on sand using discrete element method, J. Terramech., 71 (2017), 25-43. doi: 10.1016/j.jterra.2017.02.001
|
| [45] | Y. He, W. Xiang, M. Wu, Parameters calibration of loam soil for discrete element simulation based on the repose angle of particle heap, J. Hunan. Agri. Univ., 44 (2018), 216-220. |
| [46] | J. Li, J. Tong, B. Hu, Calibration of parameters of interaction between clayey black soil with different moisture content and soil-engaging component in northeast China, Trans. Chin. Soc. Agri. Eng., 35 (2019), 130-140. |
Figures(23) / Tables(4)

Linxuan Zhou, Jingwei Gao, Qiao Li, Cheng Hu. Simulation study on tractive performance of off-road tire based on discrete element method[J]. Mathematical Biosciences and Engineering, 2020, 17(4): 3869-3893. doi: 10.3934/mbe.2020215


 DownLoad: