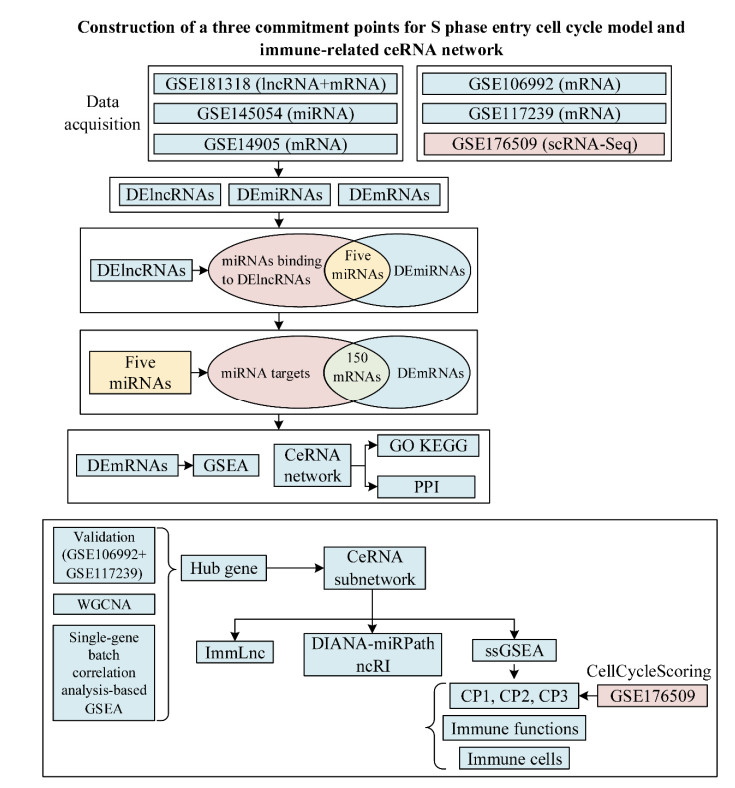
While competing endogenous RNAs (ceRNAs) play pivotal roles in various diseases, the proliferation and differentiation of keratinocytes are becoming a research focus in psoriasis. Therefore, the three commitment points for S phase entry (CP1–3) cell cycle model has pointed to a new research direction in these areas. However, it is unclear what role ceRNA regulatory mechanisms play in the interaction between keratinocytes and the immune system in psoriasis. In addition, the ceRNA network-based screening of potential therapeutic agents for psoriasis has not been explored. Therefore, we used multiple bioinformatics approaches to construct a ceRNA network for psoriasis, identified CTGF as the hub gene, and constructed a ceRNA subnetwork, after which validation datasets authenticated the results' accuracy. Subsequently, we used multiple online databases and the single-sample gene-set enrichment analysis algorithm, including the CP1–3 cell cycle model, to explore the mechanisms accounting for the increased proliferation and differentiation of keratinocytes and the possible roles of the ceRNA subnetwork in psoriasis. Next, we performed cell cycle and cell trajectory analyses based on a single-cell RNA-seq dataset of psoriatic skin biopsies. We also used weighted gene co-expression network analysis and single-gene batch correlation analysis-based gene set enrichment analysis to explore the functions of CTGF. Finally, we used the Connectivity Map to identify MS-275 (entinostat) as a novel treatment for psoriasis, SwissTargetPrediction to predict drug targets, and molecular docking to investigate the minimum binding energy and binding sites of the drug to target proteins.
Citation: Jingxi Xu, Jiangtao Li. Construction of a three commitment points for S phase entry cell cycle model and immune-related ceRNA network to explore novel therapeutic options for psoriasis[J]. Mathematical Biosciences and Engineering, 2022, 19(12): 13483-13525. doi: 10.3934/mbe.2022630
While competing endogenous RNAs (ceRNAs) play pivotal roles in various diseases, the proliferation and differentiation of keratinocytes are becoming a research focus in psoriasis. Therefore, the three commitment points for S phase entry (CP1–3) cell cycle model has pointed to a new research direction in these areas. However, it is unclear what role ceRNA regulatory mechanisms play in the interaction between keratinocytes and the immune system in psoriasis. In addition, the ceRNA network-based screening of potential therapeutic agents for psoriasis has not been explored. Therefore, we used multiple bioinformatics approaches to construct a ceRNA network for psoriasis, identified CTGF as the hub gene, and constructed a ceRNA subnetwork, after which validation datasets authenticated the results' accuracy. Subsequently, we used multiple online databases and the single-sample gene-set enrichment analysis algorithm, including the CP1–3 cell cycle model, to explore the mechanisms accounting for the increased proliferation and differentiation of keratinocytes and the possible roles of the ceRNA subnetwork in psoriasis. Next, we performed cell cycle and cell trajectory analyses based on a single-cell RNA-seq dataset of psoriatic skin biopsies. We also used weighted gene co-expression network analysis and single-gene batch correlation analysis-based gene set enrichment analysis to explore the functions of CTGF. Finally, we used the Connectivity Map to identify MS-275 (entinostat) as a novel treatment for psoriasis, SwissTargetPrediction to predict drug targets, and molecular docking to investigate the minimum binding energy and binding sites of the drug to target proteins.

| [1] |
A. M. Bowcock, J. G. Krueger, Getting under the skin: the immunogenetics of psoriasis, Nat. Rev. Immunol., 5 (2005), 699–711. https://doi.org/10.1038/nri1689 doi: 10.1038/nri1689

|
| [2] |
C. E. Griffiths, J. N. Barker, Pathogenesis and clinical features of psoriasis, Lancet, 370 (2007), 263–271. https://doi.org/10.1016/s0140-6736(07)61128-3 doi: 10.1016/s0140-6736(07)61128-3
|
| [3] |
J. Li, X. Li, R. Hou, R. Liu, X. Zhao, F. Dong, et al., Psoriatic T cells reduce epidermal turnover time and affect cell proliferation contributed from differential gene expression, JAMA Dermatol., 42 (2015), 874–880. https://doi.org/10.1111/1346-8138.12961 doi: 10.1111/1346-8138.12961
|
| [4] |
A. Gandarillas, The mysterious human epidermal cell cycle, or an oncogene-induced differentiation checkpoint, Cell Cycle, 11 (2012), 4507–4516. https://doi.org/10.4161/cc.22529 doi: 10.4161/cc.22529
|
| [5] |
P. J. Hauser, D. Agrawal, W. J. Pledger, Primary keratinocytes have an adhesion dependent S phase checkpoint that is absent in immortalized cell lines, Oncogene, 17 (1998), 3083–3092. https://doi.org/10.1038/sj.onc.1202235 doi: 10.1038/sj.onc.1202235
|
| [6] |
A. Gandarillas, D. Davies, J. M. Blanchard, Normal and c-Myc-promoted human keratinocyte differentiation both occur via a novel cell cycle involving cellular growth and endoreplication, Oncogene, 19 (2000), 3278–3289. https://doi.org/10.1038/sj.onc.1203630 doi: 10.1038/sj.onc.1203630
|
| [7] |
C. Albanesi, S. Madonna, P. Gisondi, G. Girolomoni, The interplay between keratinocytes and immune cells in the pathogenesis of psoriasis, Front. Immunol., 9 (2018), 1549. https://doi.org/10.3389/fimmu.2018.01549 doi: 10.3389/fimmu.2018.01549
|
| [8] |
F. Verrecchia, M. Pessah, A. Atfi, A. Mauviel, Tumor necrosis factor-alpha inhibits transforming growth factor-beta /Smad signaling in human dermal fibroblasts via AP-1 activation, J. Biol. Chem., 275 (2000), 30226–30231. https://doi.org/10.1074/jbc.M005310200 doi: 10.1074/jbc.M005310200
|
| [9] |
F. Q. Wen, X. Liu, T. Kobayashi, S. Abe, Q. Fang, T. Kohyama, et al., Interferon-gamma inhibits transforming growth factor-beta production in human airway epithelial cells by targeting Smads, Am. J. Respir. Cell Mol. Biol., 30 (2004), 816–822. https://doi.org/10.1165/rcmb.2002-0249OC doi: 10.1165/rcmb.2002-0249OC
|
| [10] |
D. E. Brash, Roles of the transcription factor p53 in keratinocyte carcinomas, Br. J. Dermatol., 154 (2006), 8–10. https://doi.org/10.1111/j.1365-2133.2006.07230.x doi: 10.1111/j.1365-2133.2006.07230.x
|
| [11] |
C. S. Murphy, J. A. Pietenpol, K. Münger, P. M. Howley, H. L. Moses, c-myc and pRB: role in TGF-beta 1 inhibition of keratinocyte proliferation, Cold Spring Harb. Symp. Quant. Biol., 56 (1991), 129–135. https://doi.org/10.1101/sqb.1991.056.01.017 doi: 10.1101/sqb.1991.056.01.017
|
| [12] |
J. W. Harbour, R. X. Luo, A. Dei Santi, A. A. Postigo, D. C. Dean, Cdk phosphorylation triggers sequential intramolecular interactions that progressively block Rb functions as cells move through G1, Cell, 98 (1999), 859–869. https://doi.org/10.1016/s0092-8674(00)81519-6 doi: 10.1016/s0092-8674(00)81519-6
|
| [13] |
G. Yao, T. J. Lee, S. Mori, J. R. Nevins, L. You, A bistable Rb-E2F switch underlies the restriction point, Nat. Cell Biol., 10 (2008), 476–482. https://doi.org/10.1038/ncb1711 doi: 10.1038/ncb1711
|
| [14] |
S. L. Spencer, S. D. Cappell, F. C. Tsai, K. W. Overton, C. L. Wang, T. Meyer, The proliferation-quiescence decision is controlled by a bifurcation in CDK2 activity at mitotic exit, Cell, 155 (2013), 369–383. https://doi.org/10.1016/j.cell.2013.08.062 doi: 10.1016/j.cell.2013.08.062
|
| [15] |
H. W. Yang, M. Chung, T. Kudo, T. Meyer, Competing memories of mitogen and p53 signalling control cell-cycle entry, Nature, 549 (2017), 404–408. https://doi.org/10.1038/nature23880 doi: 10.1038/nature23880
|
| [16] |
J. Moser, I. Miller, D. Carter, S. L. Spencer, Control of the restriction point by Rb and p21, Proc. Natl. Acad. Sci. USA, 115 (2018), E8219–E8227. https://doi.org/10.1073/pnas.1722446115 doi: 10.1073/pnas.1722446115
|
| [17] |
M. Chung, C. Liu, H. W. Yang, M. S. Kö berlin, S. D. Cappell, T. Meyer, Transient hysteresis in CDK4/6 activity underlies passage of the restriction point in G1, Mol. Cell, 76 (2019), 562–573.e564. https://doi.org/10.1016/j.molcel.2019.08.020 doi: 10.1016/j.molcel.2019.08.020
|
| [18] |
S. Hume, G. L. Dianov, K. Ramadan, A unified model for the G1/S cell cycle transition, Nucleic Acids Res., 48 (2020), 12483–12501. https://doi.org/10.1093/nar/gkaa1002 doi: 10.1093/nar/gkaa1002
|
| [19] |
T. Blasi, H. Hennig, H. D. Summers, F. J. Theis, J. Cerveira, J. O. Patterson, et al., Label-free cell cycle analysis for high-throughput imaging flow cytometry, Nat Commun., 7 (2016), 10256. https://doi.org/10.1038/ncomms10256 doi: 10.1038/ncomms10256
|
| [20] |
E. Moen, D. Bannon, T. Kudo, W. Graf, M. Covert, D. Van Valen, Deep learning for cellular image analysis, Nat. Methods, 16 (2019), 1233–1246. https://doi.org/10.1038/s41592-019-0403-1 doi: 10.1038/s41592-019-0403-1
|
| [21] |
C. Liu, P. Cui, T. Huang, Identification of cell cycle-regulated genes by convolutional neural network, Comb. Chem. High Throughput Screen., 20 (2017), 603–611. https://doi.org/10.2174/1386207320666170417144937 doi: 10.2174/1386207320666170417144937
|
| [22] |
F. Huang, L. Chen, W. Guo, T. Huang, Y. D. Cai, Identification of human cell cycle phase markers based on single-cell RNA-seq data by using machine learning methods, Biomed Res Int., 2022 (2022), 2516653. https://doi.org/10.1155/2022/2516653 doi: 10.1155/2022/2516653
|
| [23] |
T. Huang, L. Liu, Z. Qian, K. Tu, Y. Li, L. Xie, Using GeneReg to construct time delay gene regulatory networks, BMC Res. Notes, 3 (2010), 142. https://doi.org/10.1186/1756-0500-3-142 doi: 10.1186/1756-0500-3-142
|
| [24] |
W. Liu, Y. Jiang, L. Peng, X. Sun, W. Gan, Q. Zhao, et al., Inferring gene regulatory networks using the improved markov blanket discovery algorithm, Interdiscip Sci., 14 (2022), 168–181. https://doi.org/10.1007/s12539-021-00478-9 doi: 10.1007/s12539-021-00478-9
|
| [25] |
M. M. Kordmahalleh, M. G. Sefidmazgi, S. H. Harrison, A. Homaifar, Identifying time-delayed gene regulatory networks via an evolvable hierarchical recurrent neural network, BioData Min., 10 (2017), 29. https://doi.org/10.1186/s13040-017-0146-4 doi: 10.1186/s13040-017-0146-4
|
| [26] |
B. Yang, W. Bao, D. S. Huang, Y. Chen, Inference of large-scale time-delayed gene regulatory network with parallel mapReduce cloud platform, Sci. Rep., 8 (2018), 17787. https://doi.org/10.1038/s41598-018-36180-y doi: 10.1038/s41598-018-36180-y
|
| [27] | S. Mangiola, M. A. Doyle, A. T. Papenfuss, Interfacing seurat with the R tidy universe, Bioinformatics, 2021 (2021), https://doi.org/10.1093/bioinformatics/btab404 |
| [28] |
N. Grabe, K. Neuber, Simulating psoriasis by altering transit amplifying cells, Bioinformatics, 23 (2007), 1309–1312. https://doi.org/10.1093/bioinformatics/btm042 doi: 10.1093/bioinformatics/btm042
|
| [29] | H. Zhang, W. Hou, L. Henrot, S. Schnebert, M. Dumas, C. Heusèle, et al., Modelling epidermis homoeostasis and psoriasis pathogenesis, J. R. Soc. Interface., 12 (2015), https://doi.org/10.1098/rsif.2014.1071 |
| [30] |
K. Ohno, Y. Kobayashi, M. Uesaka, T. Gotoda, M. Denda, H. Kosumi, et al., A computational model of the epidermis with the deformable dermis and its application to skin diseases, Sci. Rep., 11 (2021), 13234. https://doi.org/10.1038/s41598-021-92540-1 doi: 10.1038/s41598-021-92540-1
|
| [31] |
L. Salmena, L. Poliseno, Y. Tay, L. Kats, P. P. Pandolfi, A ceRNA hypothesis: the Rosetta Stone of a hidden RNA language?, Cell, 146 (2011), 353–358. https://doi.org/10.1016/j.cell.2011.07.014 doi: 10.1016/j.cell.2011.07.014
|
| [32] |
P. Sumazin, X. Yang, H. S. Chiu, W. J. Chung, A. Iyer, D. Llobet-Navas, et al., An extensive microRNA-mediated network of RNA-RNA interactions regulates established oncogenic pathways in glioblastoma, Cell, 147 (2011), 370–381. https://doi.org/10.1016/j.cell.2011.09.041 doi: 10.1016/j.cell.2011.09.041
|
| [33] |
D. S. Sardina, S. Alaimo, A. Ferro, A. Pulvirenti, R. Giugno, A novel computational method for inferring competing endogenous interactions, Brief. Bioinf., 18 (2017), 1071–1081. https://doi.org/10.1093/bib/bbw084 doi: 10.1093/bib/bbw084
|
| [34] |
M. List, A. Dehghani Amirabad, D. Kostka, M. H. Schulz, Large-scale inference of competing endogenous RNA networks with sparse partial correlation, Bioinformatics, 35 (2019), i596–i604. https://doi.org/10.1093/bioinformatics/btz314 doi: 10.1093/bioinformatics/btz314
|
| [35] |
L. Zhang, P. Yang, H. Feng, Q. Zhao, H. Liu, Using network distance analysis to predict lncRNA-miRNA interactions, Interdiscip. Sci., 13 (2021), 535–545. https://doi.org/10.1007/s12539-021-00458-z doi: 10.1007/s12539-021-00458-z
|
| [36] |
L. Zhang, T. Liu, H. Chen, Q. Zhao, H. Liu, Predicting lncRNA-miRNA interactions based on interactome network and graphlet interaction, Genomics, 113 (2021), 874–880. https://doi.org/10.1016/j.ygeno.2021.02.002 doi: 10.1016/j.ygeno.2021.02.002
|
| [37] | W. Liu, H. Lin, L. Huang, L. Peng, T. Tang, Q. Zhao, et al., Identification of miRNA-disease associations via deep forest ensemble learning based on autoencoder, Brief. Bioinf., 23 (2022), https://doi.org/10.1093/bib/bbac104 |
| [38] | C. C. Wang, C. D. Han, Q. Zhao, X. Chen, Circular RNAs and complex diseases: from experimental results to computational models, Brief. Bioinf., 22 (2021), https://doi.org/10.1093/bib/bbab286 |
| [39] | F. Sun, J. Sun, Q. Zhao, A deep learning method for predicting metabolite-disease associations via graph neural network, Brief. Bioinf., 23 (2022), https://doi.org/10.1093/bib/bbac266 |
| [40] |
Q. Zhou, Q. Yu, Y. Gong, Z. Liu, H. Xu, Y. Wang, et al., Construction of a lncRNA-miRNA-mRNA network to determine the regulatory roles of lncRNAs in psoriasis, Exp. Ther. Med., 18 (2019), 4011–4021. https://doi.org/10.3892/etm.2019.8035 doi: 10.3892/etm.2019.8035
|
| [41] |
Z. Yu, Y. Gong, L. Cui, Y. Hu, Q. Zhou, Z. Chen, et al., High-throughput transcriptome and pathogenesis analysis of clinical psoriasis, J. Dermatol. Sci., 98 (2020), 109–118. https://doi.org/10.1016/j.jdermsci.2020.03.006 doi: 10.1016/j.jdermsci.2020.03.006
|
| [42] |
J. Lin, X. Li, F. Zhang, L. Zhu, Y. Chen, Transcriptome wide analysis of long non-coding RNA-associated ceRNA regulatory circuits in psoriasis, J. Cell. Mol. Med., 25 (2021), 6925–6935. https://doi.org/10.1111/jcmm.16703 doi: 10.1111/jcmm.16703
|
| [43] |
Y. Wang, J. Zhu, J. Xu, J. Du, X. Lu, The long non-coding RNA and mRNA expression profiles in keratinocytes from patients with psoriasis vulgaris, Ann Palliat Med., 10 (2021), 9206–9214. https://doi.org/10.21037/apm-21-2046 doi: 10.21037/apm-21-2046
|
| [44] |
Y. Yang, S. Xie, W. Jiang, S. Tang, Y. Shi, Discovering novel biomarkers associated with the pathogenesis of psoriasis: Evidence from bioinformatic analysis, Int. J. Gen. Med., 15 (2022), 2817–2833. https://doi.org/10.2147/ijgm.S354985 doi: 10.2147/ijgm.S354985
|
| [45] |
J. Deng, C. Schieler, J. A. M. Borghans, C. Lu, A. Pandit, Finding gene regulatory networks in psoriasis: Application of a tree-based machine learning approach, Front. Immunol., 13 (2022), 921408. https://doi.org/10.3389/fimmu.2022.921408 doi: 10.3389/fimmu.2022.921408
|
| [46] |
L. Sereni, M. C. Castiello, D. Di Silvestre, P. Della Valle, C. Brombin, F. Ferrua, et al., Lentiviral gene therapy corrects platelet phenotype and function in patients with Wiskott-Aldrich syndrome, J. Allergy Clin. Immunol., 144 (2019), 825–838. https://doi.org/10.1016/j.jaci.2019.03.012 doi: 10.1016/j.jaci.2019.03.012
|
| [47] |
A. Farini, C. Villa, D. Di Silvestre, P. Bella, L. Tripodi, R. Rossi, et al., PTX3 predicts myocardial damage and fibrosis in duchenne muscular dystrophy, Front. Physiol., 11 (2020), 403. https://doi.org/10.3389/fphys.2020.00403 doi: 10.3389/fphys.2020.00403
|
| [48] |
Y. Li, T. Jiang, W. Zhou, J. Li, X. Li, Q. Wang, et al., Pan-cancer characterization of immune-related lncRNAs identifies potential oncogenic biomarkers, Nat. Commun., 11 (2020), 1000. https://doi.org/10.1038/s41467-020-14802-2 doi: 10.1038/s41467-020-14802-2
|
| [49] |
S. Wang, S. Zhou, H. Liu, Q. Meng, X. Ma, H. Liu, et al., NcRI: a manually curated database for experimentally validated non-coding RNAs in inflammation, BMC Genomics, 21 (2020), 380. https://doi.org/10.1186/s12864-020-06794-6 doi: 10.1186/s12864-020-06794-6
|
| [50] |
C. Zhou, A. Lin, M. Cao, W. Ding, W. Mou, N. Guo, et al., Activation of the DDR pathway leads to the down-regulation of the TGFβ pathway and a better response to ICIs in patients with metastatic urothelial carcinoma, Front. Immunol., 12 (2021), 634741. https://doi.org/10.3389/fimmu.2021.634741 doi: 10.3389/fimmu.2021.634741
|
| [51] |
Y. He, Z. Jiang, C. Chen, X. Wang, Classification of triple-negative breast cancers based on Immunogenomic profiling, J. Exp. Clin. Cancer Res., 37 (2018), 327. https://doi.org/10.1186/s13046-018-1002-1 doi: 10.1186/s13046-018-1002-1
|
| [52] |
T. Li, J. Fu, Z. Zeng, D. Cohen, J. Li, Q. Chen, et al., TIMER2.0 for analysis of tumor-infiltrating immune cells, Nucleic Acids Res., 48 (2020), W509–W514. https://doi.org/10.1093/nar/gkaa407 doi: 10.1093/nar/gkaa407
|
| [53] |
A. Egeberg, J. P. Thyssen, G. H. Gislason, L. Skov, Skin cancer in patients with psoriasis, J. Eur. Acad. Dermatol. Venereol., 30 (2016), 1349–1353. https://doi.org/10.1111/jdv.13619 doi: 10.1111/jdv.13619
|
| [54] |
E. L. E. M. Abou, N. Nagui, D. Mahgoub, N. El-Eishi, M. Fawzy, A. El-Tawdy, et al., Expression of cyclin D1 and p16 in psoriasis before and after phototherapy, Clin. Exp. Dermatol., 35 (2010), 781–785. https://doi.org/10.1111/j.1365-2230.2009.03774.x doi: 10.1111/j.1365-2230.2009.03774.x
|
| [55] |
S. A. Kim, Y. W. Ryu, J. I. Kwon, M. S. Choe, J. W. Jung, J. W. Cho, Differential expression of cyclin D1, Ki‑67, pRb, and p53 in psoriatic skin lesions and normal skin, Mol. Med. Rep., 17 (2018), 735–742. https://doi.org/10.3892/mmr.2017.8015 doi: 10.3892/mmr.2017.8015
|
| [56] |
S. Choudhary, R. Anand, D. Pradhan, B. Bastia, S. N. Kumar, H. Singh, et al., Transcriptomic landscaping of core genes and pathways of mild and severe psoriasis vulgaris, Int. J. Mol. Med., 47 (2021), 219–231. https://doi.org/10.3892/ijmm.2020.4771 doi: 10.3892/ijmm.2020.4771
|
| [57] |
M. Manczinger, L. Kemény, Novel factors in the pathogenesis of psoriasis and potential drug candidates are found with systems biology approach, PLoS One, 8 (2013), e80751. https://doi.org/10.1371/journal.pone.0080751 doi: 10.1371/journal.pone.0080751
|
| [58] |
J. E. Gudjonsson, A. Aphale, M. Grachtchouk, J. Ding, R. P. Nair, T. Wang, et al., Lack of evidence for activation of the hedgehog pathway in psoriasis, J. Invest. Dermatol., 129 (2009), 635–640. https://doi.org/10.1038/jid.2008.266 doi: 10.1038/jid.2008.266
|
| [59] |
N. Cloonan, M. K. Brown, A. L. Steptoe, S. Wani, W. L. Chan, A. R. Forrest, et al., The miR-17-5p microRNA is a key regulator of the G1/S phase cell cycle transition, Genome Biol., 9 (2008), R127. https://doi.org/10.1186/gb-2008-9-8-r127 doi: 10.1186/gb-2008-9-8-r127
|
| [60] |
S. S. Wallace, Base excision repair: A critical player in many games, DNA Repair (Amst), 19 (2014), 14–26. https://doi.org/10.1016/j.dnarep.2014.03.030 doi: 10.1016/j.dnarep.2014.03.030
|
| [61] |
C. Liu, J. Zhao, W. Lu, Y. Dai, J. Hockings, Y. Zhou, et al., Individualized genetic network analysis reveals new therapeutic vulnerabilities in 6,700 cancer genomes, PLoS Comput. Biol., 16 (2020), e1007701. https://doi.org/10.1371/journal.pcbi.1007701 doi: 10.1371/journal.pcbi.1007701
|
| [62] |
T. Sconocchia, M. Hochgerner, E. Schwarzenberger, C. Tam-Amersdorfer, I. Borek, T. Benezeder, et al., Bone morphogenetic protein signaling regulates skin inflammation via modulating dendritic cell function, J. Allergy Clin. Immunol., 147 (2021), 1810–1822. https://doi.org/10.1016/j.jaci.2020.09.038 doi: 10.1016/j.jaci.2020.09.038
|
| [63] |
A. G. A. Farag, M. A. Shoaib, R. M. Samaka, A. G. Abdou, M. M. Mandour, R. A. L. Ibrahim, Progranulin and beta-catenin in psoriasis: An immunohistochemical study, J. Cosmet. Dermatol., 18 (2019), 2019–2026. https://doi.org/10.1111/jocd.12966 doi: 10.1111/jocd.12966
|
| [64] | Z. Yu, Q. Yu, H. Xu, X. Dai, Y. Yu, L. Cui, et al., IL-17A Promotes psoriasis-associated keratinocyte proliferation through ACT1-dependent activation of YAP-AREG axis, J. Invest. Dermatol., (2022), https://doi.org/10.1016/j.jid.2022.02.016 |
| [65] |
G. Han, C. A. Williams, K. Salter, P. J. Garl, A. G. Li, X. J. Wang, A role for TGFbeta signaling in the pathogenesis of psoriasis, J. Invest. Dermatol., 130 (2010), 371–377. https://doi.org/10.1038/jid.2009.252 doi: 10.1038/jid.2009.252
|
| [66] |
R. N. Wang, J. Green, Z. Wang, Y. Deng, M. Qiao, M. Peabody, et al., Bone Morphogenetic Protein (BMP) signaling in development and human diseases, Genes Dis., 1 (2014), 87–105. https://doi.org/10.1016/j.gendis.2014.07.005 doi: 10.1016/j.gendis.2014.07.005
|
| [67] |
R. Hä sler, G. Jacobs, A. Till, N. Grabe, C. Cordes, S. Nikolaus, et al., Microbial pattern recognition causes distinct functional micro-RNA signatures in primary human monocytes, PLoS One, 7 (2012), e31151. https://doi.org/10.1371/journal.pone.0031151 doi: 10.1371/journal.pone.0031151
|
| [68] |
V. Patel, K. Carrion, A. Hollands, A. Hinton, T. Gallegos, J. Dyo, et al., The stretch responsive microRNA miR-148a-3p is a novel repressor of IKBKB, NF-κB signaling, and inflammatory gene expression in human aortic valve cells, FASEB J., 29 (2015), 1859–1868. https://doi.org/10.1096/fj.14-257808 doi: 10.1096/fj.14-257808
|
| [69] |
T. M. Dang, W. C. Wong, S. M. Ong, P. Li, J. Lum, J. Chen, et al., MicroRNA expression profiling of human blood monocyte subsets highlights functional differences, Immunology, 145 (2015), 404-416. https://doi.org/10.1111/imm.12456 doi: 10.1111/imm.12456
|
| [70] |
L. Borska, J. Kremlacek, C. Andrys, J. Krejsek, K. Hamakova, P. Borsky, et al., Systemic Inflammation, Oxidative Damage to Nucleic Acids, and Metabolic Syndrome in the Pathogenesis of Psoriasis, Int. J. Mol. Sci., 18 (2017), https://doi.org/10.3390/ijms18112238 doi: 10.3390/ijms18112238
|
| [71] |
S. C. Weatherhead, P. M. Farr, N. J. Reynolds, Spectral effects of UV on psoriasis, Photochem Photobiol Sci., 12 (2013), 47–53. https://doi.org/10.1039/c2pp25116g doi: 10.1039/c2pp25116g
|
| [72] | T. M. Ansary, M. R. Hossain, K. Kamiya, M. Komine, M. Ohtsuki, Inflammatory molecules associated with ultraviolet radiation-mediated skin aging, Int. J. Mol. Sci., 22 (2021), https://doi.org/10.3390/ijms22083974 |
| [73] |
J. Despotovic, S. Dragicevic, A. Nikolic, Effects of chemotherapy for metastatic colorectal cancer on the TGF-β signaling and related miRNAs hsa-miR-17-5p, hsa-miR-21-5p and hsa-miR-93-5p, Cell Biochem. Biophys., 79 (2021), 757–767. https://doi.org/10.1007/s12013-021-00980-3 doi: 10.1007/s12013-021-00980-3
|
| [74] | B. Polini, S. Carpi, S. Doccini, V. Citi, A. Martelli, S. Feola, et al., Tumor suppressor role of hsa-miR-193a-3p and -5p in cutaneous melanoma, Int. J. Mol. Sci., 21 (2020), https://doi.org/10.3390/ijms21176183 |
| [75] |
S. Jirawatnotai, Y. Hu, D. M. Livingston, P. Sicinski, Proteomic identification of a direct role for cyclin d1 in DNA damage repair, Cancer Res., 72 (2012), 4289–4293. https://doi.org/10.1158/0008-5472.Can-11-3549 doi: 10.1158/0008-5472.Can-11-3549
|
| [76] |
R. Huang, P. K. Zhou, DNA damage repair: historical perspectives, mechanistic pathways and clinical translation for targeted cancer therapy, Signal Transduct Target Ther., 6 (2021), 254. https://doi.org/10.1038/s41392-021-00648-7 doi: 10.1038/s41392-021-00648-7
|
| [77] |
A. Gandarillas, R. Molinuevo, N. Sanz-Gómez, Mammalian endoreplication emerges to reveal a potential developmental timer, Cell Death Differ., 25 (2018), 471–476. https://doi.org/10.1038/s41418-017-0040-0 doi: 10.1038/s41418-017-0040-0
|
| [78] |
R. Molinuevo, A. Freije, I. de Pedro, S. W. Stoll, J. T. Elder, A. Gandarillas, FOXM1 allows human keratinocytes to bypass the oncogene-induced differentiation checkpoint in response to gain of MYC or loss of p53, Oncogene, 36 (2017), 956–965. https://doi.org/10.1038/onc.2016.262 doi: 10.1038/onc.2016.262
|
| [79] |
N. D. Loft, S. Vaengebjerg, L. Skov, Cancer risk in patients with psoriasis: should we be paying more attention?, Expert Rev. Clin. Immunol., 16 (2020), 479–492. https://doi.org/10.1080/1744666x.2020.1754194 doi: 10.1080/1744666x.2020.1754194
|
| [80] |
S. Esse, K. J. Mason, A. C. Green, R. B. Warren, Melanoma risk in patients treated with biologic therapy for common inflammatory diseases: A systematic review and meta-analysis, JAMA Dermatol., 156 (2020), 787–794. https://doi.org/10.1001/jamadermatol.2020.1300 doi: 10.1001/jamadermatol.2020.1300
|
| [81] |
Z. Chen, N. Zhang, H. Y. Chu, Y. Yu, Z. K. Zhang, G. Zhang, et al., Connective tissue growth factor: From molecular understandings to drug discovery, Front. Cell Dev. Biol., 8 (2020), 593269. https://doi.org/10.3389/fcell.2020.593269 doi: 10.3389/fcell.2020.593269
|
| [82] |
K. Hayakawa, K. Ikeda, M. Fujishiro, Y. Yoshida, T. Hirai, H. Tsushima, et al., Connective tissue growth factor neutralization aggravates the psoriasis skin lesion: The analysis of psoriasis model mice and patients, Ann. Dermatol., 30 (2018), 47–53. https://doi.org/10.5021/ad.2018.30.1.47 doi: 10.5021/ad.2018.30.1.47
|
| [83] |
N. N. Kulkarni, T. Takahashi, J. A. Sanford, Y. Tong, A. F. Gombart, B. Hinds, et al., Innate immune dysfunction in rosacea promotes photosensitivity and vascular adhesion molecule expression, J. Invest. Dermatol., 140 (2020), 645–655. https://doi.org/10.1016/j.jid.2019.08.436 doi: 10.1016/j.jid.2019.08.436
|
| [84] |
S. Y. Park, J. Y. Kim, S. M. Lee, J. O. Chung, K. H. Lee, C. H. Jun, et al., Expression of early growth response gene-1 in precancerous lesions of gastric cancer, Oncol. Lett., 12 (2016), 2710–2715. https://doi.org/10.3892/ol.2016.4962 doi: 10.3892/ol.2016.4962
|
| [85] |
P. L. Kuo, Y. H. Chen, T. C. Chen, K. H. Shen, Y. L. Hsu, CXCL5/ENA78 increased cell migration and epithelial-to-mesenchymal transition of hormone-independent prostate cancer by early growth response-1/snail signaling pathway, J. Cell. Physiol., 226 (2011), 1224–1231. https://doi.org/10.1002/jcp.22445 doi: 10.1002/jcp.22445
|
| [86] |
A. Krones-Herzig, E. Adamson, D. Mercola, Early growth response 1 protein, an upstream gatekeeper of the p53 tumor suppressor, controls replicative senescence, Proc. Natl. Acad. Sci. U. S. A., 100 (2003), 3233–3238. https://doi.org/10.1073/pnas.2628034100 doi: 10.1073/pnas.2628034100
|
| [87] |
I. de Belle, R. P. Huang, Y. Fan, C. Liu, D. Mercola, E. D. Adamson, p53 and Egr-1 additively suppress transformed growth in HT1080 cells but Egr-1 counteracts p53-dependent apoptosis, Oncogene, 18 (1999), 3633–3642. https://doi.org/10.1038/sj.onc.1202696 doi: 10.1038/sj.onc.1202696
|
| [88] |
W. Soonthornchai, P. Tangtanatakul, K. Meesilpavikkai, V. Dalm, P. Kueanjinda, J. Wongpiyabovorn, MicroRNA-378a-3p is overexpressed in psoriasis and modulates cell cycle arrest in keratinocytes via targeting BMP2 gene, Sci. Rep., 11 (2021), 14186. https://doi.org/10.1038/s41598-021-93616-8 doi: 10.1038/s41598-021-93616-8
|
| [89] |
W. Yao, Z. Pan, X. Du, J. Zhang, Q. Li, miR-181b-induced SMAD7 downregulation controls granulosa cell apoptosis through TGF-β signaling by interacting with the TGFBR1 promoter, J. Cell. Physiol., 233 (2018), 6807–6821. https://doi.org/10.1002/jcp.26431 doi: 10.1002/jcp.26431
|
| [90] |
C. Fan, C. Tu, P. Qi, C. Guo, B. Xiang, M. Zhou, et al., GPC6 Promotes Cell Proliferation, Migration, and Invasion in Nasopharyngeal Carcinoma, J. Cancer, 10 (2019), 3926–3932. https://doi.org/10.7150/jca.31345 doi: 10.7150/jca.31345
|
| [91] |
Y. Li, M. Li, I. Shats, J. M. Krahn, G. P. Flake, D. M. Umbach, et al., Glypican 6 is a putative biomarker for metastatic progression of cutaneous melanoma, PLoS One, 14 (2019), e0218067. https://doi.org/10.1371/journal.pone.0218067 doi: 10.1371/journal.pone.0218067
|
| [92] |
O. Noguer, J. Villena, J. Lorita, S. Vilaró, M. Reina, Syndecan-2 downregulation impairs angiogenesis in human microvascular endothelial cells, Exp. Cell Res., 315 (2009), 795–808. https://doi.org/10.1016/j.yexcr.2008.11.016 doi: 10.1016/j.yexcr.2008.11.016
|
| [93] |
H. Liu, W. Lin, Z. Liu, Y. Song, H. Cheng, H. An, et al., E3 ubiquitin ligase NEDD4L negatively regulates keratinocyte hyperplasia by promoting GP130 degradation, EMBO Rep., 22 (2021), e52063. https://doi.org/10.15252/embr.202052063 doi: 10.15252/embr.202052063
|
| [94] |
J. Li, Z. Yue, W. Xiong, P. Sun, K. You, J. Wang, TXNIP overexpression suppresses proliferation and induces apoptosis in SMMC7221 cells through ROS generation and MAPK pathway activation, Oncol. Rep., 37 (2017), 3369–3376. https://doi.org/10.3892/or.2017.5577 doi: 10.3892/or.2017.5577
|
| [95] |
P. F. Hsiao, Y. T. Huang, P. H. Lu, L. Y. Chiu, T. H. Weng, C. F. Hung, et al., Thioredoxin-interacting protein regulates keratinocyte differentiation: Implication of its role in psoriasis, FASEB J., 36 (2022), e22313. https://doi.org/10.1096/fj.202101772R doi: 10.1096/fj.202101772R
|
| [96] |
T. J. Kao, C. C. Wu, N. N. Phan, Y. H. Liu, H. D. K. Ta, G. Anuraga, et al., Prognoses and genomic analyses of proteasome 26S subunit, ATPase (PSMC) family genes in clinical breast cancer, Aging, 13 (2021), 17970. https://doi.org/10.18632/aging.203345 doi: 10.18632/aging.203345
|
| [97] |
J. M. A. Delou, G. M. Vignal, V. Í ndio-do-Brasil, M. T. S. Accioly, T. S. L. da Silva, D. N. Piranda, et al., Loss of constitutive ABCB1 expression in breast cancer associated with worse prognosis, Breast Cancer, 9 (2017), 415–428. https://doi.org/10.2147/bctt.S131284 doi: 10.2147/bctt.S131284
|
| [98] |
S. Wu, H. He, J. Huang, S. Jiang, X. Deng, J. Huang, et al., FMR1 is identified as an immune-related novel prognostic biomarker for renal clear cell carcinoma: A bioinformatics analysis of TAZ/YAP, Math. Biosci. Eng., 19 (2022), 9295–9320. https://doi.org/10.3934/mbe.2022432 doi: 10.3934/mbe.2022432
|
| [99] |
S. Pushpakom, F. Iorio, P. A. Eyers, K. J. Escott, S. Hopper, A. Wells, et al., Drug repurposing: progress, challenges and recommendations, Nat. Rev. Drug Discov., 18 (2019), 41–58. https://doi.org/10.1038/nrd.2018.168 doi: 10.1038/nrd.2018.168
|
| [100] |
Y. Zhou, F. Wang, J. Tang, R. Nussinov, F. Cheng, Artificial intelligence in COVID-19 drug repurposing, Lancet Digit Health., 2 (2020), e667–e676. https://doi.org/10.1016/s2589-7500(20)30192-8 doi: 10.1016/s2589-7500(20)30192-8
|
| [101] | C. Y. Wang, C. C. Chiao, N. N. Phan, C. Y. Li, Z. D. Sun, J. Z. Jiang, et al., Gene signatures and potential therapeutic targets of amino acid metabolism in estrogen receptor-positive breast cancer, Am. J. Cancer Res., 10 (2020), 95–113. |
| [102] |
M. C. Ovejero-Benito, E. Muñ oz-Aceituno, A. Reolid, M. Saiz-Rodríguez, F. Abad-Santos, E. Daudén, Pharmacogenetics and pharmacogenomics in moderate-to-severe psoriasis, Am. J. Clin. Dermatol., 19 (2018), 209–222. https://doi.org/10.1007/s40257-017-0322-9 doi: 10.1007/s40257-017-0322-9
|
| [103] |
H. Jain, A. R. Bhat, H. Dalvi, C. Godugu, S. B. Singh, S. Srivastava, Repurposing approved therapeutics for new indication: Addressing unmet needs in psoriasis treatment, Curr. Res. Pharmacol. Drug Discov., 2 (2021), 100041. https://doi.org/10.1016/j.crphar.2021.100041 doi: 10.1016/j.crphar.2021.100041
|
| [104] | A. von Knethen, U. Heinicke, A. Weigert, K. Zacharowski, B. Brüne, Histone deacetylation inhibitors as modulators of regulatory T cells, Int. J. Mol. Sci., 21 (2020), https://doi.org/10.3390/ijms21072356 |
| [105] |
F. McLaughlin, N. B. La Thangue, Histone deacetylase inhibitors in psoriasis therapy, Curr. Drug Targets Inflamm. Allergy, 3 (2004), 213–219. https://doi.org/10.2174/1568010043343859 doi: 10.2174/1568010043343859
|
| [106] |
E. E. Hull, M. R. Montgomery, K. J. Leyva, HDAC inhibitors as epigenetic regulators of the immune system: Impacts on cancer therapy and inflammatory diseases, Biomed. Res. Int., 2016 (2016), 8797206. https://doi.org/10.1155/2016/8797206 doi: 10.1155/2016/8797206
|
| [107] |
K. Ververis, A. Hiong, T. C. Karagiannis, P. V. Licciardi, Histone deacetylase inhibitors (HDACIs): multitargeted anticancer agents, Biologics, 7 (2013), 47–60. https://doi.org/10.2147/btt.S29965 doi: 10.2147/btt.S29965
|
| [108] |
Y. L. Chung, M. Y. Lee, A. J. Wang, L. F. Yao, A therapeutic strategy uses histone deacetylase inhibitors to modulate the expression of genes involved in the pathogenesis of rheumatoid arthritis, Mol. Ther., 8 (2003), 707–717. https://doi.org/10.1016/s1525-0016(03)00235-1 doi: 10.1016/s1525-0016(03)00235-1
|
| [109] |
N. Mishra, C. M. Reilly, D. R. Brown, P. Ruiz, G. S. Gilkeson, Histone deacetylase inhibitors modulate renal disease in the MRL-lpr/lpr mouse, J. Clin. Invest., 111 (2003), 539–552. https://doi.org/10.1172/jci16153 doi: 10.1172/jci16153
|
| [110] |
M. D. Cantley, D. P. Fairlie, P. M. Bartold, V. Marino, P. K. Gupta, D. R. Haynes, Inhibiting histone deacetylase 1 suppresses both inflammation and bone loss in arthritis, Rheumatology, 54 (2015), 1713–1723. https://doi.org/10.1093/rheumatology/kev022 doi: 10.1093/rheumatology/kev022
|
| [111] | Y. J. Hwang, J. I. Na, S. Y. Byun, S. H. Kwon, S. H. Yang, H. S. Lee, et al., Histone deacetylase 1 and sirtuin 1 expression in psoriatic skin: A comparison between guttate and plaque psoriasis, Life, 10 (2020), https://doi.org/10.3390/life10090157 |
 mbe-19-12-630 supplementary.zip mbe-19-12-630 supplementary.zip |
 |


Figures(21) / Tables(6)

Jingxi Xu, Jiangtao Li. Construction of a three commitment points for S phase entry cell cycle model and immune-related ceRNA network to explore novel therapeutic options for psoriasis[J]. Mathematical Biosciences and Engineering, 2022, 19(12): 13483-13525. doi: 10.3934/mbe.2022630


 DownLoad: