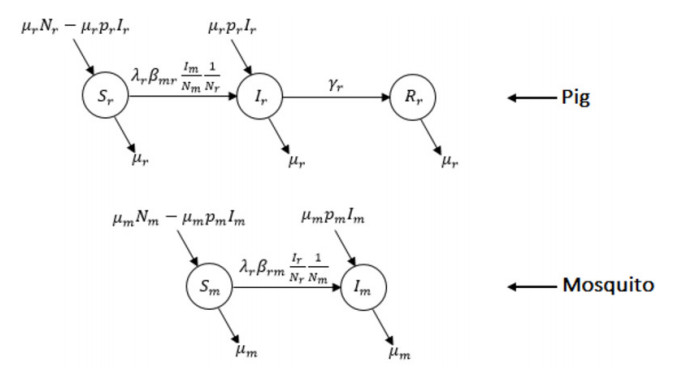
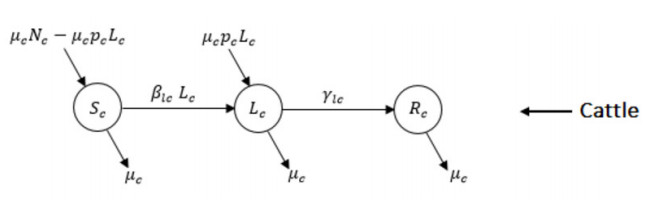
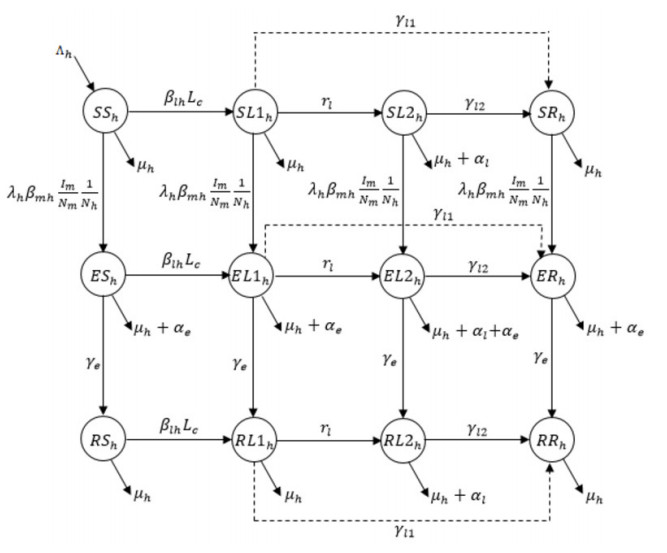
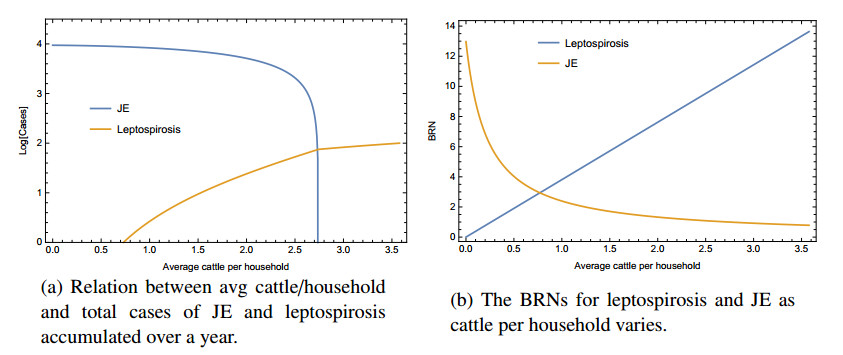
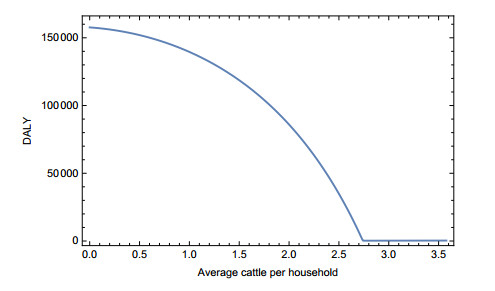
Japanese encephalitis (JE) is a mosquito-borne neglected tropical disease. JE is mostly found in rural areas where people usually keep cattle at home for their needs. Cattle in households reduce JE virus infections since they distract vectors and act as a dead-end host for the virus. However, the presence of cattle introduces risk of leptospirosis infections in humans. Leptospirosis is a bacterial disease that spreads through direct or indirect contact of urine of the infected cattle. Thus, cattle have both positive and negative impacts on human disease burden. This study uses a mathematical model to study the joint dynamics of these two diseases in the presence of cattle and to identify the net impact of cattle on the annual disease burden in JE-prevalent areas. Analysis indicates that the presence of cattle helps to reduce the overall disease burden in JE-prevalent areas. However, this reduction is dominated by the vector's feeding pattern. To the best of our knowledge, this is the first study to examine the joint dynamics of JE and leptospirosis.
Citation: Mondal Hasan Zahid, Christopher M. Kribs. Impact of cattle on joint dynamics and disease burden of Japanese encephalitis and leptospirosis[J]. Mathematical Biosciences and Engineering, 2021, 18(4): 3046-3072. doi: 10.3934/mbe.2021153
Japanese encephalitis (JE) is a mosquito-borne neglected tropical disease. JE is mostly found in rural areas where people usually keep cattle at home for their needs. Cattle in households reduce JE virus infections since they distract vectors and act as a dead-end host for the virus. However, the presence of cattle introduces risk of leptospirosis infections in humans. Leptospirosis is a bacterial disease that spreads through direct or indirect contact of urine of the infected cattle. Thus, cattle have both positive and negative impacts on human disease burden. This study uses a mathematical model to study the joint dynamics of these two diseases in the presence of cattle and to identify the net impact of cattle on the annual disease burden in JE-prevalent areas. Analysis indicates that the presence of cattle helps to reduce the overall disease burden in JE-prevalent areas. However, this reduction is dominated by the vector's feeding pattern. To the best of our knowledge, this is the first study to examine the joint dynamics of JE and leptospirosis.

| [1] | World Health Organization, Japanese encephalitis, 2019. Available from: https://www.who.int/news-room/fact-sheets/detail/japanese-encephalitis. |
| [2] | Centers for Disease Control and Prevention, Japanese encephalitis, 2019. Available from: https://www.cdc.gov/japaneseencephalitis/index.html. |
| [3] | World Health Organization, Japanese encephalitis, 2015. Available from: https://www.who.int/immunization/diseases/japanese_encephalitis/en/. |
| [4] | Centers for Disease Control and Prevention, Japanese encephalitis transmission, 2019. Available from: https://www.cdc.gov/japaneseencephalitis/transmission/index.html. |
| [5] | Centers for Disease Control and Prevention, Leptospirosis and healthcare workers, 2020. Available from: https://www.cdc.gov/leptospirosis/health_care_workers/index.html. |
| [6] | Centers for Disease Control and Prevention, Leptospirosis, 2019. Available from: https://www.cdc.gov/leptospirosis/index.html. |
| [7] | Centers for Disease Control and Prevention, Leptospirosis infection, 2015. Available from: https://www.cdc.gov/leptospirosis/infection/index.html. |
| [8] | Centers for Disease Control and Prevention, Leptospirosis symptoms, 2017. Available from: https://www.cdc.gov/leptospirosis/symptoms/index.html. |
| [9] | H. S. Ginsberg, Integrated pest management and allocation of control efforts for vector-borne diseases, J. Vector Ecol., 26 (2001), 32–38. |
| [10] |
S. U. Khan, H. Salje, A. Hannan, M. A. Islam1, A. A. Mamun Bhuyan, M. A. Islam1, et al., Dynamics of Japanese encephalitis virus transmission among pigs in Northwest Bangladesh and the potential impact of pig vaccination, PLoS Neglected Trop. Dis., 8 (2014), e3166. doi: 10.1371/journal.pntd.0003166

|
| [11] |
J. S. Lord, E. S. Gurley, J. R. C. Pulliam, Rethinking Japanese encephalitis virus transmission: a framework for implicating host and vector species, PLoS Neglected Trop. Dis., 9 (2015), e0004074. doi: 10.1371/journal.pntd.0004074
|
| [12] |
S. Chadsuthi, D. J. Bicout, A. Wiratsudakul, D. Suwancharoen, W. Petkanchanapong, C. Modchang, et al., Investigation on predominant Leptospira serovars and its distribution in humans and livestock in Thailand, 2010-2015, PLoS Neglected Trop. Dis., 11 (2017), e0005228. doi: 10.1371/journal.pntd.0005228
|
| [13] |
A. M. Babylon, M. G. Roberts, G. C. Wake, Modelling leptospirosis in livestock, Theoritical Popul. Biol., 121 (2018), 26–32. doi: 10.1016/j.tpb.2018.03.005
|
| [14] |
P. T. J. Johnson, D. W. Thieltges, Diversity, decoys and the dilution effect: how ecological communities affect disease risk, J. Exp. Biol., 213 (2010), 961–970. doi: 10.1242/jeb.037721
|
| [15] |
E. Miller, A. Huppert, The effects of host diversity on vector-borne disease: the conditions under which diversity will amplify or dilute the disease risk, PLOS One, 8 (2013), e80279. doi: 10.1371/journal.pone.0080279
|
| [16] | E. Miller, A. Huppert, Correction: The effects of host diversity on vector-borne disease: the conditions under which diversity will amplify or dilute the disease risk, PLOS One, 9 (2014), 1–10. |
| [17] | M. H. Zahid, C. M. Kribs, Impact of dogs with deltamethrin-impregnated collars on prevalence of visceral leishmaniasis, Infect. Dis. Model., 5 (2020), 235–247. |
| [18] |
M. H. Zahid, C. M. Kribs, Decoys and dilution: the impact of incompetent hosts on prevalence of Chagas disease, Bull. Math. Biol., 82 (2020), 1–17. doi: 10.1007/s11538-019-00680-3
|
| [19] |
G. F. Killeen, T. A. Smith, Exploring the contributions of bed nets, cattle, insecticides and excitorepellency to malaria control: a deterministic model of mosquito host-seeking behaviour and mortality, Trans. R. Soc. Trop. Med. Hyg., 101 (2007), 867–880. doi: 10.1016/j.trstmh.2007.04.022
|
| [20] |
M. A. Ilkal, V. Dhanda, B. U. Rao, S. George, A. C. Mishra, Y. Prasanna, et al., Absence of viraemia in cattle after experimental infection with Japanese encephalitis virus, Trans. R. Soc. Trop. Med. Hyg., 82 (1988), 628–631. doi: 10.1016/0035-9203(88)90536-6
|
| [21] |
S. Thankachy, S. Dash, S. S. Sahu, Entomological factors in relation to the occurrence of Japanese encephalitis in Malkangiri district, Odisha State, India, Pathog. Global Health, 113 (2019), 246–253. doi: 10.1080/20477724.2019.1670926
|
| [22] |
S. Ghosh, Anirban Basu, Acute encephalitis syndrome in India: the changing scenario, Ann. Neurosci., 23 (2016), 131–133. doi: 10.1159/000449177
|
| [23] |
S. A. Khan, P. Dutta, J. Borah, P. Chowdhury, R. Topno, M. Baishya, et al., Leptospirosis presenting as acute encephalitis syndrome (AES) in Assam, India, Asian Pac. J. Trop. Dis., 2 (2012), 151–153. doi: 10.1016/S2222-1808(12)60034-6
|
| [24] |
S. A. Khan, T. Bora, B. Laskar, A. M. Khan, Prafulla Dutta, Scrub typhus leading to acute encephalitis syndrome, Assam, India, Emerg. Infect. Dis., 23 (2017), 148–150. doi: 10.3201/eid2301.161038
|
| [25] | V. Balamurugan, S. Veena, S. R. A. Thirumalesh, A. Alampuri, R. Sridevi, P. P. Sengupta, et al., Distribution of serogroup specific antibodies against leptospirosis in livestock in Odisha, Indian J. Anim. Sci., 87 (2017), 546–551. |
| [26] | V. Balamurugan, S. Veena, S. R. A. Thirumalesh, A. Alampuri, R. Sridevi, P. P. Sengupta, et al., Seroprevalence of bovine leptospirosis in Odisha, India, World J. Vet. Sci., 1 (2013), 1–7. |
| [27] |
A. F. van den Hurk, S. A. Ritchie, J. S. Mackenzie, Ecology and geographical expansion of Japanese encephalitis virus, Ann. Rev. Entomol., 54 (2009), 17–35. doi: 10.1146/annurev.ento.54.110807.090510
|
| [28] |
S. C. Hathaway, Leptospirosis in New Zealand: an ecological view, New Zeal. Vet. J., 29 (1981), 109–112. doi: 10.1080/00480169.1981.34815
|
| [29] |
I. Bolt, R. B. Marshall, The epidemiology of Leptospira interrogans serovar pomona in grower pig herds, New Zeal. Vet. J., 43 (1995), 10–15. doi: 10.1080/00480169.1995.35833
|
| [30] |
F. C. Leonard, P. J. Quinn, W. A. Ellis, K. O'Farrell, Duration of urinary excretion of leptospires by cattle naturally or experimentally infected with Leptospira interrogans serovar hardjo, Vet. Rec., 131 (1992), 435–439. doi: 10.1136/vr.131.19.435
|
| [31] | A. B. Thierman, Experimental leptospiral infections in pregnant cattle with organisms of the Hebdomadis serogroup, Am. J. Vet. Res., 43 (1982), 780–784. |
| [32] | C. G. Mackintosh, R. B. Marshall, E. S. Broughton, The use of a hardjo-pomona vaccine to prevent leptospiruria in cattle exposed to natural challenge with leptospira interrogans serovar hardjo, New Zeal. Vet. J., 28 (1991), 174–177. |
| [33] | The World Bank, World Bank data, 2020. Available from: https://data.worldbank.org/indicator/SP.DYN.LE00.IN. |
| [34] | S. S. Sahu, S. Dash, T. Sonia, S. Muthukumarave, T. Sankari, K. Gunasekaran, et al., Entomological investigation of Japanese encephalitis outbreak in Malkangiri district of Odisha state, India, Mem. Inst. Oswaldo Cruz, 113 (2018), e170499. |
| [35] | The World Bank, World Bank data, 2020. Available from: https://data.worldbank.org/indicator/SP.RUR.TOTL. |
| [36] |
P. P. Samuel, N. Arunachalam, J. Hiriyan, B. K. Tyagi, Host feeding pattern of Japanese encephalitis virus vector mosquitoes (Diptera: Culicidae) from Kuttanadu, Kerala, India, J. Med. Entomol., 45 (2008), 927–932. doi: 10.1093/jmedent/45.5.927
|
| [37] |
H. L. Zhan, Y. Z. Zhang, W. H. Yang, Y. Feng, R. S. Nasci, J. Yang, et al., Mosquitoes of western Yunnan province, China: seasonal abundance, diversity, and arbovirus associations, PLOS One, 8 (2013), e77017. doi: 10.1371/journal.pone.0077017
|
| [38] |
M. H. Birley, P. K. Rajagopalan, Estimation of the survival and biting rates of Culex quinquefasciatus (Diptera: Culicidae), J. Med. Entomol., 18 (1981), 181–186. doi: 10.1093/jmedent/18.3.181
|
| [39] | P. P. Samuel, J. Hiriyan, A. Gajanana, Japanese encephalitis virus infection in mosquitoes and its epidemiological implications, ICMR Bull., 30 (2000), 37–43. |
| [40] |
D. H. Baik, C. Y. Joo, Epidemio-entomological survey of Japanese encephalitis in Korea, Kor. J. Parasit., 29 (1991), 67–85. doi: 10.3347/kjp.1991.29.1.67
|
| [41] |
B. Dwibedia, N. Mohapatraa, S. K. Rathorea, M. Pandaa, S. S. Patia, J. Sabata, et al., An outbreak of Japanese encephalitis after two decades in Odisha, India, Indian J. Med. Res., 142 (2015), 30–32. doi: 10.4103/0971-5916.176609
|
| [42] | Pets on Mom, The life span of domestic pigs}, 2020. Available from: https://animals.mom.me/life-span-domestic-pigs-7920.html. |
| [43] | S. V. Budihal, K. Perwez, Leptospirosis diagnosis: competency of various laboratory tests, J. Clin. Diagn. Res., 8 (2014), 199–202. |
| [44] | R. Holla, B. Darshan, L. Pandey, B. Unnikrishnan, N. Kumar, R. Thapar, et al., Leptospirosis in coastal south India: a facility based study, BioMed. Res. Int., 2018 (2018), 1759125. |
| [45] |
S. Biswal, D. C. Nayak, K. K. Sardar, Prevalence of ketosis in dairy cows in milk shed areas of Odisha state, India, Vet. World, 9 (2016), 1242–1247. doi: 10.14202/vetworld.2016.1242-1247
|
| [46] |
S. Lequime, R. E. Paul, L. Lambrechts, Determinants of arbovirus vertical transmission in mosquitoes, PLOS Pathog., 12 (2016), e1005548. doi: 10.1371/journal.ppat.1005548
|
| [47] |
A. B. Jena, K. C. Mohanty, N. Devadasan, An outbreak of leptospirosis in Orissa, India: the importance of surveillance, Trop. Med. Int. Health, 9 (2004), 1016–1021. doi: 10.1111/j.1365-3156.2004.01293.x
|
| [48] |
C. Kribs-Zaleta, Estimating contact process saturation in sylvatic transmission of Trypanosoma cruzi in the United States, PLOS Neglected Trop. Dis., 4 (2010), e656. doi: 10.1371/journal.pntd.0000656
|
| [49] |
D. Suwancharoen, S. Limlertvatee, P. Chetiyawan, P. Tongpan, N. Sangkaew, Y. Sawaddee, et al., A nationwide survey of pathogenic leptospires in urine of cattle and buffaloes by Loop-mediated isothermal amplification (LAMP) method in Thailand, 2011-2013, J. Vet. Med. Sci., 78 (2016), 1495–1500. doi: 10.1292/jvms.15-0493
|
| [50] | S. Hinjoy, Epidemiology of leptospirosis from Thai National Disease Surveillance System, 2003-2012, OSIR, 7 (2014), 1–5. |
| [51] | O. Diekmann, J.A.P. Heesterbeek, J.A.J. Metz, On the definition and the computation of the basic reproduction ratio $R_0$ in models for infectious diseases in heterogeneous populations, Journal of Mathematical Biology, 28 (1990), 365-382. |
| [52] | H. R. Thieme, Convergence results and a Poincaré -Bendixson trichotomy for asymptotically autonomous differential equations, J. Math. Biol., 30 (1992), 755–763. |
| [53] |
C. Mitchell, C. Kribs, Invasion reproductive numbers for periodic epidemic models, Infect. Dis. Modell., 4 (2019), 124–141. doi: 10.1016/j.idm.2019.04.002
|
| [54] |
M. H. Zahid, C. M. Kribs, Ebola: Impact of hospital's admission policy in an overwhelmed scenario, Math. Biosci. Eng., 15 (2018), 1387–1399. doi: 10.3934/mbe.2018063
|
| [55] | World Health Organization, Japanese encephalitis disease burden, 2020. Available from: https://www.who.int/healthinfo/global_burden_disease/metrics_daly/en/. |
| [56] | J. A. Salomon, J. A. Haagsma, A. Davis, C. M. de Noordhout, S. Polinder, A. H. Havelaar, et al., Disability weights for the global burden of disease 2013 study, Lancet, 3 (2015), 712–723. |
| [57] |
J. Yu, Modeling mosquito population suppression based on delay differential equations, SIAM J. App. Math., 78 (2018), 3168–3187. doi: 10.1137/18M1204917
|
| [58] |
A. M. Kilpatrick, P. Daszak, M. J. Jones, P. P. Marra, L. D Kramer, Host heterogeneity dominates West Nile virus transmission, Proc. B R. Soc., 273 (2006), 2327-2333. doi: 10.1098/rspb.2006.3575
|
| [59] |
P. T. J. Johnson, J. T. Hoverman, Heterogeneous hosts: how variation in host size, behaviour and immunity affects parasite aggregation, J. Ani. Ecol., 83 (2014), 1103–1112. doi: 10.1111/1365-2656.12215
|
Figures(5) / Tables(2)

Mondal Hasan Zahid, Christopher M. Kribs. Impact of cattle on joint dynamics and disease burden of Japanese encephalitis and leptospirosis[J]. Mathematical Biosciences and Engineering, 2021, 18(4): 3046-3072. doi: 10.3934/mbe.2021153


 DownLoad: