Education is essential and increasingly crucial for the development of almost all countries worldwide. As educational data has become increasingly available, scholars have shown a growing interest in exploring the correlation between students' academic achievements and other factors that may impact their performance using machine learning algorithms. This research paper introduces a novel hybrid classifier that aims to predict the academic performance of students by using a combination of different single algorithms. The proposed hybrid classifier (PHC) is compared to six available classification algorithms (random forest (RF), C4.5, classification and regression trees (CART), support vector machines (SVM), naive Bayes (NB) and K-nearest neighbors (KNN)) using recall, precision, F1-score, and accuracy evaluation measures. Our experimental results reveal that the PHC classifier consistently outperforms the individual classifiers across multiple evaluation metrics. Specifically, the PHC classifier achieved an accuracy rate of 92.40%, surpassing the RF, C4.5, and CART classifiers, which were the next best performers. In terms of precision and F1 score, the PHC also demonstrated superior performance, indicating its robustness in correctly identifying positive instances and providing balanced accuracy. While the C4.5 classifier performed comparably to the PHC classifier concerning the recall metric, the hybrid model's overall performance highlights its effectiveness in leveraging the complementary strengths of the included classifiers. The suggested hybrid model has the potential to enhance students' academic performance and success more effectively and efficiently. It could benefit students, educators, and academic institutions. Additionally, it provides practical insights for educators and institutions striving to improve student achievement using predictive analysis.
Citation: Abdulmajeed Atiah Alharbi, Jeza Allohibi. A new hybrid classification algorithm for predicting student performance[J]. AIMS Mathematics, 2024, 9(7): 18308-18323. doi: 10.3934/math.2024893
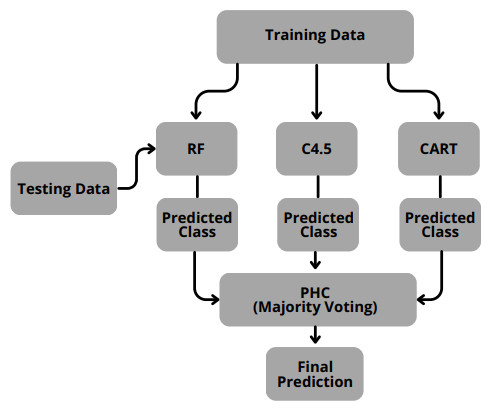
Education is essential and increasingly crucial for the development of almost all countries worldwide. As educational data has become increasingly available, scholars have shown a growing interest in exploring the correlation between students' academic achievements and other factors that may impact their performance using machine learning algorithms. This research paper introduces a novel hybrid classifier that aims to predict the academic performance of students by using a combination of different single algorithms. The proposed hybrid classifier (PHC) is compared to six available classification algorithms (random forest (RF), C4.5, classification and regression trees (CART), support vector machines (SVM), naive Bayes (NB) and K-nearest neighbors (KNN)) using recall, precision, F1-score, and accuracy evaluation measures. Our experimental results reveal that the PHC classifier consistently outperforms the individual classifiers across multiple evaluation metrics. Specifically, the PHC classifier achieved an accuracy rate of 92.40%, surpassing the RF, C4.5, and CART classifiers, which were the next best performers. In terms of precision and F1 score, the PHC also demonstrated superior performance, indicating its robustness in correctly identifying positive instances and providing balanced accuracy. While the C4.5 classifier performed comparably to the PHC classifier concerning the recall metric, the hybrid model's overall performance highlights its effectiveness in leveraging the complementary strengths of the included classifiers. The suggested hybrid model has the potential to enhance students' academic performance and success more effectively and efficiently. It could benefit students, educators, and academic institutions. Additionally, it provides practical insights for educators and institutions striving to improve student achievement using predictive analysis.

| [1] |
Y. Hong, X. Rong, W. Liu, Construction of influencing factor segmentation and intelligent prediction model of college students' cell phone addiction model based on machine learning algorithm, Heliyon, 10 (2024), e29245. https://doi.org/10.1016/j.heliyon.2024.e29245 doi: 10.1016/j.heliyon.2024.e29245

|
| [2] |
B. Chen, B. Shi, J. Gong, G. Shi, H. Jin, T. Qin, et al., Quality detection and variety classification of pecan seeds using hyperspectral imaging technology combined with machine learning, J. Food Compos. Anal., 131 (2024), 106248. https://doi.org/10.1016/j.jfca.2024.106248 doi: 10.1016/j.jfca.2024.106248
|
| [3] |
Q. Ma, Z. Liu, T. Zhang, S. Zhao, X. Gao, T. Sun, et al., Multielement simultaneous quantitative analysis of trace elements in stainless steel via full spectrum laser-induced breakdown spectroscopy, Talanta, 10 (2024), 125745. https://doi.org/10.1016/j.talanta.2024.125745 doi: 10.1016/j.talanta.2024.125745
|
| [4] |
W. Liu, Y. Fang, H. Qiu, C. Bi, X. Huang, S. Lin, et al., Determinants and performance prediction on photocatalytic properties of hydroxyapatite by machine learning, Opt. Mater., 146 (2023), 114510. https://doi.org/10.1016/j.optmat.2023.114510 doi: 10.1016/j.optmat.2023.114510
|
| [5] |
S. Y. Xu, Q. Zhou, W. Liu, Prediction of soliton evolution and equation parameters for NLS–MB equation based on the phPINN algorithm, Nonlinear Dyn., 111 (2023), 18401–18417. https://doi.org/10.1007/s11071-023-08824-w doi: 10.1007/s11071-023-08824-w
|
| [6] |
H. Waheed, S. Hassan, N. R. Aljohani, J. Hardman, S. Alelyani, R. Nawaz, Predicting academic performance of students from VLE big data using deep learning models, Comput. Human Behav., 104 (2020), 106189. https://doi.org/10.1016/j.chb.2019.106189 doi: 10.1016/j.chb.2019.106189
|
| [7] | R. Umer, T. Susnjak, A. Mathrani, S. Suriadi, On predicting academic performance with process mining in learning analytics, JRIT & L, 10 (2017), 160–176. |
| [8] |
M. M. Hussain, S. Akbar, S. A. Hassan, M. W. Aziz, F. Urooj, Prediction of Student's Academic Performance through Data Mining Approach, J. Inform. Web Eng., 3 (2024), 241–251. 10.33093/jiwe.2024.3.1.16 doi: 10.33093/jiwe.2024.3.1.16
|
| [9] | R. C. Morilla, R. D. Omabe, C. J. S. Tolibas, E. E. C. Cornillez Jr, J. K. D. Treceñe, Application of machine learning algorithms in predicting the performance of students in mathematics in the modern world, TARAN-AWAN J. Educ. Res. Technol. Manag., 1 (2020), 49–57. |
| [10] |
A. Mueen, B. Zafar, U. Manzoor, Modeling and predicting students' academic performance using data mining techniques, IJMECS, 8 (2016), 36–426. https://doi.org/10.5815/ijmecs.2016.11.05 doi: 10.5815/ijmecs.2016.11.05
|
| [11] |
A. M. Shahiri, W. Husain, N. A. Rashid, A review on predicting student's performance using data mining techniques, Proc. Comput. Sci., 72 (2015), 414–422. https://doi.org/10.1016/j.procs.2015.12.157 doi: 10.1016/j.procs.2015.12.157
|
| [12] | L. Breiman, Random forests, Mach. Learn., 45 (2001), 5–32. https://doi.org/10.1023/A: 1010933404324 |
| [13] |
S. L. Salzberg, C4.5: Programs for Machine Learning by J. Ross Quinlan. Morgan Kaufmann Publishers, Inc., 1993, Mach. Learn., 16 (1994), 235–240. https://doi.org/10.1007/BF00993309 doi: 10.1007/BF00993309
|
| [14] | L. Breiman, J. Friedman, R. O. Olshen, C. J. Stone, Classification and Regression Trees, New York: Chapman and Hall/CRC, 1984. https://doi.org/10.1201/9781315139470 |
| [15] | N. Cristianini, J. Shawe-Taylor, An introduction to support vector machines and other kernel-based learning methods, Cambridge: Cambridge University Press, 2000. https://doi.org/10.1017/CBO9780511801389 |
| [16] | I. B. A. Peling, I. N. Arnawan, I. P. A. Arthawan, I. G. N. Janardana, Implementation of Data Mining To Predict Period of Students Study Using Naive Bayes Algorithm, Int. J. Eng. Emerg. Technol, 2 (2017), 53–57. |
| [17] | M. Bramer, Principles of Data Mining, London: Springer, 2020. https://doi.org/10.1007/978-1-4471-7493-6 |
| [18] | University of California, Irvine, School of Information and Computer Sciences, UCI Machine Learning Repository, 2019. Available from: http://archive.ics.uci.edu/ml. |
| [19] | P. Cortez, A. M. G. Silva, Using data mining to predict secondary school student performance, EUROSIS-ETI, 10 (2008), 5–12. |
| [20] |
W. J. Dixon, Simplified estimation from censored normal samples, Ann. Math. Stat., 10 (1960), 385–391. 10.1214/aoms/1177705900 doi: 10.1214/aoms/1177705900
|
| [21] | S. Finlay, Predictive analytics, data mining and big data: Myths, misconceptions and methods, Hampshire: Palgrave Macmillan, 2014. https://doi.org/10.1057/9781137379283 |


Figures(5) / Tables(4)

Abdulmajeed Atiah Alharbi, Jeza Allohibi. A new hybrid classification algorithm for predicting student performance[J]. AIMS Mathematics, 2024, 9(7): 18308-18323. doi: 10.3934/math.2024893


 DownLoad: