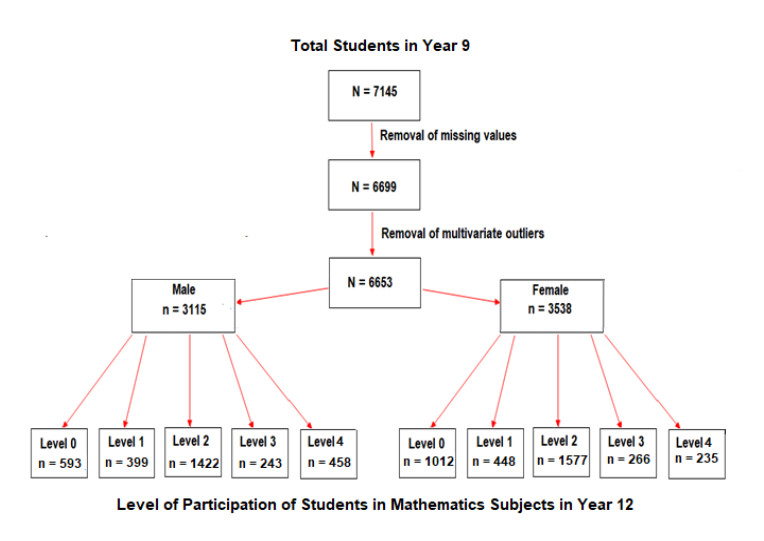
The mathematics performance of Australian high-school students in Year 9 and their participation in mathematics subjects in Year 12 has plummeted in the last 20 years. In this paper, a retrospective cohort study was conducted to understand how non-cognitive variables controlled or explained the correlation between mathematics performance in Year 9 and mathematics participation in Year 12. The sample consisted of a cohort of Australian students (N = 6653; n = 3115, 46.8% male) who participated in the Longitudinal Survey of Australian Youth (LSAY) in 2007 to 2017. Partial least squares structural equation modelling (PLS-SEM) was conducted to explore the degree to which one moderating variable and five mediating variables intervened in the relationship between mathematics performance in Year 9 and mathematics participation in Year 12. Mathematics performance in Year 9 predicted mathematics participation in Year 12 (R2 = 18.4%). The positive correlation was moderated by gender and mediated by five non-cognitive factors associated with self-related beliefs: mathematics self-concept, self-efficacy, interest, motivation, and anxiety (R2 = 28.9%). At any given level of mathematics performance in Year 9, a male student with a higher level of mathematics self-concept, self-efficacy, interest, and motivation, and a lower level of anxiety, was more likely to participate in mathematics subjects in Year 12 than a female student with a lower level of mathematics self-concept, self-efficacy, interest, and motivation, and a higher level of anxiety. These finding have implications for ameliorating the declining levels of mathematics performance and participation.
Citation: Ali Rashash R. Alzahrani. Longitudinal PLS-SEM analysis of the performance and participation of students in mathematics[J]. AIMS Mathematics, 2024, 9(8): 22680-22696. doi: 10.3934/math.20241105
The mathematics performance of Australian high-school students in Year 9 and their participation in mathematics subjects in Year 12 has plummeted in the last 20 years. In this paper, a retrospective cohort study was conducted to understand how non-cognitive variables controlled or explained the correlation between mathematics performance in Year 9 and mathematics participation in Year 12. The sample consisted of a cohort of Australian students (N = 6653; n = 3115, 46.8% male) who participated in the Longitudinal Survey of Australian Youth (LSAY) in 2007 to 2017. Partial least squares structural equation modelling (PLS-SEM) was conducted to explore the degree to which one moderating variable and five mediating variables intervened in the relationship between mathematics performance in Year 9 and mathematics participation in Year 12. Mathematics performance in Year 9 predicted mathematics participation in Year 12 (R2 = 18.4%). The positive correlation was moderated by gender and mediated by five non-cognitive factors associated with self-related beliefs: mathematics self-concept, self-efficacy, interest, motivation, and anxiety (R2 = 28.9%). At any given level of mathematics performance in Year 9, a male student with a higher level of mathematics self-concept, self-efficacy, interest, and motivation, and a lower level of anxiety, was more likely to participate in mathematics subjects in Year 12 than a female student with a lower level of mathematics self-concept, self-efficacy, interest, and motivation, and a higher level of anxiety. These finding have implications for ameliorating the declining levels of mathematics performance and participation.

| [1] | PISA, Highlights of PISA 2018 Results Web Report (NCES 2020-166). U. S. Department of Education. Institute of Education Sciences, National Center for Education Statistics, 2018. Available from: https://nces.ed.gov/surveys/pisa/pisa2018/pdf/2020166.pdf. |
| [2] | P. Smith, M. Ladewig, R. Prinsley, Improving the mathematics performance of Australia's students, 2018. Available from: https://www.chiefscientist.gov.au/sites/default/files/Improving-the-mathematics-performance-of-Australias-students.pdf. |
| [3] | Australian Mathematics Science Institute, Time to get real on Maths as PISA reveals decline, 2019. Available from: https://amsi.org.au/2019/12/04/time-to-get-real-on-maths-as-pisa-reveals-decline/. |
| [4] | R. Wilson, Why it matters that student participation in maths and science is declining, 2015. Available from: https://theconversation.com/why-it-matters-that-student-participation-in-maths-and-science-is-declining-4755. |
| [5] | Office of the Chief Scientist, Australia's STEM Workforce Report, 2016. Available from: https://www.chiefscientist.gov.au/2016/03/report-australias-stem-workforce. |
| [6] | E. Prieto, N. Dugar, An enquiry into the influence of mathematics on students' choice of STEM careers, Int. J. Sci. Math. Educ., 15 (2017), 1501–1520. |
| [7] | J. Kennedy, T. Lyons, F. Quinn, The continuing decline of science and mathematics enrolments in Australian high schools, Teach. Sci., 60 (2014), 34–46. |
| [8] | S. Kim, New research shows declining interest in STEM, 2018. Available from: https://www.govtech.com/education/k-12/new-research-shows-declining-interest-in-stem.html. |
| [9] |
G. R. Brown, K. Alexandersen, Gender equality and gender gaps in mathematics performance, Trends Cognit. Sci., 24 (2020), 591–593. https://doi.org/10.1016/j.tics.2020.06.002 doi: 10.1016/j.tics.2020.06.002

|
| [10] |
G. Dossi, D. Figlio, P. Giuliano, P. Sapienza, Born in the family: Preferences for boys and the gender gap in mathematics, J. Econ. Behav. Organ., 183 (2021), 175–188. https://doi.org/10.1016/j.jebo.2020.12.012 doi: 10.1016/j.jebo.2020.12.012
|
| [11] |
D. Giofrè, C. Cornoldi, A. Martini, E. Toffalini, A population level analysis of the gender gap in mathematics: Results on over 13 million children using the INVALSI dataset, Intelligence, 81 (2020), 101467. https://doi.org/10.1016/j.intell.2020.101467 doi: 10.1016/j.intell.2020.101467
|
| [12] |
H. L. Tao, C. Michalopoulos, Gender equality and the gender gap in mathematics, J. Biosoc. Sci., 50 (2018), 227–243. https://doi.org/10.1017/S0021932017000141 doi: 10.1017/S0021932017000141
|
| [13] |
X. Huang, J. Zhang, L. Hudson, Impact of mathematics self-efficacy, mathematics anxiety, and growth mindset on mathematics and science career interest for middle school students: The gender moderating effect, Eur. J. Psychol. Educ., 34 (2018), 621–640. https://doi.org/10.1007/s10212-018-0403-z doi: 10.1007/s10212-018-0403-z
|
| [14] |
H. I. Van Mier, T. M. J. Schleepen, F. Van den Berg, Gender differences regarding the impact of mathematics anxiety on arithmetic performance in second and fourth graders, Front. Psychol., 9 (2019), 2690. https://doi.org/10.3389/fpsyg.2018.02690 doi: 10.3389/fpsyg.2018.02690
|
| [15] |
B. Ertl, S. Luttenberger, M. Paechter, The impact of gender stereotypes on the self-concept of female students in STEM subjects with an under-representation of females, Front. Psychol., 8 (2017), 703. https://doi.org/10.3389/fpsyg.2017.00703 doi: 10.3389/fpsyg.2017.00703
|
| [16] |
J. Van der Beek, S. Van der Ven, E. Kroesbergen, Self-concept mediates the relation between achievement and emotions in mathematics, Brit. J. Educ. Psychol., 87 (2017), 478–495. https://doi.org/10.1111/bjep.12160 doi: 10.1111/bjep.12160
|
| [17] |
S. Grigg, H. N. Perera, P. Mclveen, Z. Svetlof, Relations among mathematics self- efficacy, interest, intentions, and achievement: A social cognitive perspective, Contemp. Educ. Psychol., 53 (2018), 76–86. https://doi.org/10.1016/j.cedpsych.2018.01.007 doi: 10.1016/j.cedpsych.2018.01.007
|
| [18] |
E. J. Prast, Van der Weiger-Bergsma, M. Miocevic, E. H. Kroesbergen, E. H. Van Luit, Relations between mathematics achievement and motivation in students of diverse achievement levels, Contem. Educ. Psychol., 55 (2018), 84–96. https://doi.org/10.1016/j.cedpsych.2018.08.002 doi: 10.1016/j.cedpsych.2018.08.002
|
| [19] |
S. Recber, M. Isiksal, Y. Koc, Investigating self-efficacy, anxiety, attitudes, and achievement of mathematics with respect to gender and type of school, Ann. Psychol., 34 (2018), 41–51. https://doi.org/10.6018/analesps.34.1.229571 doi: 10.6018/analesps.34.1.229571
|
| [20] | S. Luttenberger, S. Wimmer, M. Paechter, Spotlight on mathematics anxiety, Psychol. Res. Behav. Manag., 11 (2018), 311–322. |
| [21] |
J. Palestro, M. M. Jameson, Math self-efficacy, not emotional self-efficacy, mediates the mathematics anxiety-performance relationship in undergraduate students, Cognit., Brain, Behav., 24 (2020), 379–394. https://doi.org/10.24193/cbb.2020.24.20 doi: 10.24193/cbb.2020.24.20
|
| [22] |
A. Habók, A. Magyar, M. B. Németh, B. Csapó, Motivation and self-related beliefs as predictors of academic achievement in reading and mathematics: Structural equation models of longitudinal data, Int. J. Educ. Res., 103 (2020), 101634. https://doi.org/10.1016/j.ijer.2020.101634 doi: 10.1016/j.ijer.2020.101634
|
| [23] |
E. Kikas, G. Silinskas, E. Härma, Topic-and learning-related predictors of deep-level learning strategies, Eur. J. Psychol. Educ., 2023. https://doi.org/10.1007/s10212-023-00766-6 doi: 10.1007/s10212-023-00766-6
|
| [24] |
B. Özcan, B., Y. Z. Kültür, The relationship between sources of mathematics self-efficacy and mathematics test and course achievement in high school seniors, Sage Open, 11 (2021). https://doi.org/10.1177/21582440211040124 doi: 10.1177/21582440211040124
|
| [25] | C. Ryan, Attitudes of boys and girls towards science and mathematics in Australia, 2016. Available from: https://www.agsa.org.au/research/attitudes-boys-girls-towards-science-maths-australia-ryan-2016/. |
| [26] |
R. J. Calin-Jageman, G. Cumming, The new statistics for better science: Ask how much, how uncertain, and what else is known, Amer. Stat., 73 (2018), 271–280. https://doi.org/10.1080/00031305.2018.1518266 doi: 10.1080/00031305.2018.1518266
|
| [27] |
S. Parvazian, R. Semo, The Longitudinal Surveys of Australian Youth: 20 years and beyond, Austr. Econ. Rev., 51 (2018), 426–440. https://doi.org/10.1111/1467-8462.12287 doi: 10.1111/1467-8462.12287
|
| [28] | J. F. Hair, G. T. M. Hult, C. M. Ringle, M. Sarstedt, A primer on partial least squares structural equation modeling (PLS-SEM), 3 Eds., Thousand Oaks, CA: Sage, 2022. |
| [29] | S. H. Hurlbert, R. A. Levine, J. Utts, Coup de grâce for a tough old bull: Statistical significance expires, Amer. Stat., 73 (2019), 352–357. https://doi.org/1.1080/00031305.2018.1543616 |
| [30] |
R. Matthews, The p-value statement, five years on, Significance, 18 (2021), 16–19. https://doi.org/10.1111/1740-9713.01505 doi: 10.1111/1740-9713.01505
|
| [31] |
V. Amrhein, S. Greenland, B. McShane, Scientists rise up against statistical significance, Nature, 567 (2019), 305–307. https://doi.org/10.1038/d41586-019-00857-9 doi: 10.1038/d41586-019-00857-9
|
| [32] | C. J. Ferguson, An effect size primer: A guide for clinicians and researchers, In: Methodological issues and strategies in clinical research, 4 Eds., American Psychological Association, 2016,301–310. https://doi.org/10.1037/14805-020 |
| [33] |
K. Mohajeri, M. Megari, A. S. Lee, When statistical significance is not enough: Investigating relevance, practical significance, and statistical significance, MIS Quart., 44 (2020), 525–559. https://doi.org/10.25300/MISQ/2020/13932 doi: 10.25300/MISQ/2020/13932
|
| [34] |
A. Bakker, J. Cai, L. English, G. Kaiser, V. Mesa, W. Van Dooren, Beyond small, medium, or large: Points of consideration when interpreting effect sizes, Educ. Stud. Math., 102 (2019), 1–8. https://doi.org/10.1007/s10649-019-09908-4 doi: 10.1007/s10649-019-09908-4
|
| [35] | M. A. Silan, A primer on practical significance, 2019. Available from: https://europepmc.org/article/PPR/PPR324253. |
| [36] |
A. Simpson, Princesses are bigger than elephants: Effect size as a category error in evidence-based education, Brit. Educ. Res. J., 44 (2018), 897–913. https://doi.org/10.1002/berj.3474 doi: 10.1002/berj.3474
|
| [37] |
A. A. Moustafa, A. A. Al-Emadi, A. M. Megreya, The need to develop an individualized intervention for mathematics anxiety, Front. Psychol., 12 (2021), 723289. https://doi.org/10.3389/fpsyg.2021.723289 doi: 10.3389/fpsyg.2021.723289
|
| [38] | C. O. Akinwamide, The quest for better pedagogical and boosting learning outcomes in mathematics education: The enhanced collaborative strategy paradigm, Brit. J. Educ., 10 (2022), 1–15. |
| [39] | S. M. Adeniji, S. K. Ameen, B. U. Dambatta, R. Orilonise, Effect of mastery learning approach on senior school students' academic performance and retention in circle geometry, Int. J. Instr. 11 (2018), 951–962. |

Figures(2) / Tables(7)

Ali Rashash R. Alzahrani. Longitudinal PLS-SEM analysis of the performance and participation of students in mathematics[J]. AIMS Mathematics, 2024, 9(8): 22680-22696. doi: 10.3934/math.20241105


 DownLoad: