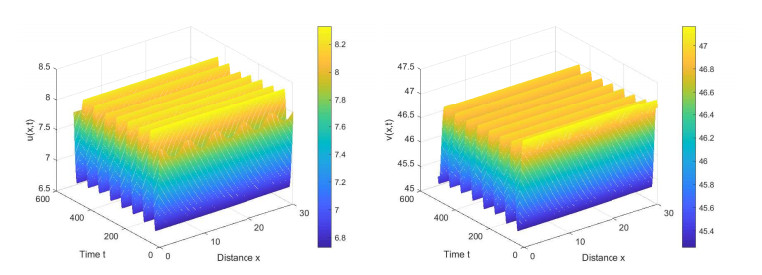
This paper is concerned with a population model with prey refuge and a Holling type Ⅲ functional response in the presence of self-diffusion and cross-diffusion, and its Turing pattern formation problem of Hopf bifurcating periodic solutions was studied. First, we discussed the stability of periodic solutions for the ordinary differential equation model, and derived the first derivative formula of periodic functions for the perturbed model. Second, applying the Floquet theory, we gave the conditions of Turing patterns occurring at Hopf bifurcating periodic solutions. Additionally, we determined the range of cross-diffusion coefficients for the diffusive population model to form Turing patterns at the stable periodic solutions. Finally, our research was summarized and the relevant conclusions were simulated numerically.
Citation: Weiyu Li, Hongyan Wang. The instability of periodic solutions for a population model with cross-diffusion[J]. AIMS Mathematics, 2023, 8(12): 29910-29924. doi: 10.3934/math.20231529
This paper is concerned with a population model with prey refuge and a Holling type Ⅲ functional response in the presence of self-diffusion and cross-diffusion, and its Turing pattern formation problem of Hopf bifurcating periodic solutions was studied. First, we discussed the stability of periodic solutions for the ordinary differential equation model, and derived the first derivative formula of periodic functions for the perturbed model. Second, applying the Floquet theory, we gave the conditions of Turing patterns occurring at Hopf bifurcating periodic solutions. Additionally, we determined the range of cross-diffusion coefficients for the diffusive population model to form Turing patterns at the stable periodic solutions. Finally, our research was summarized and the relevant conclusions were simulated numerically.

| [1] | M. Hassell, The dynamics of arthropod predator-prey systems, New Haven: Princeton University Press, 1979. http://dx.doi.org/10.12987/9780691209968 |
| [2] |
R. Holt, Optimal foraging and the form of the predator isocline, Am. Nat., 122 (1983), 521–541. http://dx.doi.org/10.1086/284153 doi: 10.1086/284153

|
| [3] |
A. Sih, Prey refuges and predator-prey stability, Theor. Popul. Biol., 31 (1987), 1–12. http://dx.doi.org/10.1016/0040-5809(87)90019-0 doi: 10.1016/0040-5809(87)90019-0
|
| [4] |
G. Ruxton, Short term refuge use and stability of predator-prey models, Theor. Popul. Biol., 47 (1995), 1–17. http://dx.doi.org/10.1006/tpbi.1995.1001 doi: 10.1006/tpbi.1995.1001
|
| [5] |
J. Collings, Bifurcation and stability analysis of a temperature-dependent mite predator-prey interaction model incorporating a prey refuge, Bull. Math. Biol., 57 (1995), 63–76. http://dx.doi.org/10.1016/0092-8240(94)00024-7 doi: 10.1016/0092-8240(94)00024-7
|
| [6] |
T. Kar, Stability analysis of a prey-predator model incorporating a prey refuge, Commun. Nonlinear Sci., 10 (2005), 681–691. http://dx.doi.org/10.1016/j.cnsns.2003.08.006 doi: 10.1016/j.cnsns.2003.08.006
|
| [7] |
E. Gonzlez-Olivares, R. Ramos-Jiliberto, Dynamic consequences of prey refuges in a simple model system: more prey, fewer predators and enhanced stability, Ecol. Model., 166 (2003), 135–146. http://dx.doi.org/10.1016/S0304-3800(03)00131-5 doi: 10.1016/S0304-3800(03)00131-5
|
| [8] |
T. Kar, Modelling and analysis of a harvested prey-predator system incorporating a prey refuge, J. Comput. Appl. Math., 185 (2006), 19–33. http://dx.doi.org/10.1016/j.cam.2005.01.035 doi: 10.1016/j.cam.2005.01.035
|
| [9] |
R. Yang, J. Wei, Stability and bifurcation analysis of a diffusive prey-predator system in Holling type Ⅲ with a prey refuge, Nonlinear Dyn., 79 (2015), 631–646. http://dx.doi.org/10.1007/s11071-014-1691-8 doi: 10.1007/s11071-014-1691-8
|
| [10] |
F. Wang, R. Yang, Spatial pattern formation driven by the cross-diffusion in a predator-prey model with Holling type functional response, Chaos Soliton. Fract., 174 (2023), 113890. http://dx.doi.org/10.1016/j.chaos.2023.113890 doi: 10.1016/j.chaos.2023.113890
|
| [11] |
R. Yang, C. Nie, D. Jin, Spatiotemporal dynamics induced by nonlocal competition in a diffusive predator-prey system with habitat complexity, Nonlinear Dyn., 110 (2022), 879–900. http://dx.doi.org/10.1007/s11071-022-07625-x doi: 10.1007/s11071-022-07625-x
|
| [12] |
R. Yang, F. Wang, D. Jin, Spatially inhomogeneous bifurcating periodic solutions induced by nonlocal competition in a predator-prey system with additional food, Math. Method. Appl. Sci., 45 (2022), 9967–9978. http://dx.doi.org/10.1002/mma.8349 doi: 10.1002/mma.8349
|
| [13] |
R. Yang, X. Zhao, Y. An, Dynamical analysis of a delayed diffusive predator-prey model with additional food provided and anti-predator behavior, Mathematics, 10 (2022), 469. http://dx.doi.org/10.3390/math10030469 doi: 10.3390/math10030469
|
| [14] |
R. Yang, Q. Song, Y. An, Spatiotemporal dynamics in a predator-prey model with functional response increasing in both predator and prey densities, Mathematics, 10 (2022), 17. http://dx.doi.org/10.3390/math10010017 doi: 10.3390/math10010017
|
| [15] |
H. Shen, Y. Song, H. Wang, Bifurcations in a diffusive resource-consumer model with distributed memory, J. Differ. Equations, 347 (2023), 170–211. http://dx.doi.org/10.1016/j.jde.2022.11.044 doi: 10.1016/j.jde.2022.11.044
|
| [16] |
G. Sun, H. Zhang, Y. Song, L. Li, Z. Jin, Dynamic analysis of a plant-water model with spatial diffusion, J. Differ. Equations, 329 (2022), 395–430. http://dx.doi.org/10.1016/j.jde.2022.05.009 doi: 10.1016/j.jde.2022.05.009
|
| [17] |
Y. Song, Y. Peng, T. Zhang, The spatially inhomogeneous Hopf bifurcation induced by memory delay in a memory-based diffusion system, J. Differ. Equations, 300 (2021), 597–624. http://dx.doi.org/10.1016/j.jde.2021.08.010 doi: 10.1016/j.jde.2021.08.010
|
| [18] |
J. Zhang, W. Li, Y. Wang, Turing patterns of a strongly coupled predator-prey system with diffusion effects, Nonlinear Anal.- Theor., 74 (2011), 847–858. http://dx.doi.org/10.1016/j.na.2010.09.035 doi: 10.1016/j.na.2010.09.035
|
| [19] |
S. Aly, Turing instability in a predator-prey model in patchy space with self and cross diffusion, J. Korean Soc. Ind. Appl. Math., 17 (2013), 129–138. http://dx.doi.org/10.12941/jksiam.2013.13.129 doi: 10.12941/jksiam.2013.13.129
|
| [20] |
Z. Ling, L. Zhang, Z. Lin, Turing pattern formation in a predator-prey system with cross diffusion, Appl. Math. Model., 38 (2014), 5022–5032. http://dx.doi.org/10.1016/j.apm.2014.04.015 doi: 10.1016/j.apm.2014.04.015
|
| [21] |
L. Guin, Spatial patterns through Turing instability in a reaction-diffusion predator-prey model, Math. Comput. Simulat., 109 (2015), 174–185. http://dx.doi.org/10.1016/j.matcom.2014.10.002 doi: 10.1016/j.matcom.2014.10.002
|
| [22] |
S. Ghorai, S. Poria, Turing patterns induced by cross-diffusion in a predator-prey system in presence of habitat complexity, Chaos Soliton. Fract., 91 (2016), 421–429. http://dx.doi.org/10.1016/j.chaos.2016.07.003 doi: 10.1016/j.chaos.2016.07.003
|
| [23] |
M. Banerjee, S. Ghorai, N. Mukherjee, Study of cross-diffusion induced Turing patterns in a ratio-dependent prey-predator model via amplitude equations, Appl. Math. Model., 55 (2018), 383–399. http://dx.doi.org/10.1016/j.apm.2017.11.005 doi: 10.1016/j.apm.2017.11.005
|
| [24] |
S. Yao, Z. Ma, J. Yue, Bistability and Turing pattern induced by cross fractional diffusion in a predator-prey model, Physica A, 509 (2018), 982–988. http://dx.doi.org/10.1016/j.physa.2018.06.072 doi: 10.1016/j.physa.2018.06.072
|
| [25] |
X. Lian, S. Yan, H. Wang, Pattern formation in predator-prey model with delay and cross diffusion, Abstr. Appl. Anal., 2013 (2013), 147232. http://dx.doi.org/10.1155/2013/147232 doi: 10.1155/2013/147232
|
| [26] |
F. Yi, J. Wei, J. Shi, Bifurcation and spatiotemporal patterns in a homogeneous diffusive predator-prey system, J. Differ. Equations, 246 (2009), 1944–1977. http://dx.doi.org/10.1016/j.jde.2008.10.024 doi: 10.1016/j.jde.2008.10.024
|
| [27] |
K. Maginu, Stability of spatially homogeneous periodic solutions of reaction-diffusion equations, J. Differ. Equations, 31 (1979), 130–138. http://dx.doi.org/10.1016/0022-0396(79)90156-6 doi: 10.1016/0022-0396(79)90156-6
|
| [28] | D. Henry, Geometric theory of semilinear parabolic equations, Berlin: Springer, 1981. http://dx.doi.org/10.1007/BFb0089647 |


Figures(3)

Weiyu Li, Hongyan Wang. The instability of periodic solutions for a population model with cross-diffusion[J]. AIMS Mathematics, 2023, 8(12): 29910-29924. doi: 10.3934/math.20231529


 DownLoad: