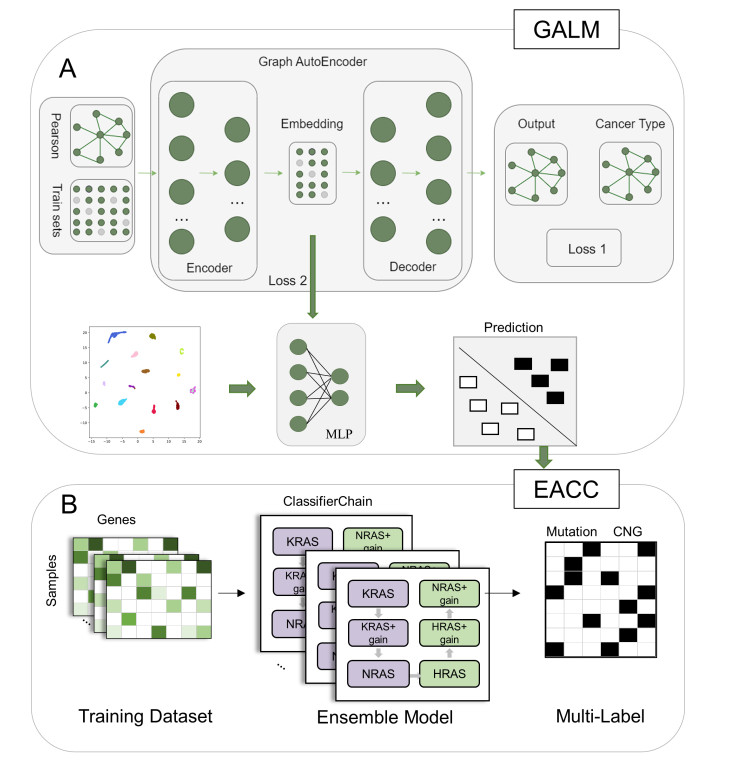
The goal of precision oncology is to select more effective treatments or beneficial drugs for patients. The transcription of ‘‘hidden responders’’ which precision oncology often fails to identify for patients is important for revealing responsive molecular states. Recently, a RAS pathway activation detection method based on machine learning and a nature-inspired deep RAS activation pan-cancer has been proposed. However, we note that the activating gene variations found in KRAS, HRAS and NRAS vary substantially across cancers. Besides, the ability of a machine learning classifier to detect which KRAS, HRAS and NRAS gain of function mutations or copy number alterations causes the RAS pathway activation is not clear. Here, we proposed a deep neural network framework for deciphering and identifying pan-cancer RAS pathway activation (DIPRAS). DIPRAS brings a new insight into deciphering and identifying the pan-cancer RAS pathway activation from a deeper perspective. In addition, we further revealed the identification and characterization of RAS aberrant pathway activity through gene ontological enrichment and pathological analysis. The source code is available by the URL https://github.com/zhaoyw456/DIPRAS.
Citation: Jianting Gong, Yingwei Zhao, Xiantao Heng, Yongbing Chen, Pingping Sun, Fei He, Zhiqiang Ma, Zilin Ren. Deciphering and identifying pan-cancer RAS pathway activation based on graph autoencoder and ClassifierChain[J]. Electronic Research Archive, 2023, 31(8): 4951-4967. doi: 10.3934/era.2023253
The goal of precision oncology is to select more effective treatments or beneficial drugs for patients. The transcription of ‘‘hidden responders’’ which precision oncology often fails to identify for patients is important for revealing responsive molecular states. Recently, a RAS pathway activation detection method based on machine learning and a nature-inspired deep RAS activation pan-cancer has been proposed. However, we note that the activating gene variations found in KRAS, HRAS and NRAS vary substantially across cancers. Besides, the ability of a machine learning classifier to detect which KRAS, HRAS and NRAS gain of function mutations or copy number alterations causes the RAS pathway activation is not clear. Here, we proposed a deep neural network framework for deciphering and identifying pan-cancer RAS pathway activation (DIPRAS). DIPRAS brings a new insight into deciphering and identifying the pan-cancer RAS pathway activation from a deeper perspective. In addition, we further revealed the identification and characterization of RAS aberrant pathway activity through gene ontological enrichment and pathological analysis. The source code is available by the URL https://github.com/zhaoyw456/DIPRAS.

| [1] |
S. H. Shin, A. M. Bode, Z. Dong, Addressing the challenges of applying precision oncology, NPJ Precis. Oncol., 1 (2017), 28. http://doi.org/10.1038/s41698-017-0032-z doi: 10.1038/s41698-017-0032-z

|
| [2] |
D. M. Hyman, B. S. Taylor, J. Baselga, Implementing genome-driven oncology, Cell, 168 (2017), 584–599. http://doi.org/10.1016/j.cell.2016.12.015 doi: 10.1016/j.cell.2016.12.015
|
| [3] |
I. F. Tannock, J. A. Hickman, Limits to personalized cancer medicine, N. Engl. J. Med., 375 (2016), 1289–1294. http://doi.org/10.1056/NEJMsb1607705 doi: 10.1056/NEJMsb1607705
|
| [4] |
C. Kumar-Sinha, A. M. Chinnaiyan, Precision oncology in the age of integrative genomics, Nat. Biotechnol., 36 (2018), 46–60. http://doi.org/10.1038/nbt.4017 doi: 10.1038/nbt.4017
|
| [5] |
G. P. Way, F. Sanchez-Vega, K. La, J. Armenia, W. K. Chatila, A. Luna, et al., Machine learning detects pan-cancer RAS pathway activation in the cancer genome atlas, Cell Rep, 23 (2018), 172–180. http://doi.org/10.1016/j.celrep.2018.03.046 doi: 10.1016/j.celrep.2018.03.046
|
| [6] |
X. Li, S. Li, Y. Wang, S. Zhang, K. C. Wong, Identification of pan-cancer RAS pathway activation with deep learning, Briefings Bioinf., 22 (2021), bbaa258. http://doi.org/10.1093/bib/bbaa258 doi: 10.1093/bib/bbaa258
|
| [7] |
J. Zhang, Y. Zhang, Z. Ma, In silico prediction of human secretory proteins in plasma based on discrete firefly optimization and application to cancer biomarkers identification, Front. Genet., 10 (2019), 542. http://doi.org/10.3389/fgene.2019.00542 doi: 10.3389/fgene.2019.00542
|
| [8] |
R. Scharpf, G. Riely, M. Awad, M. Lenoue-Newton, B. Ricciuti, J. Rudolph, et al., Comprehensive pan-cancer analyses of RAS genomic diversity, Cancer Res., 80 (2020), 1095. http://doi.org/10.1158/1538-7445.Am2020-1095 doi: 10.1158/1538-7445.Am2020-1095
|
| [9] | A. K. Murugan, M. Grieco, N. Tsuchida, RAS mutations in human cancers: Roles in precision medicine, in Seminars in Cancer Biology, Academic Press, (2019), 23–35. https://doi.org/10.1016/j.semcancer.2019.06.007 |
| [10] |
I. A. Prior, P. D. Lewis, C. Mattos, A comprehensive survey of RAS mutations in cancer, Cancer Res., 72 (2012), 2457–2467. http://doi.org/10.1158/0008-5472.can-11-2612 doi: 10.1158/0008-5472.can-11-2612
|
| [11] |
W. Pao, T. Y. Wang, G. J. Riely, V. A. Miller, Q. Pan, M. Ladanyi, et al., KRAS mutations and primary resistance of lung adenocarcinomas to gefitinib or erlotinib, PLoS Med., 2 (2005), e17. http://doi.org/10.1371/journal.pmed.0020017 doi: 10.1371/journal.pmed.0020017
|
| [12] |
Z. Wu, S. Pan, F. Chen, G. Long, C. Zhang, P. S. Yu, A comprehensive survey on graph neural networks, IEEE Trans. Neural Networks Learn. Syst., 32 (2021), 4–24. http://doi.org/10.1109/TNNLS.2020.2978386 doi: 10.1109/TNNLS.2020.2978386
|
| [13] |
R. Hasibi, T. Michoel, A graph feature auto-encoder for the prediction of unobserved node features on biological networks, BMC Bioinf., 22 (2021), 525. http://doi.org/10.1186/s12859-021-04447-3 doi: 10.1186/s12859-021-04447-3
|
| [14] |
J. Read, B. Pfahringer, G. Holmes, E. Frank, Classifier chains for multi-label classification, Mach. Learn., 85 (2011), 333–359. http://doi.org/10.1007/s10994-011-5256-5 doi: 10.1007/s10994-011-5256-5
|
| [15] | T. N. Kipf, M. Welling, Semi-supervised classification with graph convolutional networks, arXiv preprint, (2016), arXiv: 1609.02907. https://doi.org/10.48550/arXiv.1609.02907 |
| [16] |
P. T. De Boer, D. P. Kroese, S. Mannor, R. Y. Rubinstein, A tutorial on the cross-entropy method, Ann. Oper. Res., 134 (2005), 19–67. http://doi.org/10.1007/s10479-005-5724-z doi: 10.1007/s10479-005-5724-z
|
| [17] | D. P. Kingma, J. Ba, Adam: A method for stochastic optimization, arXiv preprint, (2014), arXiv: 1412.6980. https://doi.org/10.48550/arXiv.1412.6980 |
| [18] |
J. H. Cook, G. E. Melloni, D. C. Gulhan, P. J. Park, K. M. Haigis, The origins and genetic interactions of KRAS mutations are allele-and tissue-specific, Nat. Commun., 12 (2021), 1808. http://doi.org/10.1038/s41467-021-22125-z doi: 10.1038/s41467-021-22125-z
|
| [19] |
E. Becht, L. Mcinnes, J. Healy, C. A. Dutertre, I. W. H. Kwok, L. G. Ng, et al., Dimensionality reduction for visualizing single-cell data using UMAP, Nat. Biotechnol., 37 (2019), 38–44. http://doi.org/10.1038/nbt.4314 doi: 10.1038/nbt.4314
|
| [20] | V. J. Pandya, Comparing handwritten character recognition by AdaBoostClassifier and KNeighborsClassifier, in 2016 8th International Conference on Computational Intelligence and Communication Networks, IEEE, (2016), 271–274. http://doi.org/10.1109/Cicn.2016.59 |
| [21] |
Z. A. Huang, J. Zhang, Z. Zhu, E. Q. Wu, K. C. Tan, Identification of autistic risk candidate genes and toxic chemicals via multilabel learning, IEEE Trans. Neural Networks Learn. Syst., 32 (2020), 3971–3984. http://doi.org/10.1109/TNNLS.2020.3016357 doi: 10.1109/TNNLS.2020.3016357
|
| [22] | S. M. Lundberg, S. I. Lee, A unified approach to interpreting model predictions, in Advances in Neural Information Processing Systems 30, (2017). |
| [23] | A. Shrikumar, P. Greenside, A. Kundaje, Learning important features through propagating activation differences, in International Conference on Machine Learning, PMLR, (2017), 3145–3153. |
| [24] |
F. J. Martin, M. R. Amode, A. Aneja, O. Austine-Orimoloye, A. G. Azov, I. Barnes, et al., Ensembl 2023, Nucleic Acids Res., 51 (2023), D933–D941. http://doi.org/10.1093/nar/gkac958 doi: 10.1093/nar/gkac958
|
| [25] |
H. Ogata, S. Goto, K. Sato, W. Fujibuchi, H. Bono, M. Kanehisa, KEGG: Kyoto encyclopedia of genes and genomes, Nucleic Acids Res., 27 (1999), 29–34. http://doi.org/10.1093/nar/27.1.29 doi: 10.1093/nar/27.1.29
|
| [26] |
T. Kodaki, R. Woscholski, B. Hallberg, P. Rodriguez-Viciana, J. Downward, P. J. Parker, The activation of phosphatidylinositol 3-kinase by RAS, Curr. Biol., 4 (1994), 798–806. http://doi.org/10.1016/s0960-9822(00)00177-9 doi: 10.1016/s0960-9822(00)00177-9
|
| [27] |
P. M. Campbell, A. L. Groehler, K. M. Lee, M. M. Ouellette, V. Khazak, C. J. Der, K-RAS promotes growth transformation and invasion of immortalized human pancreatic cells by Raf and phosphatidylinositol 3-kinase signaling, Cancer Res., 67 (2007), 2098–2106. http://doi.org/10.1158/0008-5472.CAN-06-3752 doi: 10.1158/0008-5472.CAN-06-3752
|
| [28] |
M. Zenker, Clinical manifestations of mutations in RAS and related intracellular signal transduction factors, Curr. Opin. Pediatr., 23 (2011), 443–451. http://doi.org/10.1097/MOP.0b013e32834881dd doi: 10.1097/MOP.0b013e32834881dd
|
| [29] |
J. L. Bos, M. Verlaan-De Vries, A. J. Van Der Eb, J. W. Janssen, R. Delwel, B. Lowenberg, et al., Mutations in N-RAS predominate in acute myeloid leukemia, Blood, 69 (1987), 1237–1241. https://doi.org/10.1182/blood.V69.4.1237.1237 doi: 10.1182/blood.V69.4.1237.1237
|
| [30] | J. D. Khoury, M. Tashakori, H. Yang, S. Loghavi, Y. Wang, J. Wang, et al., Pan-RAF inhibition shows anti-leukemic activity in RAS-mutant acute myeloid leukemia cells and potentiates the effect of sorafenib in cells with FLT3 mutation, Cancers, 12 (2020), 3511. http://doi.org/ARTN351110.3390/cancers12123511 |
| [31] |
A. M. Akram, A. Chaudhary, H. Kausar, F. Althobaiti, A. S. Abbas, Z. Hussain, et al., Analysis of RAS gene mutations in cytogenetically normal de novo acute myeloid leukemia patients reveals some novel alterations, Saudi J. Biol. Sci., 28 (2021), 3735–3740. http://doi.org/10.1016/j.sjbs.2021.04.089 doi: 10.1016/j.sjbs.2021.04.089
|


Figures(8) / Tables(1)
Jianting Gong, Yingwei Zhao, Xiantao Heng, Yongbing Chen, Pingping Sun, Fei He, Zhiqiang Ma, Zilin Ren. Deciphering and identifying pan-cancer RAS pathway activation based on graph autoencoder and ClassifierChain[J]. Electronic Research Archive, 2023, 31(8): 4951-4967. doi: 10.3934/era.2023253


 DownLoad: