Coupled neural network models are playing an increasingly important part in the modulation of absence seizures today. However, it is currently unclear how basal ganglia, corticothalamic network and pedunculopontine nucleus can coordinate with each other to develop a whole coupling circuit, theoretically. In addition, it is still difficult to select effective parameters of electrical stimulation on the regulation of absence seizures in clinical trials. Therefore, to develop a coupled model and reduce computation cost, a new model constructed by a simplified basal ganglion, two corticothalamic circuits and a pedunculopontine nucleus was proposed. Further, to seek better inhibition therapy, three electrical stimulations, high frequency stimulation (HFS), 1:0 coordinate reset stimulation (CRS) and 3:2 CRS, were applied to the thalamic reticular nucleus (RE) in the first corticothalamic circuit in the coupled model. The simulation results revealed that increasing the frequency and pulse width of an electrical stimulation within a certain range can also suppress seizures. Under the same parameters of electrical stimulation, the inhibitory effect of HFS on seizures was better than that of 1:0 CRS and 3:2 CRS. The research established a reduced corticothalamic-basal ganglion-pedunculopontine nucleus model, which lays a theoretical foundation for future optimal parameters selection of electrical stimulation. We hope that the findings will provide new insights into the role of theoretical models in absence seizures.
Citation: Xiaolong Tan, Rui Zhu, Yan Xie, Yuan Chai. Suppression of absence seizures by using different stimulations in a reduced corticothalamic-basal ganglion-pedunculopontine nucleus model[J]. Mathematical Biosciences and Engineering, 2023, 20(12): 20468-20485. doi: 10.3934/mbe.2023905
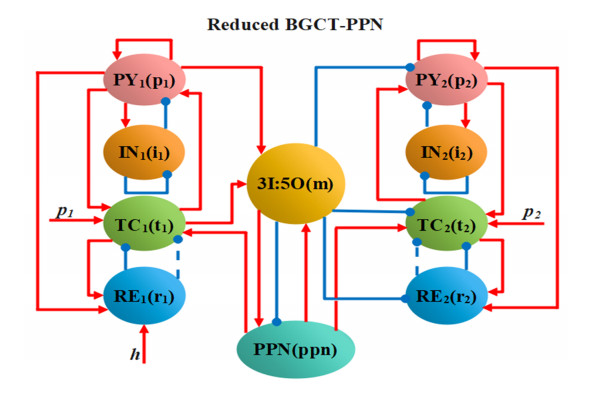
Coupled neural network models are playing an increasingly important part in the modulation of absence seizures today. However, it is currently unclear how basal ganglia, corticothalamic network and pedunculopontine nucleus can coordinate with each other to develop a whole coupling circuit, theoretically. In addition, it is still difficult to select effective parameters of electrical stimulation on the regulation of absence seizures in clinical trials. Therefore, to develop a coupled model and reduce computation cost, a new model constructed by a simplified basal ganglion, two corticothalamic circuits and a pedunculopontine nucleus was proposed. Further, to seek better inhibition therapy, three electrical stimulations, high frequency stimulation (HFS), 1:0 coordinate reset stimulation (CRS) and 3:2 CRS, were applied to the thalamic reticular nucleus (RE) in the first corticothalamic circuit in the coupled model. The simulation results revealed that increasing the frequency and pulse width of an electrical stimulation within a certain range can also suppress seizures. Under the same parameters of electrical stimulation, the inhibitory effect of HFS on seizures was better than that of 1:0 CRS and 3:2 CRS. The research established a reduced corticothalamic-basal ganglion-pedunculopontine nucleus model, which lays a theoretical foundation for future optimal parameters selection of electrical stimulation. We hope that the findings will provide new insights into the role of theoretical models in absence seizures.

| [1] |
Y. Chen, J. Lu, H. Pan, Y. Zhang, H. Wu, K. Xu, et al., Association between genetic variation of CACNA1h and childhood absence seizure, Ann. Neurol., 54 (2003), 239–243. https://doi.org/10.1002/ana.10607 doi: 10.1002/ana.10607

|
| [2] |
C. Wu, J. Xiang, W. Jiang, S. Huang, Y. Gao, L. Tang, et al., Altered effective connectivity network in childhood absence seizure: a multi-frequency MEG study, Brain Topogr., 30 (2017), 673–684. https://doi.org/10.1007/s10548-017-0555-1 doi: 10.1007/s10548-017-0555-1
|
| [3] |
S. L. Moshe, E. Perucca, P. Ryvlin, T. R. Tomson, Epilepsy: New advances, Lancet, 385 (2015), 884–898. https://doi.org/10.1016/S0140-6736(14)60456-6 doi: 10.1016/S0140-6736(14)60456-6
|
| [4] |
V. Crunelli, N. Leresche, Childhood absence seizure: Genes, channels, neurons and networks, Nat. Rev. Neurosci., 3 (2002), 371–382. https://doi.org/10.1038/nrn811 doi: 10.1038/nrn811
|
| [5] |
B. S. Chang, D. H. Lowenstein, Epilepsy, N. Engl. J. Med., 349 (2003), 1257–1266. https://doi.org/10.1056/NEJMra022308 doi: 10.1056/NEJMra022308
|
| [6] |
A. Destexhe, Can GABAA conductances explain the fast oscillation frequency of absence seizures in rodents, Eur. J. Neurosci., 11 (1999), 2175–2181. https://doi.org/10.1046/j.1460-9568.1999.00660.x doi: 10.1046/j.1460-9568.1999.00660.x
|
| [7] |
R. Guerrini, F. Melani, C. Brancati, A. R. Ferrari, P. Brovedani, A. Biggeri, et al., Dysgraphia as a mild expression of dystonia in children with absence seizure, PLoS One, 10 (2015), e0130883. https://doi.org/10.1371/journal.pone.0130883 doi: 10.1371/journal.pone.0130883
|
| [8] |
H. Blumenfeld, K. J. Meador, Consciousness as a useful concept in seizure classification, Epilepsia, 55 (2014), 1145–1150. https://doi.org/10.1111/epi.12588 doi: 10.1111/epi.12588
|
| [9] |
Z. Wang, Q. Wang, Stimulation strategies for absence seizures: Targeted therapy of the focus in coupled thalamocortical model, Nonlinear Dyn., 96 (2019), 1649–1663. https://doi.org/10.1007/s11071-019-04876-z doi: 10.1007/s11071-019-04876-z
|
| [10] |
E. Sitnikova, A. E. Hramov, V. Grubov, Time-frequency characteristics and dynamics of sleep spindles in WAG/Rij rats with absence seizure, Brain Res., 1543 (2014), 290–299. https://doi.org/10.1016/j.brainres.2013.11.001 doi: 10.1016/j.brainres.2013.11.001
|
| [11] |
A. Kandel, G. Buzsáki, Cellular–synaptic generation of sleep spindles, spike-and-wave discharges, and evoked thalamocortical responses in the neocortex of the rat, J. Neurosci., 17 (1997), 6783–6797. https://doi.org/10.1523/JNEUROSCI.17-17-06783.1997 doi: 10.1523/JNEUROSCI.17-17-06783.1997
|
| [12] |
R. L. Albin, A. B. Young, J. B. Penney, The functional anatomy of basal ganglia disorders, Trends Neurosci., 18 (1995), 63–64. https://doi.org/10.1016/0166-2236(95)80020-3 doi: 10.1016/0166-2236(95)80020-3
|
| [13] |
A. Parent, L. N. Hazrati, Functional anatomy of the basal ganglia. I. The cortico-basal ganglia-thalamo-cortical loop, Brain Res. Rev., 20 (1995), 91–127. https://doi.org/10.1016/0165-0173(94)00007-C doi: 10.1016/0165-0173(94)00007-C
|
| [14] |
M. Chen, D. Guo, M. Li, T. Ma, S. Wu, J. Ma, et al., Critical roles of the direct GABAergic pallido-cortical pathway in controlling absence seizures, PLoS Comput. Biol., 11 (2015), e1004539. https://doi.org/10.1371/journal.pcbi.1004539 doi: 10.1371/journal.pcbi.1004539
|
| [15] |
D. Fan, Q. Wang, Closed-loop control of absence seizures inspired by feedback modulation of basal ganglia to the corticothalamic circuit, IEEE Trans. Neural Syst. Rehabil. Eng., 28 (2020), 581–590. https://doi.org/10.1109/TNSRE.2020.2969426 doi: 10.1109/TNSRE.2020.2969426
|
| [16] |
P. A. Robinson, C. J. Rennie, D. L. Rowe, Dynamics of large-scale brain activity in normal arousal states and epileptic seizures, Phys. Rev. E, 65 (2002), 041924. https://doi.org/10.1103/PhysRevE.65.041924 doi: 10.1103/PhysRevE.65.041924
|
| [17] |
M. Chen, D. Guo, T. Wang, W. Jing, Y. Xia, P. Xu, et al., Bidirectional control of absence seizures by the basal ganglia: A computational evidence, PLoS Comput. Biol., 10 (2014), e1003495. https://doi.org/10.1371/journal.pcbi.1003495 doi: 10.1371/journal.pcbi.1003495
|
| [18] |
P. Jiruska, M. De Curtis, J. G. Jefferys, C. A. Schevon, S. J. Schiff, K. Schindler, Synchronization and desynchronization in epilepsy: Controversies and hypotheses, J. Physiol., 591 (2013), 787–797. https://doi.org/10.1113/jphysiol.2012.239590 doi: 10.1113/jphysiol.2012.239590
|
| [19] |
H. F. J. Gonález, S. E. Goodale, M. L. Jacobs, K. F. Hass, B. A. Landman, V. L. Morgan, et al., Brainstem functional connectivity disturbances in epilepsy may recover after successful surgery, Neurosurgery, 86 (2020), 417. https://doi.org/10.1093/neuros/nyz128 doi: 10.1093/neuros/nyz128
|
| [20] |
T. Kita, H. Kita, Cholinergic and non-cholinergic mesopontine tegmental neurons projecting to the subthalamic nucleus in the rat: Pedunculopontine projection to subthalamus, Eur. J. Neurosci., 33 (2011), 433–443. https://doi.org/10.1111/j.1460-9568.2010.07537.x doi: 10.1111/j.1460-9568.2010.07537.x
|
| [21] |
W. Thevathasan, B. Debu, T. Aziz, B. R. Bloem, C. Blahak, C. Butson, et al., Pedunculopontine nucleus deep brain stimulation in Parkinson's disease: A clinical review, Mov. Disord., 33 (2018), 10–20. https://doi.org/10.1002/mds.27098 doi: 10.1002/mds.27098
|
| [22] |
Y. Yu, H. Zhang, L. Zhang, Q. Wang, Dynamical role of pedunculopntine nucleus stimulation on controlling Parkinson's disease, Physica A, 525 (2019), 834–848. https://doi.org/10.1016/j.physa.2019.04.016 doi: 10.1016/j.physa.2019.04.016
|
| [23] |
M. S. Lee, J. Q. Rinne, C. D. Marsden, The pedunculopontine nucleus: its role in the genesis of movement disorders, Yonsei Med. J., 41 (2000), 167–184. https://doi.org/10.3349/ymj.2000.41.2.167 doi: 10.3349/ymj.2000.41.2.167
|
| [24] |
N. Jenkinson, D. Nandi, K. Muthusamy, N. J. Ray, R. Gregory, J. F. Stein, et al., Anatomy, physiology, and pathophysiology of the pedunculopontine nucleus, Mov. Disord., 24 (2009), 319–328. https://doi.org/10.1002/mds.22189 doi: 10.1002/mds.22189
|
| [25] |
P. A. Pahapill, A. M. Lozano, The pedunculopontine nucleus and Parkinson's disease, Brain, 123 (2000), 1767–1783. https://doi.org/10.1093/brain/123.9.1767 doi: 10.1093/brain/123.9.1767
|
| [26] |
A. H. Niktarash, G. A. Shahidi, Effects of the activity of the internal globus palliduspedunculopontine loop on the transmission of the subthalamic nucleus-external globus pallidus-pacemaker oscillatory activities to the cortex, J. Comput. Neurosci., 16 (2004), 113–127. https://doi.org/10.1023/B:JCNS.0000014105.87625.5f doi: 10.1023/B:JCNS.0000014105.87625.5f
|
| [27] |
H. L. Wang, M. Morales, Pedunculopontine and laterodorsal tegmental nuclei contain distinct populations of cholinergic, glutamatergic and GABAergic neurons in the rat, Eur. J. Neurosci., 29 (2009), 340–358. https://doi.org/10.1111/j.1460-9568.2008.06576.x doi: 10.1111/j.1460-9568.2008.06576.x
|
| [28] |
P. Kwan, M. J. Brodie, Early identification of refractory epilepsy, N. Engl. J. Med., 342 (2000), 314–319. https://doi.org/10.1056/NEJM200002033420503 doi: 10.1056/NEJM200002033420503
|
| [29] |
J. Engel, S. Wiebe, J. Frence, M. Sperling, P. Williamson, D. Spencer, et al., Practice parameter: temporal lobe and localized neocortical resections for epilepsy: Report of the Quality Standards Subcommittee of the American Academy of Neurology, in association with the American Epilepsy Society and the American Association of Neurological Surgeons, Neurology, 60 (2003), 538–547. https://doi.org/10.1212/01.WNL.0000055086.35806.2D doi: 10.1212/01.WNL.0000055086.35806.2D
|
| [30] |
K. Lehtimäki, J. W. Långsjö, J. Ollikainen, H. Heinonen, T. Möttönen, T. Tähtinen, et al., Successful management of super-refractory status epilepticus with thalamic deep brain stimulation, Ann. Neurol., 81 (2017), 142–146. https://doi.org/10.1002/ana.24821 doi: 10.1002/ana.24821
|
| [31] |
Z. Nanobashvili, T. Chachua, A. Nanobashvili, I. Bilanishvili, O. Lindvall, Z. Kokaia, Suppression of limbic motor seizures by electrical stimulation in thalamic reticular nucleus, Exp. Neurol., 181 (2003), 224–230. https://doi.org/10.1016/S0014-4886(03)00045-1 doi: 10.1016/S0014-4886(03)00045-1
|
| [32] |
Z. Wang, Q. Wang, Eliminating absence seizures through the deep brain stimulation to thalamus reticular nucleus, Front. Comput. Neurosci., 11 (2017), 22. https://doi.org/10.3389/fncom.2017.00022 doi: 10.3389/fncom.2017.00022
|
| [33] |
T. Wyckhuys, P. Boon, R. Raedt, B. Van Nieuwenhuyse, K. Vonck, W. Wadman, Suppression of hippocampal epileptic seizures in the kainate rat by Poisson distributed stimulation, Epilepsia, 51 (2010), 2297–2304. https://doi.org/10.1111/j.1528-1167.2010.02750.x doi: 10.1111/j.1528-1167.2010.02750.x
|
| [34] |
V. R. Cota, J. C. de Oliveira, L. C. M. Damázio, M. F. D. Moraes, Nonperiodic stimulation for the treatment of refractory epilepsy: Applications, mechanisms, and novel insights, Epilepsy Behav., 121 (2021), 106609. https://doi.org/10.1016/j.yebeh.2019.106609 doi: 10.1016/j.yebeh.2019.106609
|
| [35] |
A. W. Quinkert, N. D. Schiff, D. W. Pfaff, Temporal patterning of pulses during deep brain stimulation affects central nervous system arousal, Behav. Brain Res., 214 (2010), 377–385. https://doi.org/10.1016/j.bbr.2010.06.009 doi: 10.1016/j.bbr.2010.06.009
|
| [36] |
M. Zeitler, P. A. Tass, Anti-kindling induced by two-stage coordinated reset stimulation with weak onset intensity, Front. Comput. Neurosci., 10 (2016), 44. https://doi.org/10.3389/fncom.2016.00044 doi: 10.3389/fncom.2016.00044
|
| [37] |
M. Zeitler, P. A. Tass, Augmented brain function by coordinated reset stimulation with slowly varying sequences, Front. Syst. Neurosci., 9 (2015), 49. https://doi.org/10.3389/fnsys.2015.00049 doi: 10.3389/fnsys.2015.00049
|
| [38] |
D. Fan, Q. Wang, Improving desynchronization of parkinsonian neuronal network via tripletstructure coordinated reset stimulation, J. Theor. Biol., 370 (2015), 157–170. https://doi.org/10.1016/j.jtbi.2015.01.040 doi: 10.1016/j.jtbi.2015.01.040
|
| [39] |
C. R. Pantoja-Jiménez, V. M. Magdaleno-Madrigal, S. Almazán-Alvarado, R. Fernández-Mas, Anti-epileptogenic effect of high-frequency stimulation in the thalamic reticular nucleus on PTZ-induced seizures, Brain Stimul., 7 (2014), 587–594. https://doi.org/10.1016/j.brs.2014.03.012 doi: 10.1016/j.brs.2014.03.012
|
| [40] |
C. J. Rennie, P. A. Robinson, J. J. Wright, Effects of local feedback on dispersion of electrical waves in the cerebral cortex, Phys. Rev. E, 59 (1999), 3320–3329. https://doi.org/10.1103/PhysRevE.59.3320 doi: 10.1103/PhysRevE.59.3320
|
| [41] |
P. A. Robinson, C. J. Rennie, D. L. Rowe, S. C. O'Connor, A. E. Gordon, Multiscale brain modelling, Phil. Trans. R. Soc. B, 360 (2005), 1043–1050. https://doi.org/10.1098/rstb.2005.1638 doi: 10.1098/rstb.2005.1638
|
| [42] |
S. J. van Albada, P. A. Robinson, Mean-field modeling of the basal ganglia-thalamocortical circuit. I: Firing rates in healthy and parkinsonian states, J. Theor. Biol., 257 (2009), 642–663. https://doi.org/10.1016/j.jtbi.2008.12.018 doi: 10.1016/j.jtbi.2008.12.018
|
| [43] |
M. Breakspear, J. A. Roberts, J. R. Terry, S. Rodrigues, N. Mahant, P. A. Robinson, A unifying explanation of primary generalized seizures through nonlinear brain modeling and bifurcation analysis, Cereb. Cortex, 16 (2006), 1296–1313. https://doi.org/10.1093/cercor/bhj072 doi: 10.1093/cercor/bhj072
|
| [44] |
F. Marten, S. Rodrigues, O. Benjamin, M. P. Richardson, J. R. Terry, Onset of polyspike complexes in a mean-field model of human electroencephalography and its application to absence seizure, Phil. Trans. R. Soc. A., 367 (2009), 1145–1161. https://doi.org/10.1098/rsta.2008.0255 doi: 10.1098/rsta.2008.0255
|
| [45] |
F. Freyer, J. A. Roberts, R. Becker, P. A. Robinson, P. Ritter, M. Breakspear, Biophysical mechanisms of multistability in resting-state cortical rhythms, J. Neurosci., 31 (2011), 6353–6361. https://doi.org/10.1523/JNEUROSCI.6693-10.2011 doi: 10.1523/JNEUROSCI.6693-10.2011
|
| [46] |
S. J. van Albada, R. T. Gray, P. M. Drysdale, P. A. Robinson, Mean-field modeling of the basal ganglia-thalamocortical circuit. Ⅱ: Dynamics of parkinsonian oscillations, J. Theor. Biol., 257 (2009), 664–688. https://doi.org/10.1016/j.jtbi.2008.12.013 doi: 10.1016/j.jtbi.2008.12.013
|
| [47] |
B. Hu, D. Guo, Q. Wang, Control of absence seizures induced by the pathways connected to SRN in corticothalamic circuit, Cognit. Neurodyn., 9 (2015), 279–289. https://doi.org/10.1007/s11571-014-9321-1 doi: 10.1007/s11571-014-9321-1
|
| [48] |
P. A. Robinson, C. J. Rennie, D. L. Rowe, Dynamics of large-scale brain activity in normal arousal states and epileptic seizures, Phys. Rev. E, 65 (2002), 041924. https://doi.org/10.1103/PhysRevE.65.041924 doi: 10.1103/PhysRevE.65.041924
|
| [49] |
S. M. Alavi, A. Mirzaei, A. Valizadeh, R. Ebrahimpour, Excitatory deep brain stimulation quenches beta oscillation arising in a computational model of the subthalamo-pallidal loop, Sci. Rep., 12 (2022), 7845. https://doi.org/10.1038/s41598-022-10084-4 doi: 10.1038/s41598-022-10084-4
|
| [50] |
C. Liu, Y. Yao, J. Wang, H. Li, H. Hu, K. A. Loparo, et al., Oscillation suppression effects of intemittent noisy deep brain stimulation induced by coordinated reset pattern based on a computational model, Biomed. Signal Process. Control, 73 (2022), 103466. https://doi.org/10.1016/j.bspc.2021.103466 doi: 10.1016/j.bspc.2021.103466
|
| [51] |
A. Destexhe, Spike-and-wave oscillations based on the properties of GABAB receptors, J. Neurosci., 18 (1998), 9099–9111. https://doi.org/10.1523/JNEUROSCI.18-21-09099.1998 doi: 10.1523/JNEUROSCI.18-21-09099.1998
|
| [52] |
R. L. Macdonald, J. Q. Kang, M. J. Gallagher, H. J. Feng, GABAA receptor mutations seizure associated with generalized epilepsies, Adv. Pharmacol., 54 (2006), 147–169. https://doi.org/10.1016/S1054-3589(06)54007-4 doi: 10.1016/S1054-3589(06)54007-4
|
| [53] |
J. L. Noebels, M. Avoli, M. Rogawski, R. Olsen, A. V. Delgado-Escueta, "Jasper's basic mechanisms of the epilepsies" workshop, Epilepsia, 51 (2010), 1–5. https://doi.org/10.1111/j.1528-1167.2010.02792.x doi: 10.1111/j.1528-1167.2010.02792.x
|


Figures(10) / Tables(2)

Xiaolong Tan, Rui Zhu, Yan Xie, Yuan Chai. Suppression of absence seizures by using different stimulations in a reduced corticothalamic-basal ganglion-pedunculopontine nucleus model[J]. Mathematical Biosciences and Engineering, 2023, 20(12): 20468-20485. doi: 10.3934/mbe.2023905


 DownLoad: