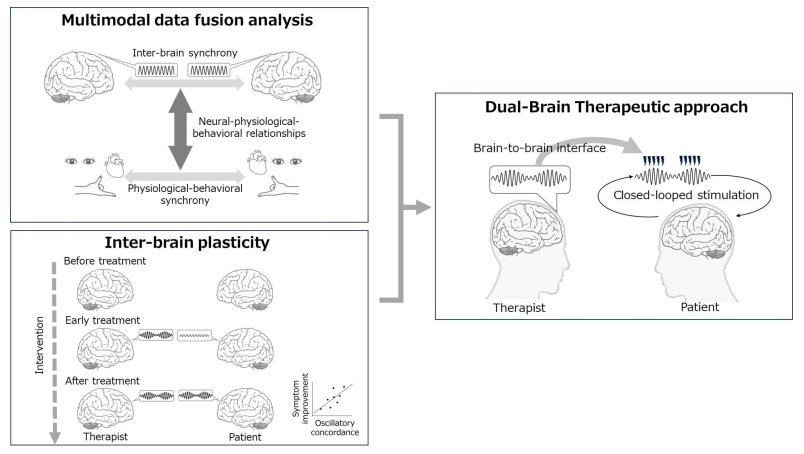
Our actions and decisions in everyday life are heavily influenced by social interactions, which are dynamic feedback loops involving actions, reactions, and internal cognitive processes between individual agents. Social interactions induce interpersonal synchrony, which occurs at different biobehavioral levels and comprises behavioral, physiological, and neurological activities. Hyperscanning—a neuroimaging technique that simultaneously measures the activity of multiple brain regions—has provided a powerful second-person neuroscience tool for investigating the phase alignment of neural processes during interactive social behavior. Neural synchronization, revealed by hyperscanning, is a phenomenon called inter-brain synchrony- a process that purportedly facilitates social interactions by prompting appropriate anticipation of and responses to each other's social behaviors during ongoing shared interactions. In this review, I explored the therapeutic dual-brain approach using noninvasive brain stimulation to target inter-brain synchrony based on second-person neuroscience to modulate social interaction. Artificially inducing synchrony between the brains is a potential adjunct technique to physiotherapy, psychotherapy, and pain treatment- which are strongly influenced by the social interaction between the therapist and patient. Dual-brain approaches to personalize stimulation parameters must consider temporal, spatial, and oscillatory factors. Multiple data fusion analysis, the assessment of inter-brain plasticity, a closed-loop system, and a brain-to-brain interface can support personalized stimulation.
Citation: Naoyuki Takeuchi. A dual-brain therapeutic approach using noninvasive brain stimulation based on two-person neuroscience: A perspective review[J]. Mathematical Biosciences and Engineering, 2024, 21(4): 5118-5137. doi: 10.3934/mbe.2024226
Our actions and decisions in everyday life are heavily influenced by social interactions, which are dynamic feedback loops involving actions, reactions, and internal cognitive processes between individual agents. Social interactions induce interpersonal synchrony, which occurs at different biobehavioral levels and comprises behavioral, physiological, and neurological activities. Hyperscanning—a neuroimaging technique that simultaneously measures the activity of multiple brain regions—has provided a powerful second-person neuroscience tool for investigating the phase alignment of neural processes during interactive social behavior. Neural synchronization, revealed by hyperscanning, is a phenomenon called inter-brain synchrony- a process that purportedly facilitates social interactions by prompting appropriate anticipation of and responses to each other's social behaviors during ongoing shared interactions. In this review, I explored the therapeutic dual-brain approach using noninvasive brain stimulation to target inter-brain synchrony based on second-person neuroscience to modulate social interaction. Artificially inducing synchrony between the brains is a potential adjunct technique to physiotherapy, psychotherapy, and pain treatment- which are strongly influenced by the social interaction between the therapist and patient. Dual-brain approaches to personalize stimulation parameters must consider temporal, spatial, and oscillatory factors. Multiple data fusion analysis, the assessment of inter-brain plasticity, a closed-loop system, and a brain-to-brain interface can support personalized stimulation.

| [1] |
R. Hari, M. V. Kujala, Brain basis of human social interaction: from concepts to brain imaging, Physiol. Rev., 89 (2009), 453–479. https://doi.org/10.1152/physrev.00041.2007 doi: 10.1152/physrev.00041.2007

|
| [2] |
L. Kingsbury, W. Hong, A multi-brain framework for social interaction, Trends Neurosci., 43 (2020), 651–666. https://doi.org/10.1016/j.tins.2020.06.008 doi: 10.1016/j.tins.2020.06.008
|
| [3] |
L. Tsoi, S. M. Burns, E. B. Falk, D. I. Tamir, The promises and pitfalls of functional magnetic resonance imaging hyperscanning for social interaction research, Soc. Pers. Psychol. Compass, 16 (2022), e12707. https://doi.org/10.1111/spc3.12707 doi: 10.1111/spc3.12707
|
| [4] |
I. Gordon, S. Wallot, Y. Berson, Group-level physiological synchrony and individual-level anxiety predict positive affective behaviors during a group decision-making task, Psychophysiology, 58 (2021), e13857. https://doi.org/10.1111/psyp.13857 doi: 10.1111/psyp.13857
|
| [5] |
V. Reindl, S. Wass, V. Leong, W. Scharke, S. Wistuba, C. L. Wirth, et al., Multimodal hyperscanning reveals that synchrony of body and mind are distinct in mother-child dyads, Neuroimage, 251 (2022), 118982. https://doi.org/10.1016/j.neuroimage.2022.118982 doi: 10.1016/j.neuroimage.2022.118982
|
| [6] |
J. Madsen, L. C. Parra, Cognitive processing of a common stimulus synchronizes brains, hearts, and eyes, PNAS Nexus, 1 (2022), pgac020. https://doi.org/10.1093/pnasnexus/pgac020 doi: 10.1093/pnasnexus/pgac020
|
| [7] |
L. D. Lotter, S. H. Kohl, C. Gerloff, L. Bell, A. Niephaus, J. A. Kruppa, et al., Revealing the neurobiology underlying interpersonal neural synchronization with multimodal data fusion, Neurosci. Biobehav. Rev., 146 (2023), 105042. https://doi.org/10.1016/j.neubiorev.2023.105042 doi: 10.1016/j.neubiorev.2023.105042
|
| [8] |
Y. Pan, G. Novembre, A. Olsson, The interpersonal neuroscience of social learning, Perspect. Psychol. Sci., 17 (2022), 680–695. https://doi.org/10.1177/17456916211008429 doi: 10.1177/17456916211008429
|
| [9] |
E. Redcay, L. Schilbach, Using second-person neuroscience to elucidate the mechanisms of social interaction, Nat. Rev. Neurosci., 20 (2019), 495–505. https://doi.org/10.1038/s41583-019-0179-4 doi: 10.1038/s41583-019-0179-4
|
| [10] |
L. Schilbach, B. Timmermans, V. Reddy, A. Costall, G. Bente, T. Schlicht, et al., Toward a second-person neuroscience, Behav. Brain Sci., 36 (2013), 393–414. https://doi.org/10.1017/s0140525x12000660 doi: 10.1017/s0140525x12000660
|
| [11] |
A. Czeszumski, S. H. Liang, S. Dikker, P. König, C. P. Lee, S. L. Koole, et al., Cooperative behavior evokes interbrain synchrony in the prefrontal and temporoparietal cortex: a systematic review and meta-analysis of fNIRS hyperscanning studies, eNeuro, 9 (2022), ENEURO.0268-21.2022. https://doi.org/10.1523/eneuro.0268-21.2022 doi: 10.1523/eneuro.0268-21.2022
|
| [12] |
S. Dikker, L. Wan, I. Davidesco, L. Kaggen, M. Oostrik, J. McClintock, et al., Brain-to-brain synchrony tracks real-world dynamic group interactions in the classroom, Curr. Biol., 27 (2017), 1375–1380. https://doi.org/10.1016/j.cub.2017.04.002 doi: 10.1016/j.cub.2017.04.002
|
| [13] |
D. A. Reinero, S. Dikker, J. J. Van Bavel, Inter-brain synchrony in teams predicts collective performance, Social Cognit. Affective Neurosci., 16 (2021), 43–57. https://doi.org/10.1093/scan/nsaa135 doi: 10.1093/scan/nsaa135
|
| [14] |
P. Fries, Rhythms for cognition: communication through coherence, Neuron, 88 (2015), 220–235. https://doi.org/10.1016/j.neuron.2015.09.034 doi: 10.1016/j.neuron.2015.09.034
|
| [15] |
M. Zee, H. M. Koomen, I. Van der Veen, Student-teacher relationship quality and academic adjustment in upper elementary school: the role of student personality, J. School Psychol., 51 (2013), 517–533. https://doi.org/10.1016/j.jsp.2013.05.003 doi: 10.1016/j.jsp.2013.05.003
|
| [16] | R. Mogan, R. Fischer, J. A. Bulbulia, To be in synchrony or not? A meta-analysis of synchrony's effects on behavior, perception, cognition and affect, J. Exp. Social Psychol., 72 (2017), 13–20. https://doi.org/https://doi.org/10.1016/j.jesp.2017.03.009 |
| [17] |
J. Liu, R. Zhang, B. Geng, T. Zhang, D. Yuan, S. Otani, et al., Interplay between prior knowledge and communication mode on teaching effectiveness: Interpersonal neural synchronization as a neural marker, Neuroimage, 193 (2019), 93–102. https://doi.org/10.1016/j.neuroimage.2019.03.004 doi: 10.1016/j.neuroimage.2019.03.004
|
| [18] |
Y. Pan, S. Dikker, P. Goldstein, Y. Zhu, C. Yang, Y. Hu, Instructor-learner brain coupling discriminates between instructional approaches and predicts learning, Neuroimage, 211 (2020), 116657. https://doi.org/10.1016/j.neuroimage.2020.116657 doi: 10.1016/j.neuroimage.2020.116657
|
| [19] |
K. Yun, K. Watanabe, S. Shimojo, Interpersonal body and neural synchronization as a marker of implicit social interaction, Sci. Rep., 2 (2012), 959. https://doi.org/10.1038/srep00959 doi: 10.1038/srep00959
|
| [20] |
J. Levy, A. Goldstein, R. Feldman, Perception of social synchrony induces mother-child gamma coupling in the social brain, Social Cognit. Affective Neurosci., 12 (2017), 1036–1046. https://doi.org/10.1093/scan/nsx032 doi: 10.1093/scan/nsx032
|
| [21] |
A. Stolk, M. L. Noordzij, L. Verhagen, I. Volman, J. M. Schoffelen, R. Oostenveld, et al., Cerebral coherence between communicators marks the emergence of meaning, Proc. Natl. Acad. Sci. U.S.A., 111 (2014), 18183–18188. https://doi.org/10.1073/pnas.1414886111 doi: 10.1073/pnas.1414886111
|
| [22] |
S. Kinreich, A. Djalovski, L. Kraus, Y. Louzoun, R. Feldman, Brain-to-brain synchrony during naturalistic social interactions, Sci. Rep., 7 (2017), 17060. https://doi.org/10.1038/s41598-017-17339-5 doi: 10.1038/s41598-017-17339-5
|
| [23] |
D. M. Ellingsen, A. Duggento, K. Isenburg, C. Jung, J. Lee, J. Gerber, et al., Patient-clinician brain concordance underlies causal dynamics in nonverbal communication and negative affective expressivity, Transl. Psychiatry, 12 (2022), 44. https://doi.org/10.1038/s41398-022-01810-7 doi: 10.1038/s41398-022-01810-7
|
| [24] |
M. Schurz, J. Radua, M. G. Tholen, L. Maliske, D. S. Margulies, R. B. Mars, et al., Toward a hierarchical model of social cognition: A neuroimaging meta-analysis and integrative review of empathy and theory of mind, Psychol. Bull., 147 (2021), 293–327. https://doi.org/10.1037/bul0000303 doi: 10.1037/bul0000303
|
| [25] |
L. Ficco, L. Mancuso, J. Manuello, A. Teneggi, D. Liloia, S. Duca, et al., Disentangling predictive processing in the brain: a meta-analytic study in favour of a predictive network, Sci. Rep., 11 (2021), 16258. https://doi.org/10.1038/s41598-021-95603-5 doi: 10.1038/s41598-021-95603-5
|
| [26] |
G. Rizzolatti, L. Cattaneo, M. Fabbri-Destro, S. Rozzi, Cortical mechanisms underlying the organization of goal-directed actions and mirror neuron-based action understanding, Physiol. Rev., 94 (2014), 655–706. https://doi.org/10.1152/physrev.00009.2013 doi: 10.1152/physrev.00009.2013
|
| [27] |
M. Arioli, N. Canessa, Neural processing of social interaction: Coordinate-based meta-analytic evidence from human neuroimaging studies, Hum. Brain Mapp., 40 (2019), 3712–3737. https://doi.org/10.1002/hbm.24627 doi: 10.1002/hbm.24627
|
| [28] |
K. Lehmann, D. Bolis, K. J. Friston, L. Schilbach, M. J. D. Ramstead, P. Kanske, An active-inference approach to second-person neuroscience, Perspect. Psychol. Sci., 2023 (2023), 17456916231188000. https://doi.org/10.1177/17456916231188000 doi: 10.1177/17456916231188000
|
| [29] | J. Barnby, G. Bellucci, N. Alon, L. Schilbach, V. Bell, C. Frith, et al., Beyond theory of mind: A formal framework for social inference and representation, PsyarXiv, 2023. https://doi.org/10.31234/osf.io/cmgu7 |
| [30] |
D. Wei, S. Tsheringla, J. C. McPartland, A. Allsop, Combinatorial approaches for treating neuropsychiatric social impairment, Philos. Trans. R. Soc. London, Ser. B, 377 (2022), 20210051. https://doi.org/10.1098/rstb.2021.0051 doi: 10.1098/rstb.2021.0051
|
| [31] |
T. Penton, C. Catmur, M. J. Banissy, G. Bird, V. Walsh, Non-invasive stimulation of the social brain: the methodological challenges, Social Cognit. Affective Neurosci., 17 (2022), 15–25. https://doi.org/10.1093/scan/nsaa102 doi: 10.1093/scan/nsaa102
|
| [32] |
H. K. Kim, D. M. Blumberger, J. Downar, Z. J. Daskalakis, Systematic review of biological markers of therapeutic repetitive transcranial magnetic stimulation in neurological and psychiatric disorders, Clin. Neurophysiol., 132 (2021), 429–448. https://doi.org/10.1016/j.clinph.2020.11.025 doi: 10.1016/j.clinph.2020.11.025
|
| [33] |
A. Czeszumski, S. Eustergerling, A. Lang, D. Menrath, M. Gerstenberger, S. Schuberth, et al., Hyperscanning: A valid method to study neural inter-brain underpinnings of social interaction, Front. Hum. Neurosci., 14 (2020), 39. https://doi.org/10.3389/fnhum.2020.00039 doi: 10.3389/fnhum.2020.00039
|
| [34] |
A. L. Valencia, T. Froese, What binds us? Inter-brain neural synchronization and its implications for theories of human consciousness, Neurosci. Conscious., 2020 (2020), niaa010. https://doi.org/10.1093/nc/niaa010 doi: 10.1093/nc/niaa010
|
| [35] |
U. Hakim, S. De Felice, P. Pinti, X. Zhang, J. A. Noah, Y. Ono, et al., Quantification of inter-brain coupling: A review of current methods used in haemodynamic and electrophysiological hyperscanning studies, Neuroimage, 280 (2023), 120354. https://doi.org/10.1016/j.neuroimage.2023.120354 doi: 10.1016/j.neuroimage.2023.120354
|
| [36] |
A. P. Burgess, On the interpretation of synchronization in EEG hyperscanning studies: a cautionary note, Front. Hum. Neurosci., 7 (2013), 881. https://doi.org/10.3389/fnhum.2013.00881 doi: 10.3389/fnhum.2013.00881
|
| [37] |
G. Dumas, J. Nadel, R. Soussignan, J. Martinerie, L. Garnero, Inter-brain synchronization during social interaction, PLoS One, 5 (2010), e12166. https://doi.org/10.1371/journal.pone.0012166 doi: 10.1371/journal.pone.0012166
|
| [38] |
K. Gugnowska, G. Novembre, N. Kohler, A. Villringer, P. E. Keller, D. Sammler, Endogenous sources of interbrain synchrony in duetting pianists, Cereb. Cortex, 32 (2022), 4110–4127. https://doi.org/10.1093/cercor/bhab469 doi: 10.1093/cercor/bhab469
|
| [39] |
W. Peng, W. Lou, X. Huang, Q. Ye, R. K. Tong, F. Cui, Suffer together, bond together: Brain-to-brain synchronization and mutual affective empathy when sharing painful experiences, Neuroimage, 238 (2021), 118249. https://doi.org/10.1016/j.neuroimage.2021.118249 doi: 10.1016/j.neuroimage.2021.118249
|
| [40] |
U. Lindenberger, S. C. Li, W. Gruber, V. Müller, Brains swinging in concert: cortical phase synchronization while playing guitar, BMC Neurosci., 10 (2009), 22. https://doi.org/10.1186/1471-2202-10-22 doi: 10.1186/1471-2202-10-22
|
| [41] |
V. Müller, U. Lindenberger, Probing associations between interbrain synchronization and interpersonal action coordination during guitar playing, Ann. N. Y. Acad. Sci., 1507 (2022), 146–161. https://doi.org/10.1111/nyas.14689 doi: 10.1111/nyas.14689
|
| [42] |
L. Astolfi, J. Toppi, A. Ciaramidaro, P. Vogel, C. M. Freitag, M. Siniatchkin, Raising the bar: Can dual scanning improve our understanding of joint action, Neuroimage, 216 (2020), 116813. https://doi.org/10.1016/j.neuroimage.2020.116813 doi: 10.1016/j.neuroimage.2020.116813
|
| [43] |
F. De Vico Fallani, V. Nicosia, R. Sinatra, L. Astolfi, F. Cincotti, D. Mattia, et al., Defecting or not defecting: how to "read" human behavior during cooperative games by EEG measurements, PLoS One, 5 (2010), e14187. https://doi.org/10.1371/journal.pone.0014187 doi: 10.1371/journal.pone.0014187
|
| [44] |
L. Astolfi, J. Toppi, F. De Vico Fallani, G. Vecchiato, S. Salinari, D. Mattia, et al., Neuroelectrical hyperscanning measures simultaneous brain activity in humans, Brain Topogr., 23 (2010), 243–256. https://doi.org/10.1007/s10548-010-0147-9 doi: 10.1007/s10548-010-0147-9
|
| [45] |
M. O. Abe, T. Koike, S. Okazaki, S. K. Sugawara, K. Takahashi, K. Watanabe, et al., Neural correlates of online cooperation during joint force production, Neuroimage, 191 (2019), 150–161. https://doi.org/10.1016/j.neuroimage.2019.02.003 doi: 10.1016/j.neuroimage.2019.02.003
|
| [46] |
L. Liu, Y. Zhang, Q. Zhou, D. D. Garrett, C. Lu, A. Chen, et al., Auditory-articulatory neural alignment between listener and speaker during verbal communication, Cereb. Cortex, 30 (2020), 942–951. https://doi.org/10.1093/cercor/bhz138 doi: 10.1093/cercor/bhz138
|
| [47] |
P. Goldstein, I. Weissman-Fogel, G. Dumas, S. G. Shamay-Tsoory, Brain-to-brain coupling during handholding is associated with pain reduction, Proc. Natl. Acad. Sci. U.S.A., 115 (2018), e2528–e2537. https://doi.org/10.1073/pnas.1703643115 doi: 10.1073/pnas.1703643115
|
| [48] |
I. Davidesco, E. Laurent, H. Valk, T. West, S. Dikker, C. Milne, et al., Brain-to-brain synchrony predicts long-term memory retention more accurately than individual brain measures, bioRxiv, (2019), 644047. https://doi.org/10.1101/644047 doi: 10.1101/644047
|
| [49] |
Y. Tang, X. Liu, C. Wang, M. Cao, S. Deng, X. Du, et al., Different strategies, distinguished cooperation efficiency, and brain synchronization for couples: An fNIRS-based hyperscanning study, Brain Behav., 10 (2020), e01768. https://doi.org/10.1002/brb3.1768 doi: 10.1002/brb3.1768
|
| [50] |
J. Jiang, C. Chen, B. Dai, G. Shi, G. Ding, L. Liu, et al., Leader emergence through interpersonal neural synchronization, Proc. Natl. Acad. Sci. U.S.A., 112 (2015), 4274–4279. https://doi.org/10.1073/pnas.1422930112 doi: 10.1073/pnas.1422930112
|
| [51] |
Q. Wang, Z. Han, X. Hu, S. Feng, H. Wang, T. Liu, et al., Autism symptoms modulate interpersonal neural synchronization in children with autism spectrum disorder in cooperative interactions, Brain Topogr., 33 (2020), 112–122. https://doi.org/10.1007/s10548-019-00731-x doi: 10.1007/s10548-019-00731-x
|
| [52] |
Y. Hu, Y. Hu, X. Li, Y. Pan, X. Cheng, Brain-to-brain synchronization across two persons predicts mutual prosociality, Social Cognit. Affective Neurosci., 12 (2017), 1835–1844. https://doi.org/10.1093/scan/nsx118 doi: 10.1093/scan/nsx118
|
| [53] |
U. Hasson, Y. Nir, I. Levy, G. Fuhrmann, R. Malach, Intersubject synchronization of cortical activity during natural vision, Science, 303 (2004), 1634–1640. https://doi.org/10.1126/science.1089506 doi: 10.1126/science.1089506
|
| [54] |
S. A. Nastase, V. Gazzola, U. Hasson, C. Keysers, Measuring shared responses across subjects using intersubject correlation, Social Cognit. Affective Neurosci., 14 (2019), 667–685. https://doi.org/10.1093/scan/nsz037 doi: 10.1093/scan/nsz037
|
| [55] |
E. Simony, C. J. Honey, J. Chen, O. Lositsky, Y. Yeshurun, A. Wiesel, et al., Dynamic reconfiguration of the default mode network during narrative comprehension, Nat. Commun., 7 (2016), 12141. https://doi.org/10.1038/ncomms12141 doi: 10.1038/ncomms12141
|
| [56] |
J. P. Lachaux, E. Rodriguez, J. Martinerie, F. J. Varela, Measuring phase synchrony in brain signals, Hum. Brain Mapp., 8 (1999), 194–208. https://doi.org/10.1002/(sici)1097-0193(1999)8:4<194::aid-hbm4>3.0.co;2-c doi: 10.1002/(sici)1097-0193(1999)8:4<194::aid-hbm4>3.0.co;2-c
|
| [57] |
A. F. C. Hamilton, Hyperscanning: Beyond the hype, Neuron, 109 (2021), 404–407. https://doi.org/10.1016/j.neuron.2020.11.008 doi: 10.1016/j.neuron.2020.11.008
|
| [58] |
A. Grinsted, J. C. Moore, S. Jevrejeva, Application of the cross wavelet transform and wavelet coherence to geophysical time series, Nonlin. Processes Geophys., 11 (2004), 561–566. https://doi.org/10.5194/npg-11-561-2004 doi: 10.5194/npg-11-561-2004
|
| [59] |
L. S. Wang, J. T. Cheng, I. J. Hsu, S. Liou, C. C. Kung, D. Y. Chen, et al., Distinct cerebral coherence in task-based fMRI hyperscanning: cooperation versus competition, Cereb. Cortex, 33 (2022), 421–433. https://doi.org/10.1093/cercor/bhac075 doi: 10.1093/cercor/bhac075
|
| [60] |
A. K. Seth, A. B. Barrett, L. Barnett, Granger causality analysis in neuroscience and neuroimaging, J. Neurosci., 35 (2015), 3293–3297. https://doi.org/10.1523/jneurosci.4399-14.2015 doi: 10.1523/jneurosci.4399-14.2015
|
| [61] |
M. B. Schippers, A. Roebroeck, R. Renken, L. Nanetti, C. Keysers, Mapping the information flow from one brain to another during gestural communication, Proc. Natl. Acad. Sci. U.S.A., 107 (2010), 9388–9393. https://doi.org/10.1073/pnas.1001791107 doi: 10.1073/pnas.1001791107
|
| [62] |
E. Bilek, P. Zeidman, P. Kirsch, H. Tost, A. Meyer-Lindenberg, K. Friston, Directed coupling in multi-brain networks underlies generalized synchrony during social exchange, Neuroimage, 252 (2022), 119038. https://doi.org/10.1016/j.neuroimage.2022.119038 doi: 10.1016/j.neuroimage.2022.119038
|
| [63] |
C. B. Holroyd, Interbrain synchrony: on wavy ground, Trends Neurosci., 45 (2022), 346–357. https://doi.org/10.1016/j.tins.2022.02.002 doi: 10.1016/j.tins.2022.02.002
|
| [64] |
Y. Pan, X. Cheng, Two-person approaches to studying social interaction in psychiatry: Uses and clinical relevance, Front. Psychiatry, 11 (2020), 301. https://doi.org/10.3389/fpsyt.2020.00301 doi: 10.3389/fpsyt.2020.00301
|
| [65] |
V. Leong, L. Schilbach, The promise of two-person neuroscience for developmental psychiatry: using interaction-based sociometrics to identify disorders of social interaction, Br. J. Psychiatry, 215 (2019), 636–638. https://doi.org/10.1192/bjp.2019.73 doi: 10.1192/bjp.2019.73
|
| [66] |
S. V. Wass, M. Whitehorn, I. Marriott Haresign, E. Phillips, V. Leong, Interpersonal neural entrainment during early social interaction, Trends Cognit. Sci., 24 (2020), 329–342. https://doi.org/10.1016/j.tics.2020.01.006 doi: 10.1016/j.tics.2020.01.006
|
| [67] |
Y. Pan, G. Novembre, B. Song, X. Li, Y. Hu, Interpersonal synchronization of inferior frontal cortices tracks social interactive learning of a song, Neuroimage, 183 (2018), 280–290. https://doi.org/10.1016/j.neuroimage.2018.08.005 doi: 10.1016/j.neuroimage.2018.08.005
|
| [68] |
F. T. Ramseyer, Motion energy analysis (MEA): A primer on the assessment of motion from video, J. Couns. Psychol., 67 (2020), 536–549. https://doi.org/10.1037/cou0000407 doi: 10.1037/cou0000407
|
| [69] |
Z. Cao, G. Hidalgo, T. Simon, S. E. Wei, Y. Sheikh, OpenPose: Realtime multi-person 2D pose estimation using part affinity fields, IEEE Trans. Pattern Anal. Mach. Intell., 43 (2021), 172–186. https://doi.org/10.1109/tpami.2019.2929257 doi: 10.1109/tpami.2019.2929257
|
| [70] |
S. Guglielmini, G. Bopp, V. L. Marcar, F. Scholkmann, M. Wolf, Systemic physiology augmented functional near-infrared spectroscopy hyperscanning: a first evaluation investigating entrainment of spontaneous activity of brain and body physiology between subjects, Neurophotonics, 9 (2022), 026601. https://doi.org/10.1117/1.NPh.9.2.026601 doi: 10.1117/1.NPh.9.2.026601
|
| [71] |
R. Cañigueral, S. Krishnan-Barman, A. F. C. Hamilton, Social signalling as a framework for second-person neuroscience, Psychon. Bull. Rev., 29 (2022), 2083–2095. https://doi.org/10.3758/s13423-022-02103-2 doi: 10.3758/s13423-022-02103-2
|
| [72] |
L. Kingsbury, S. Huang, J. Wang, K. Gu, P. Golshani, Y. E. Wu, et al., Correlated neural activity and encoding of behavior across brains of socially interacting animals, Cell, 178 (2019), 429–446.e416. https://doi.org/10.1016/j.cell.2019.05.022 doi: 10.1016/j.cell.2019.05.022
|
| [73] |
V. Müller, D. Perdikis, M. A. Mende, U. Lindenberger, Interacting brains coming in sync through their minds: an interbrain neurofeedback study, Ann. N. Y. Acad. Sci., 1500 (2021), 48–68. https://doi.org/10.1111/nyas.14605 doi: 10.1111/nyas.14605
|
| [74] |
L. Duan, W. J. Liu, R. N. Dai, R. Li, C. M. Lu, Y. X. Huang, et al., Cross-brain neurofeedback: scientific concept and experimental platform, PLoS One, 8 (2013), e64590. https://doi.org/10.1371/journal.pone.0064590 doi: 10.1371/journal.pone.0064590
|
| [75] |
S. Dikker, G. Michalareas, M. Oostrik, A. Serafimaki, H. M. Kahraman, M. E. Struiksma, et al., Crowdsourcing neuroscience: Inter-brain coupling during face-to-face interactions outside the laboratory, Neuroimage, 227 (2021), 117436. https://doi.org/10.1016/j.neuroimage.2020.117436 doi: 10.1016/j.neuroimage.2020.117436
|
| [76] |
M. Hallett, Transcranial magnetic stimulation and the human brain, Nature, 406 (2000), 147–150. https://doi.org/10.1038/35018000 doi: 10.1038/35018000
|
| [77] |
J. Vosskuhl, D. Struber, C. S. Herrmann, Non-invasive brain stimulation: A paradigm shift in understanding brain oscillations, Front. Hum. Neurosci., 12 (2018), 211. https://doi.org/10.3389/fnhum.2018.00211 doi: 10.3389/fnhum.2018.00211
|
| [78] |
A. Liu, M. Vöröslakos, G. Kronberg, S. Henin, M. R. Krause, Y. Huang, et al., Immediate neurophysiological effects of transcranial electrical stimulation, Nat. Commun., 9 (2018), 5092. https://doi.org/10.1038/s41467-018-07233-7 doi: 10.1038/s41467-018-07233-7
|
| [79] |
C. S. Herrmann, M. M. Murray, S. Ionta, A. Hutt, J. Lefebvre, Shaping intrinsic neural oscillations with periodic stimulation, J. Neurosci., 36 (2016), 5328–5337. https://doi.org/10.1523/jneurosci.0236-16.2016 doi: 10.1523/jneurosci.0236-16.2016
|
| [80] |
S. Alagapan, S. L. Schmidt, J. Lefebvre, E. Hadar, H. W. Shin, F. Frӧhlich, Modulation of cortical oscillations by low-frequency direct cortical stimulation is state-dependent, PloS Biol., 14 (2016), e1002424. https://doi.org/10.1371/journal.pbio.1002424 doi: 10.1371/journal.pbio.1002424
|
| [81] |
N. Takeuchi, Perspectives on rehabilitation using non-invasive brain stimulation based on second-person neuroscience of teaching-learning interactions, Front. Psychol., 12 (2022), 789637. https://doi.org/10.3389/fpsyg.2021.789637 doi: 10.3389/fpsyg.2021.789637
|
| [82] |
Y. Cabral-Calderin, M. Wilke, Probing the link between perception and oscillations: Lessons from transcranial alternating current stimulation, Neuroscientist, 26 (2020), 57–73. https://doi.org/10.1177/1073858419828646 doi: 10.1177/1073858419828646
|
| [83] |
V. Müller, U. Lindenberger, Hyper-brain networks support romantic kissing in humans, PloS One, 9 (2014), e112080. https://doi.org/10.1371/journal.pone.0112080 doi: 10.1371/journal.pone.0112080
|
| [84] |
J. Toppi, G. Borghini, M. Petti, E. J. He, V. De Giusti, B. He, et al., Investigating cooperative behavior in ecological settings: An EEG hyperscanning study, PloS One, 11 (2016), e0154236. https://doi.org/10.1371/journal.pone.0154236 doi: 10.1371/journal.pone.0154236
|
| [85] |
V. Leong, E. Byrne, K. Clackson, S. Georgieva, S. Lam, S. Wass, Speaker gaze increases information coupling between infant and adult brains, Proc. Natl. Acad. Sci. U.S.A., 114 (2017), 13290–13295. https://doi.org/10.1073/pnas.1702493114 doi: 10.1073/pnas.1702493114
|
| [86] |
Y. Mu, C. Guo, S. Han, Oxytocin enhances inter-brain synchrony during social coordination in male adults, Social Cognit. Affective Neurosci., 11 (2016), 1882–1893. https://doi.org/10.1093/scan/nsw106 doi: 10.1093/scan/nsw106
|
| [87] |
O. A. Heggli, I. Konvalinka, J. Cabral, E. Brattico, M. L. Kringelbach, P. Vuust, Transient brain networks underlying interpersonal strategies during synchronized action, Social Cognit. Affective Neurosci., 16 (2021), 19–30. https://doi.org/10.1093/scan/nsaa056 doi: 10.1093/scan/nsaa056
|
| [88] |
A. Pérez, M. Carreiras, J. A. Duñabeitia, Brain-to-brain entrainment: EEG interbrain synchronization while speaking and listening, Sci. Rep., 7 (2017), 4190. https://doi.org/10.1038/s41598-017-04464-4 doi: 10.1038/s41598-017-04464-4
|
| [89] |
J. Sünger, V. Müller, U. Lindenberger, Directionality in hyperbrain networks discriminates between leaders and followers in guitar duets, Front. Hum. Neurosci., 7 (2013), 234. https://doi.org/10.3389/fnhum.2013.00234 doi: 10.3389/fnhum.2013.00234
|
| [90] |
Y. Mu, S. Han, M. J. Gelfand, The role of gamma interbrain synchrony in social coordination when humans face territorial threats, Social Cognit. Affective Neurosci., 12 (2017), 1614–1623. https://doi.org/10.1093/scan/nsx093 doi: 10.1093/scan/nsx093
|
| [91] |
N. Kopell, G. B. Ermentrout, M. A. Whittington, R. D. Traub, Gamma rhythms and beta rhythms have different synchronization properties, Proc. Natl. Acad. Sci. U.S.A., 97 (2000), 1867–1872. https://doi.org/10.1073/pnas.97.4.1867 doi: 10.1073/pnas.97.4.1867
|
| [92] |
P. J. Uhlhaas, W. Singer, Neuronal dynamics and neuropsychiatric disorders: toward a translational paradigm for dysfunctional large-scale networks, Neuron, 75 (2012), 963–980. https://doi.org/10.1016/j.neuron.2012.09.004 doi: 10.1016/j.neuron.2012.09.004
|
| [93] |
K. J. Friston, T. Parr, Y. Yufik, N. Sajid, C. J. Price, E. Holmes, Generative models, linguistic communication and active inference, Neurosci. Biobehav. Rev., 118 (2020), 42–64. https://doi.org/10.1016/j.neubiorev.2020.07.005 doi: 10.1016/j.neubiorev.2020.07.005
|
| [94] |
E. Tognoli, J. A. Kelso, The coordination dynamics of social neuromarkers, Front. Hum. Neurosci., 9 (2015), 563. https://doi.org/10.3389/fnhum.2015.00563 doi: 10.3389/fnhum.2015.00563
|
| [95] |
C. Peylo, Y. Hilla, P. Sauseng, Cause or consequence? Alpha oscillations in visuospatial attention, Trends Neurosci., 44 (2021), 705–713. https://doi.org/10.1016/j.tins.2021.05.004 doi: 10.1016/j.tins.2021.05.004
|
| [96] |
W. Klimesch, α-band oscillations, attention, and controlled access to stored information, Trends Cognit. Sci., 16 (2012), 606–617. https://doi.org/10.1016/j.tics.2012.10.007 doi: 10.1016/j.tics.2012.10.007
|
| [97] |
S. Hoehl, M. Fairhurst, A. Schirmer, Interactional synchrony: signals, mechanisms and benefits, Social Cognit. Affective Neurosci., 16 (2021), 5–18. https://doi.org/10.1093/scan/nsaa024 doi: 10.1093/scan/nsaa024
|
| [98] |
N. J. Davis, S. P. Tomlinson, H. M. Morgan, The role of beta-frequency neural oscillations in motor control, J. Neurosci., 32 (2012), 403–404. https://doi.org/10.1523/jneurosci.5106-11.2012 doi: 10.1523/jneurosci.5106-11.2012
|
| [99] |
B. Pollok, D. Latz, V. Krause, M. Butz, A. Schnitzler, Changes of motor-cortical oscillations associated with motor learning, Neuroscience, 275 (2014), 47–53. https://doi.org/10.1016/j.neuroscience.2014.06.008 doi: 10.1016/j.neuroscience.2014.06.008
|
| [100] |
V. Müller, J. Sünger, U. Lindenberger, Intra- and inter-brain synchronization during musical improvisation on the guitar, PloS One, 8 (2013), e73852. https://doi.org/10.1371/journal.pone.0073852 doi: 10.1371/journal.pone.0073852
|
| [101] |
C. S. Herrmann, D. Strüber, R. F. Helfrich, A. K. Engel, EEG oscillations: From correlation to causality, Int. J. Psychophysiol., 103 (2016), 12–21. https://doi.org/10.1016/j.ijpsycho.2015.02.003 doi: 10.1016/j.ijpsycho.2015.02.003
|
| [102] |
S. H. Williams, D. Johnston, Kinetic properties of two anatomically distinct excitatory synapses in hippocampal CA3 pyramidal neurons, J. Neurophysiol., 66 (1991), 1010–1020. https://doi.org/10.1152/jn.1991.66.3.1010 doi: 10.1152/jn.1991.66.3.1010
|
| [103] |
G. Novembre, G. Knoblich, L. Dunne, P. E. Keller, Interpersonal synchrony enhanced through 20 Hz phase-coupled dual brain stimulation, Social Cognit. Affective Neurosci., 12 (2017), 662–670. https://doi.org/10.1093/scan/nsw172 doi: 10.1093/scan/nsw172
|
| [104] |
C. Szymanski, V. Müller, T. R. Brick, T. von Oertzen, U. Lindenberger, Hyper-transcranial alternating current stimulation: experimental manipulation of inter-brain synchrony, Front. Hum. Neurosci., 11 (2017), 539. https://doi.org/10.3389/fnhum.2017.00539 doi: 10.3389/fnhum.2017.00539
|
| [105] |
Y. Pan, G. Novembre, B. Song, Y. Zhu, Y. Hu, Dual brain stimulation enhances interpersonal learning through spontaneous movement synchrony, Social Cognit. Affective Neurosci., 16 (2021), 210–221. https://doi.org/10.1093/scan/nsaa080 doi: 10.1093/scan/nsaa080
|
| [106] |
R. T. Canolty, R. T. Knight, The functional role of cross-frequency coupling, Trends Cognit. Sci., 14 (2010), 506–515. https://doi.org/10.1016/j.tics.2010.09.001 doi: 10.1016/j.tics.2010.09.001
|
| [107] |
B. Asamoah, A. Khatoun, M. Mc Laughlin, tACS motor system effects can be caused by transcutaneous stimulation of peripheral nerves, Nat. Commun., 10 (2019), 266. https://doi.org/10.1038/s41467-018-08183-w doi: 10.1038/s41467-018-08183-w
|
| [108] |
G. Novembre, G. D. Iannetti, Hyperscanning alone cannot prove causality. Multibrain stimulation can, Trends Cognit. Sci., 25 (2021), 96–99. https://doi.org/10.1016/j.tics.2020.11.003 doi: 10.1016/j.tics.2020.11.003
|
| [109] |
S. L. Koole, W. Tschacher, Synchrony in psychotherapy: A review and an integrative framework for the therapeutic alliance, Front. Psychol., 7 (2016), 862. https://doi.org/10.3389/fpsyg.2016.00862 doi: 10.3389/fpsyg.2016.00862
|
| [110] |
M. Bishop, N. Kayes, K. McPherson, Understanding the therapeutic alliance in stroke rehabilitation, Disability Rehabil., 43 (2021), 1074–1083. https://doi.org/10.1080/09638288.2019.1651909 doi: 10.1080/09638288.2019.1651909
|
| [111] |
P. Søndenå, G. Dalusio-King, C. Hebron, Conceptualisation of the therapeutic alliance in physiotherapy: is it adequate, Musculoskeletal Sci. Pract., 46 (2020), 102131. https://doi.org/10.1016/j.msksp.2020.102131 doi: 10.1016/j.msksp.2020.102131
|
| [112] |
P. Mistiaen, M. van Osch, L. van Vliet, J. Howick, F. L. Bishop, Z. Di Blasi, et al., The effect of patient-practitioner communication on pain: a systematic review, Eur. J. Pain, 20 (2016), 675–688. https://doi.org/10.1002/ejp.797 doi: 10.1002/ejp.797
|
| [113] |
L. Schilbach, Towards a second-person neuropsychiatry, Philos. Trans. R. Soc. London, Ser. B, 371 (2016), 20150081. https://doi.org/10.1098/rstb.2015.0081 doi: 10.1098/rstb.2015.0081
|
| [114] | L. Schilbach, J. M. Lahnakoski, Clinical neuroscience meets second-person neuropsychiatry, in Social and Affective Neuroscience of Everyday Human Interaction: From Theory to Methodology, Cham (CH): Springer, (2023), 177–191. |
| [115] |
L. E. Quiñones-Camacho, F. A. Fishburn, K. Belardi, D. L. Williams, T. J. Huppert, S. B. Perlman, Dysfunction in interpersonal neural synchronization as a mechanism for social impairment in autism spectrum disorder, Autism Res., 14 (2021), 1585–1596. https://doi.org/10.1002/aur.2513 doi: 10.1002/aur.2513
|
| [116] |
E. Bilek, G. Stößel, A. Schüfer, L. Clement, M. Ruf, L. Robnik, et al., State-dependent cross-brain information flow in borderline personality disorder, JAMA Psychiatry, 74 (2017), 949–957. https://doi.org/10.1001/jamapsychiatry.2017.1682 doi: 10.1001/jamapsychiatry.2017.1682
|
| [117] |
Y. Zhang, T. Meng, Y. Hou, Y. Pan, Y. Hu, Interpersonal brain synchronization associated with working alliance during psychological counseling. Psychiatry Res. Neuroimaging, 282 (2018), 103–109. https://doi.org/10.1016/j.pscychresns.2018.09.007 doi: 10.1016/j.pscychresns.2018.09.007
|
| [118] |
N. Takeuchi, T. Mori, Y. Suzukamo, S. I. Izumi, Integration of teaching processes and learning assessment in the prefrontal cortex during a video game teaching-learning task, Front. Psychol., 7 (2017), 2052. https://doi.org/10.3389/fpsyg.2016.02052 doi: 10.3389/fpsyg.2016.02052
|
| [119] |
L. Zheng, C. Chen, W. Liu, Y. Long, H. Zhao, X. Bai, et al., Enhancement of teaching outcome through neural prediction of the students' knowledge state, Hum. Brain Mapp., 39 (2018), 3046–3057. https://doi.org/10.1002/hbm.24059 doi: 10.1002/hbm.24059
|
| [120] |
L. Zhang, X. Xu, Z. Li, L. Chen, L. Feng, Interpersonal neural synchronization predicting learning outcomes from teaching-learning interaction: A Meta-analysis, Front. Psychol., 13 (2022), 835147. https://doi.org/10.3389/fpsyg.2022.835147 doi: 10.3389/fpsyg.2022.835147
|
| [121] |
S. M. Fleming, R. J. Dolan, The neural basis of metacognitive ability, Philos. Trans. R. Soc. London, Ser. B, 367 (2012), 1338–1349. https://doi.org/10.1098/rstb.2011.0417 doi: 10.1098/rstb.2011.0417
|
| [122] |
A. G. Vaccaro, S. M. Fleming, Thinking about thinking: A coordinate-based meta-analysis of neuroimaging studies of metacognitive judgements, Brain Neurosci. Adv., 2 (2018), 2398212818810591. https://doi.org/10.1177/2398212818810591 doi: 10.1177/2398212818810591
|
| [123] |
J. F. Martín-Rodríguez, J. León-Carrión, Theory of mind deficits in patients with acquired brain injury: a quantitative review, Neuropsychologia, 48 (2010), 1181–1191. https://doi.org/10.1016/j.neuropsychologia.2010.02.009 doi: 10.1016/j.neuropsychologia.2010.02.009
|
| [124] |
M. Al Banna, N. A. Redha, F. Abdulla, B. Nair, C. Donnellan, Metacognitive function poststroke: a review of definition and assessment, J. Neurol. Neurosurg. Psychiatry, 87 (2016), 161–166. https://doi.org/10.1136/jnnp-2015-310305 doi: 10.1136/jnnp-2015-310305
|
| [125] |
B. Nijsse, J. M. Spikman, J. M. A. Visser-Meily, P. L. M. de Kort, C. M. van Heugten, Social cognition impairments are associated with behavioural changes in the long term after stroke, PloS One, 14 (2019), e0213725. https://doi.org/10.1371/journal.pone.0213725 doi: 10.1371/journal.pone.0213725
|
| [126] |
Y. X. Yeo, C. F. Pestell, R. S. Bucks, F. Allanson, M. Weinborn, Metacognitive knowledge and functional outcomes in adults with acquired brain injury: A meta-analysis, Neuropsychol. Rehabil., 31 (2021), 453–478. https://doi.org/10.1080/09602011.2019.1704421 doi: 10.1080/09602011.2019.1704421
|
| [127] |
P. Lakatos, J. Gross, G. Thut, A new unifying account of the roles of neuronal entrainment, Curr. Biol., 29 (2019), R890–R905. https://doi.org/10.1016/j.cub.2019.07.075 doi: 10.1016/j.cub.2019.07.075
|
| [128] |
K. B. Jensen, P. Petrovic, C. E. Kerr, I. Kirsch, J. Raicek, A. Cheetham, et al., Sharing pain and relief: neural correlates of physicians during treatment of patients, Mol. Psychiatry, 19 (2014), 392–398. https://doi.org/10.1038/mp.2012.195 doi: 10.1038/mp.2012.195
|
| [129] |
S. G. Shamay-Tsoory, N. I. Eisenberger, Getting in touch: A neural model of comforting touch, Neurosci. Biobehav. Rev., 130 (2021), 263–273. https://doi.org/10.1016/j.neubiorev.2021.08.030 doi: 10.1016/j.neubiorev.2021.08.030
|
| [130] |
B. M. Fitzgibbon, M. J. Giummarra, N. Georgiou-Karistianis, P. G. Enticott, J. L. Bradshaw, Shared pain: from empathy to synaesthesia, Neurosci. Biobehav. Rev., 34 (2010), 500–512. https://doi.org/10.1016/j.neubiorev.2009.10.007 doi: 10.1016/j.neubiorev.2009.10.007
|
| [131] |
D. M. Ellingsen, K. Isenburg, C. Jung, J. Lee, J. Gerber, I. Mawla, et al., Dynamic brain-to-brain concordance and behavioral mirroring as a mechanism of the patient-clinician interaction, Sci. Adv., 6 (2020), eabc1304. https://doi.org/10.1126/sciadv.abc1304 doi: 10.1126/sciadv.abc1304
|
| [132] |
T. J. Kaptchuk, F. G. Miller, Placebo effects in medicine, N. Engl. J. Med., 373 (2015), 8–9. https://doi.org/10.1056/NEJMp1504023 doi: 10.1056/NEJMp1504023
|
| [133] |
M. Ienca, R. W. Kressig, F. Jotterand, B. Elger, Proactive ethical design for neuroengineering, assistive and rehabilitation technologies: the cybathlon lesson, J. Neuroeng. Rehabil., 14 (2017), 115. https://doi.org/10.1186/s12984-017-0325-z doi: 10.1186/s12984-017-0325-z
|
| [134] |
R. Cohen Kadosh, N. Levy, J. O'Shea, N. Shea, J. Savulescu, The neuroethics of non-invasive brain stimulation, Curr. Biol., 22 (2012), R108–111. https://doi.org/10.1016/j.cub.2012.01.013 doi: 10.1016/j.cub.2012.01.013
|
| [135] |
S. G. Shamay-Tsoory, Brains that fire together wire together: Interbrain plasticity underlies learning in social interactions, Neuroscientist, 28 (2022), 543–551. https://doi.org/10.1177/1073858421996682 doi: 10.1177/1073858421996682
|
| [136] |
A. Gramfort, M. Luessi, E. Larson, D. A. Engemann, D. Strohmeier, C. Brodbeck, et al., MNE software for processing MEG and EEG data, Neuroimage, 86 (2014), 446–460. https://doi.org/10.1016/j.neuroimage.2013.10.027 doi: 10.1016/j.neuroimage.2013.10.027
|
| [137] |
R. D. Pascual-Marqui, C. M. Michel, D. Lehmann, Low resolution electromagnetic tomography: a new method for localizing electrical activity in the brain, Int. J. Psychophysiol., 18 (1994), 49–65. https://doi.org/10.1016/0167-8760(84)90014-x doi: 10.1016/0167-8760(84)90014-x
|
| [138] |
J. Onton, M. Westerfield, J. Townsend, S. Makeig, Imaging human EEG dynamics using independent component analysis, Neurosci. Biobehav. Rev., 30 (2006), 808–822. https://doi.org/10.1016/j.neubiorev.2006.06.007 doi: 10.1016/j.neubiorev.2006.06.007
|
| [139] |
C. S. Nam, Z. Traylor, M. Chen, X. Jiang, W. Feng, P. Y. Chhatbar, Direct communication between brains: A systematic PRISMA review of brain-to-brain interface, Front. Neurorobot., 15 (2021), 656943. https://doi.org/10.3389/fnbot.2021.656943 doi: 10.3389/fnbot.2021.656943
|
| [140] |
G. Thut, T. O. Bergmann, F. Fröhlich, S. R. Soekadar, J. S. Brittain, A. Valero-Cabré, et al., Guiding transcranial brain stimulation by EEG/MEG to interact with ongoing brain activity and associated functions: A position paper, Clin. Neurophysiol., 128 (2017), 843–857. https://doi.org/10.1016/j.clinph.2017.01.003 doi: 10.1016/j.clinph.2017.01.003
|
| [141] |
S. Kohli, A. J. Casson, Removal of gross artifacts of transcranial alternating current stimulation in simultaneous EEG monitoring, Sensors (Basel), 19 (2019), 190. https://doi.org/10.3390/s19010190 doi: 10.3390/s19010190
|
| [142] |
D. Bolis, J. Balsters, N. Wenderoth, C. Becchio, L. Schilbach, Beyond autism: introducing the dialectical misattunement hypothesis and a Bayesian account of intersubjectivity, Psychopathology, 50 (2017), 355–372. https://doi.org/10.1159/000484353 doi: 10.1159/000484353
|
| [143] |
G. Zarubin, C. Gundlach, V. Nikulin, A. Villringer, M. Bogdan, Transient amplitude modulation of alpha-band oscillations by short-time intermittent closed-loop tACS, Front. Hum. Neurosci., 14 (2020), 366. https://doi.org/10.3389/fnhum.2020.00366 doi: 10.3389/fnhum.2020.00366
|
Figures(1) / Tables(1)

Naoyuki Takeuchi. A dual-brain therapeutic approach using noninvasive brain stimulation based on two-person neuroscience: A perspective review[J]. Mathematical Biosciences and Engineering, 2024, 21(4): 5118-5137. doi: 10.3934/mbe.2024226


 DownLoad: