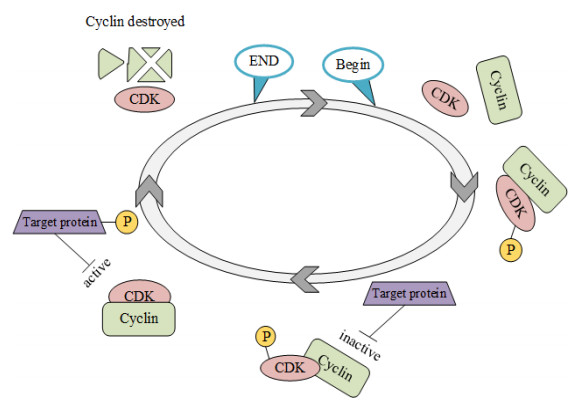
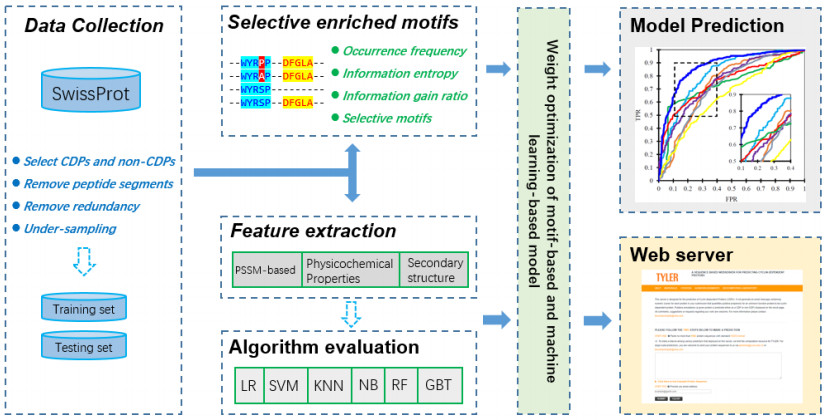
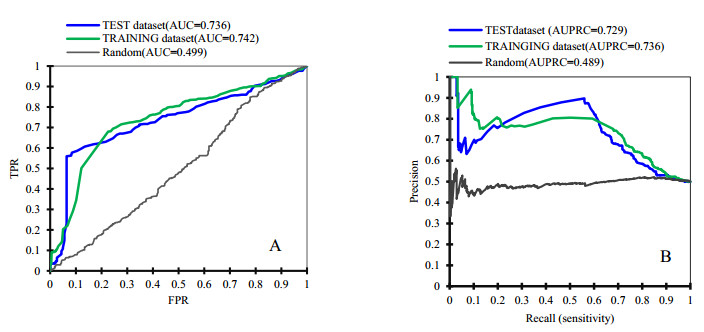
Cyclins and related cyclin-dependent kinases play vital roles in regulating the progression in the cell cycle. Understanding the intrinsic mechanisms of cyclins promises knowledge about cell uncontrolled proliferation and prevention of cancer cells. Therefore, accurate recognition of cyclins is important for the investigation of tumor cells and biomedical engineering. This study proposes a novel sequence-based predictor named TYLER (predicT cYcLin-dEpendent pRoteins) for addressing the long challenge problem of predicting cyclin-dependent proteins (CDPs). We use information theory to compute selectively enriched CDP-related motifs and build the motif-based model. For those proteins without sharing enriched motifs, we compute sequence-derived features and construct machine learning-based models. We optimize the weights of two different models to build a more accurate predictor. We estimate these two types of models by using 5-fold cross-validations on the TRAINING dataset. We prove that the combination of two models and optimization of the corresponding weights promises decent and robust results on both TRAINING and independent TEST dataset. The empirical test demonstrates that TYLER is robust predictor and statistically significantly better than current methods. The runtime assessment reveals TYLER is a high-throughput effective method. We use TYLER to make predictions on the human proteome, and use the results to hypothesize CDPs. The latest experimental verified CDPs and GO analysis proves that some of our novel predictions shall be potential CDPs. TYLER is implemented as a public user-friendly web server at http://www.inforstation.com/webservers/TYLER/. We share all data and source code that used in this research at https://github.com/biocomputinglab/TYLER.git.
Citation: Jian Zhang, Xingchen Liang, Feng Zhou, Bo Li, Yanling Li. TYLER, a fast method that accurately predicts cyclin-dependent proteins by using computation-based motifs and sequence-derived features[J]. Mathematical Biosciences and Engineering, 2021, 18(5): 6410-6429. doi: 10.3934/mbe.2021318
Cyclins and related cyclin-dependent kinases play vital roles in regulating the progression in the cell cycle. Understanding the intrinsic mechanisms of cyclins promises knowledge about cell uncontrolled proliferation and prevention of cancer cells. Therefore, accurate recognition of cyclins is important for the investigation of tumor cells and biomedical engineering. This study proposes a novel sequence-based predictor named TYLER (predicT cYcLin-dEpendent pRoteins) for addressing the long challenge problem of predicting cyclin-dependent proteins (CDPs). We use information theory to compute selectively enriched CDP-related motifs and build the motif-based model. For those proteins without sharing enriched motifs, we compute sequence-derived features and construct machine learning-based models. We optimize the weights of two different models to build a more accurate predictor. We estimate these two types of models by using 5-fold cross-validations on the TRAINING dataset. We prove that the combination of two models and optimization of the corresponding weights promises decent and robust results on both TRAINING and independent TEST dataset. The empirical test demonstrates that TYLER is robust predictor and statistically significantly better than current methods. The runtime assessment reveals TYLER is a high-throughput effective method. We use TYLER to make predictions on the human proteome, and use the results to hypothesize CDPs. The latest experimental verified CDPs and GO analysis proves that some of our novel predictions shall be potential CDPs. TYLER is implemented as a public user-friendly web server at http://www.inforstation.com/webservers/TYLER/. We share all data and source code that used in this research at https://github.com/biocomputinglab/TYLER.git.

| [1] | S. Lim, P. Kaldis, Cdks, cyclins and CKIs: roles beyond cell cycle regulation, Development, 140 (2013), 3079-3093. |
| [2] |
M. C. Horne, G. L. Goolsby, K. L. Donaldson, D. Tran, M. Neubauer, A. F. Wahl, Cyclin G1 and cyclin G2 comprise a new family of cyclins with contrasting tissue-specific and cell cycle-regulated expression, J. Biol. Chem., 271 (1996), 6050-6061. doi: 10.1074/jbc.271.11.6050

|
| [3] | D. Fisher, Control of DNA replication by cyclin-dependent kinases in development, Results Probl. Cell Differ., 53 (2011), 201-217. |
| [4] |
N. Bouftas, K. Wassmann, Cycling through mammalian meiosis: B-type cyclins in oocytes, Cell Cycle, 18 (2019), 1537-1548. doi: 10.1080/15384101.2019.1632139
|
| [5] |
G. Zheng, H. Yu, Cyclin a turns on bora to light the path to mitosis, Dev. Cell, 45 (2018), 542-543. doi: 10.1016/j.devcel.2018.05.017
|
| [6] |
A. W. Murray, Recycling the cell cycle: cyclins revisited, Cell, 116 (2004), 221-234. doi: 10.1016/S0092-8674(03)01080-8
|
| [7] |
D. W. Stacey, Cyclin D1 serves as a cell cycle regulatory switch in actively proliferating cells, Curr. Opin. Cell Biol., 15 (2003), 158-163. doi: 10.1016/S0955-0674(03)00008-5
|
| [8] | D. J. Wood, J. A. Endicott, Structural insights into the functional diversity of the CDK-cyclin family, Open Biol., 8 (2018), 180112. |
| [9] | M. Örd, K. Möll, A. Agerova, R. Kivi, I. Faustova, R. Venta, et al., Multisite phosphorylation code of CDK, Nat. Struct. Mol. Biol., 26 (2019), 649-658. |
| [10] | P. Gutiérrez-Escribano, P. Nurse, A single cyclin-CDK complex is sufficient for both mitotic and meiotic progression in fission yeast, Nat. Commun., 6 (2015), 1-13. |
| [11] | C. Gérard, A. Goldbeter, From quiescence to proliferation: Cdk oscillations drive the mammalian cell cycle, Front. Physiol., 3 (2012), 413. |
| [12] | G. Bertoni, Cell cycle regulation by chlamydomonas cyclin-dependent protein kinases, Plant Cell, 30 (2018), 271. |
| [13] | M. Stamatakos, V. Palla, I. Karaiskos, K. Xiromeritis, I. Alexiou, I. Pateras, et al., Cell cyclins: triggering elements of cancer or not?, World J. Surg. Oncol., 8 (2010), 111. |
| [14] | L. C. Leal-Esteban, L. Fajas, Cell cycle regulators in cancer cell metabolism, Biochem. Biophys. Acta, Mol. Basis Dis., 1866 (2020), 165715. |
| [15] |
E. A. Musgrove, C. E. Caldon, J. Barraclough, A. Stone, R. L. Sutherland, Cyclin D as a therapeutic target in cancer, Nat. Rev. Cancer, 11 (2011), 558-572. doi: 10.1038/nrc3090
|
| [16] | Y. Geng, W. Michowski, J. M. Chick, Y. E. Wang, M. E. Jecrois, K. E. Sweeney, et al., Kinase-independent function of E-type cyclins in liver cancer, Proc. Nat. Acad. Sci. U. S. A., 115 (2018), 1015-1020. |
| [17] | R. V. Dross, P. J. Browning, J. C. Pelling, Do truncated cyclins contribute to aberrant cyclin expression in cancer?, Cell Cycle, 5 (2006): 472-477. |
| [18] | C. Sanchez-Martinez, L. M. Gelbert, M. J. Lallena, A. de Dios, Cyclin dependent kinase (CDK) inhibitors as anticancer drugs, Bioorg. Med. Chem. Lett., 25 (2015), 3420-3435. |
| [19] | W. Rozpędek, D. Pytel, A. Nowak-Zduńczyk, D. Lewko, R. Wojtczak, J. A. Diehl, et al., Breaking the DNA damage response via serine/threonine kinase inhibitors to improve cancer treatment. Curr. Med. Chem., 26 (2019), 1425-1445. |
| [20] | J. A. Diehl, Cycling to cancer with cyclin D1, Cancer Biol. Ther., 1 (2002), 226-231. |
| [21] |
J. K. Kim, J. A. Diehl, Nuclear cyclin D1: an oncogenic driver in human cancer, J. Cell Physiol., 220 (2009), 292-296. doi: 10.1002/jcp.21791
|
| [22] | M. K. Kalita, U. K. Nandal, A. Pattnaik, A. Sivalingam, G. Ramasamy, M. Kumar, CyclinPred: a SVM-based method for predicting cyclin protein sequences, PLoS One, 3 (2008), e2605. |
| [23] | H. Mohabatkar, Prediction of cyclin proteins using Chou's pseudo amino acid composition. Protein Pept. Lett., 17 (2010), 1207-1214. |
| [24] | Saxena, K. Pant, B. Pant, N. Adlakha, Hybrid based SVM model for prediction of CDKs and cyclins, in 2010 The 2nd International Conference on Computer and Automation Engineering (ICCAE), 5 (2010), 504-508. |
| [25] | J. Ramana, D. Gupta, Machine learning methods for prediction of CDK-inhibitors, Plos One, 5 (2010), e13357. |
| [26] |
P. Loyer, J. H. Trembley, Roles of CDK/Cyclin complexes in transcription and pre-mRNA splicing: Cyclins L and CDK11 at the cross-roads of cell cycle and regulation of gene expression, Semin. Cell Dev. Biol., 107 (2020), 36-45. doi: 10.1016/j.semcdb.2020.04.016
|
| [27] |
S. Bandyopadhyay, S. Bhaduri, M. Örd, N. E. Davey, M. Loog, P. M. Pryciak, Comprehensive analysis of G1 cyclin docking motif sequences that control CDK regulatory potency in vivo, Curr. Biol., 30 (2020), 4454-4466. doi: 10.1016/j.cub.2020.08.099
|
| [28] |
D. Y. Takeda, J. A. Wohlschlegel, A. Dutta, A bipartite substrate recognition motif for cyclin-dependent kinases, J. Biol. Chem., 276 (2001), 1993-1997. doi: 10.1074/jbc.M005719200
|
| [29] |
J. A. Wohlschlegel, B. T. Dwyer, D. Y. Takeda, A. Dutta, Mutational analysis of the Cy motif from p21 reveals sequence degeneracy and specificity for different cyclin-dependent kinases, Mol. Cell. Biol., 21 (2001), 4868-4874. doi: 10.1128/MCB.21.15.4868-4874.2001
|
| [30] | C. S. Gelais, S. H. Kim, V. V. Maksimova, O. Buzovetsky, K. M. Knecht, C. Shepard, et al., A cyclin-binding motif in human SAMHD1 is required for its HIV-1 restriction, dNTPase activity, tetramer formation, and efficient phosphorylation, J. Virol., 92 (2018), e01787-17. |
| [31] | D. J. Wood, J. A. Endicott, Structural insights into the functional diversity of the CDK-cyclin family, Open Biol., 8 (2018), 180112. |
| [32] | M. W. Landis, N. E. Brown, G. L. Baker, A. Shifrin, M. Das, Y. Geng, et al., The LxCxE pRb interaction domain of cyclin D1 is dispensable for murine development, Cancer Res., 67 (2007), 7613-7620. |
| [33] |
I. Quilis, J. C. Igual, A comparative study of the degradation of yeast cyclins Cln1 and Cln2, FEBS Open Bio., 7 (2017), 74-87. doi: 10.1002/2211-5463.12157
|
| [34] | M. Wei, Q. He, Z. Yang, Z. Wang, Q. Zhang, B. Liu, et al., Integrity of the LXXLL motif in Stat6 is required for the inhibition of breast cancer cell growth and enhancement of differentiation in the context of progesterone, BMC Cancer, 14 (2014), 1-17. |
| [35] | A. Bateman, UniProt: a worldwide hub of protein knowledge, Nucleic Acids Res., 47 (2019), D506-d515. |
| [36] | S. F. Altschul, T. L. Madden, A. A. Schäffer, J. Zhang, Z. Zhang, W. Miller, et al., Gapped BLAST and PSI-BLAST: a new generation of protein database search programs, Nucleic Acids Res., 25 (1997), 3389-3402. |
| [37] |
C. E. Grant, T. L. Bailey, W. S. Noble, FIMO: scanning for occurrences of a given motif, Bioinformatics, 27 (2011), 1017-1018. doi: 10.1093/bioinformatics/btr064
|
| [38] | M. U. Johansson, V. Zoete, O. Michielin, N. Guex, Defining and searching for structural motifs using DeepView/Swiss-PdbViewer, BMC Bioinf., 13 (2012), 1-11. |
| [39] | J. Zhang, H. Chai, G. Yang, Z. Ma, Prediction of bioluminescent proteins by using sequence-derived features and lineage-specific scheme, BMC Bioinf., 18 (2017), 1-13. |
| [40] |
H. Chai, J. Zhang, Identification of mammalian enzymatic proteins based on sequence-derived features and species-specific scheme, IEEE Access, 6 (2018), 8452-8458. doi: 10.1109/ACCESS.2018.2798284
|
| [41] | J. Zhang, H. Chai, S. Guo, H. Guo, Y. Li, High-throughput identification of mammalian secreted proteins using species-specific scheme and application to human proteome, Molecular, 23 (2018), 1448. |
| [42] | J. Zhang, Y. Zhang, Z. Ma, In-silico prediction of human secretory proteins in plasma based on discrete firefly optimization and application to Cancer biomarkers identification, Front. Genet., 10 (2019), 542. |
| [43] |
K. V. Gunbin, V. V. Suslov, I. I. Turnaev, D. A. Afonnikov, N. A. Kolchanov, Molecular evolution of cyclin proteins in animals and fungi, BMC Evol. Biol., 11 (2011), 1-20. doi: 10.1186/1471-2148-11-1
|
| [44] |
J. Zhang, Y. Zhang, Y. Li, S. Guo, G. Yang, Identification of cancer biomarkers in human body fluids by using enhanced physicochemical-incorporated evolutionary conservation scheme, Curr. Trends Med. Chem., 20 (2020), 1888-1897. doi: 10.2174/1568026620666200710100743
|
| [45] | X. Zhao, J. Zhang, Q. Ning, P. Sun, Z. Ma, M. Yin, Identification of protein pupylation sites using bi-profile Bayes feature extraction and ensemble learning, Math. Probl. Eng., 2013 (2013). |
| [46] |
H. Chai, J. Zhang, G. Yang, Z. Ma, An evolution-based DNA-binding residue predictor using a dynamic query-driven learning scheme, Mol. BioSyst., 12 (2016), 3643-3650. doi: 10.1039/C6MB00626D
|
| [47] |
M. Hauser, M. Steinegger, J. Söding, MMseqs software suite for fast and deep clustering and searching of large protein sequence sets, Bioinformatics, 32 (2016), 1323-1330. doi: 10.1093/bioinformatics/btw006
|
| [48] |
L. Khalatbari, M. R. Kangavari, S. Hosseini, H. Yin, N. M. Cheung, MCP: a multi-component learning machine to predict protein secondary structure, Comput. Biol. Med., 110 (2019), 144-155. doi: 10.1016/j.compbiomed.2019.04.040
|
| [49] | M. Malumbres, Cyclin-dependent kinases, Genome Biol., 15 (2014), 1-10. |
| [50] | C. Ratineau, M. W. Petry, H. Mutoh, A. B. Leiter, Cyclin D1 represses the basic helix-loop-helix transcription factor, BETA2/NeuroD, J. Biol. Chem., 277 (2002), 8847-8853. |
| [51] | U. K. Bhawal, F. Sato, Y. Arakawa, K. Fujimoto, T. Kawamoto, K. Tanimoto, et al., Basic helix‐loop‐helix transcription factor DEC1 negatively regulates cyclin D1, J. Pathol., 224 (2011), 420-429. |
| [52] | A. N. Pettitt, A two-sample Anderson-Darling rank statistic, Biometrika, 63 (1976), 161-168. |
| [53] | S. Siegel, Nonparametric statistics, Am. Stat., 11 (1957), 13-19. |
| [54] | J. Zhang, L. Kurgan, SCRIBER: accurate and partner type-specific prediction of protein-binding residues from proteins sequences, Bioinformatics, 35 (2019), i343-i353. |
| [55] | J. Zhang, Z. Ma, L. Kurgan, Comprehensive review and empirical analysis of hallmarks of DNA-, RNA-and protein-binding residues in protein chains, Briefings Bioinf., 20 (2019), 1250-1268. |
| [56] |
G. Beliakov, G. Li, Improving the speed and stability of the k-nearest neighbors method, Pattern Recognit. Lett., 33 (2012), 1296-1301. doi: 10.1016/j.patrec.2012.02.016
|
| [57] | D. A. Pisner, D. M. Schnyer, Support vector machine, in Machine Learning, (2020), 101-121. |
| [58] | T. Calders, S. Verwer, Three naive bayes approaches for discrimination-free classification, in Data Mining and Knowledge Discovery, 21 (2010), 277-292. |
| [59] | A. L. Boulesteix, S. Janitza, J. Kruppa, I. R. König, Overview of random forest methodology and practical guidance with emphasis on computational biology and bioinformatics, in Wiley Interdisciplinary Reviews: Data Mining and Knowledge Discovery, 2 (2012), 493-507. |
| [60] | Y. Zhang, X. Zhang, A. N. Lane, T. W. M. Fan, J. Liu, Inferring gene regulatory networks of metabolic enzymes using gradient boosted trees, in IEEE journal of biomedical and health informatics, 24 (2019), 1528-1536. |
| [61] | B. Jassal, L. Matthews, G. Viteri, C. Gong, P. Lorente, A. Fabregat, et al., The reactome pathway knowledgebase, Nucleic Acids Res., 48 (2020), D498-D503. |
| [62] | J. Mistry, S. Chuguransky, L. Williams, M. Qureshi, G. A.Salazar, E. L.Sonnhammer, et al., Pfam: The protein families database in 2021, Nucleic Acids Res., 49 (2021), D412-D419. |
| [63] | H. Mi, D. Ebert, A. Muruganujan, C. Mills, L. P. Albou, T. Mushayamaha, et al., PANTHER version 16: a revised family classification, tree-based classification tool, enhancer regions and extensive API, Nucleic Acids Res., 49 (2021), D394-D403. |
 mbe-18-05-318-supplementary.pdf mbe-18-05-318-supplementary.pdf |
 |
Figures(7) / Tables(6)

Jian Zhang, Xingchen Liang, Feng Zhou, Bo Li, Yanling Li. TYLER, a fast method that accurately predicts cyclin-dependent proteins by using computation-based motifs and sequence-derived features[J]. Mathematical Biosciences and Engineering, 2021, 18(5): 6410-6429. doi: 10.3934/mbe.2021318


 DownLoad: