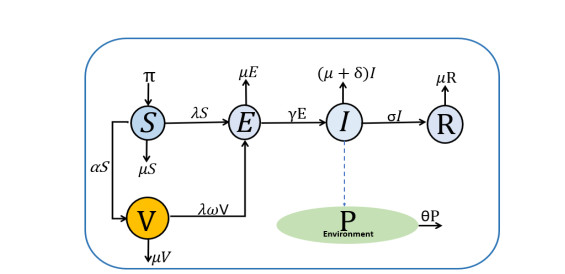
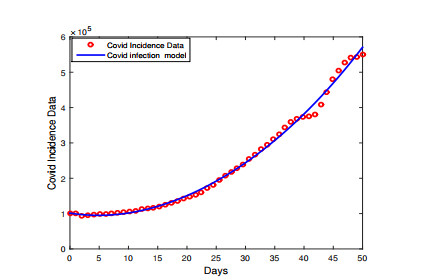
SARS-CoV-2 is the newly emerged infectious disease that started in Wuhan, China, in early December 2019 and has spread the world over very quickly, causing severe infections and death. Recently, vaccines have been used to curtail the severity of the disease without a permanent cure. The fractional-order models are beneficial for understanding disease epidemics as they tend to capture the memory and non-locality effects for mathematical models. In the present study, we analyze a deterministic and fractional epidemic model of COVID-19 for Indonesia, incorporating vaccination and environmental transmission of the pathogen. Further, the model is fitted to Indonesia's active cases data from 1 June 2021 to 20 July 2021, which helped determine the model parameters' value for our numerical simulation. Mathematical analyses such as boundedness, existence and uniqueness, reproduction number, and bifurcation were presented. Numerical simulations of the integer and fractional-order model were also carried out. The results obtained from the numerical simulations show that an increase in the contact rate of the virus transmission from the environment leads to an increase in the spread of SARS-CoV-2. In contrast, an increase in the vaccination rate negatively impacts on our model basic reproduction number. These results envisage here are essential for the control and possibly eradicate COVID-19 in Indonesia.
Citation: C. W. Chukwu, Fatmawati. Modelling fractional-order dynamics of COVID-19 with environmental transmission and vaccination: A case study of Indonesia[J]. AIMS Mathematics, 2022, 7(3): 4416-4438. doi: 10.3934/math.2022246
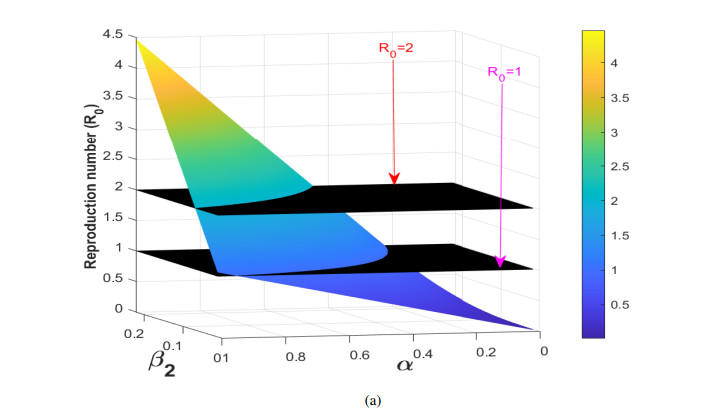
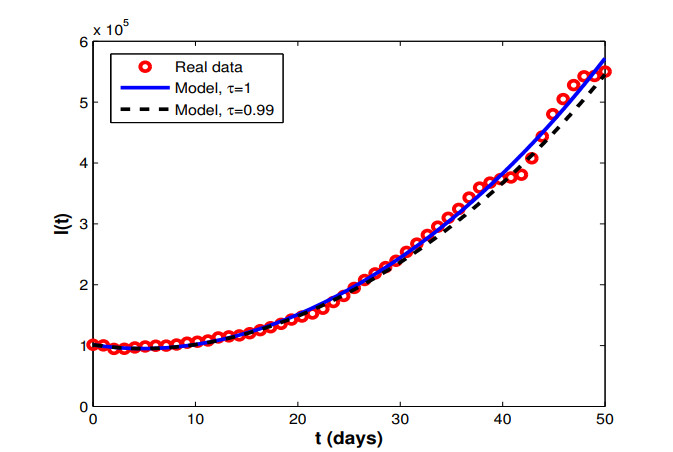
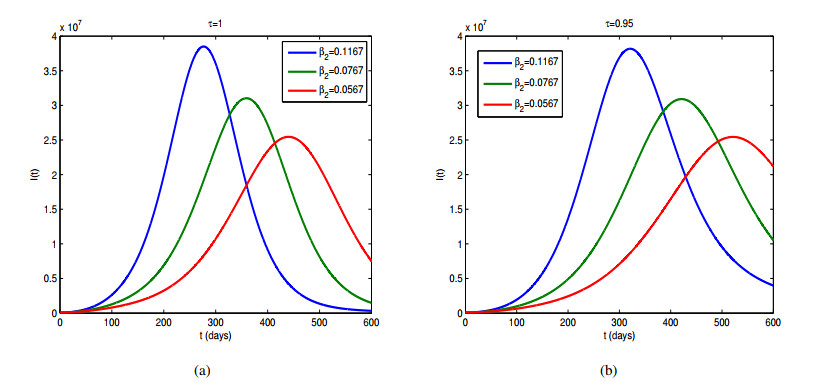
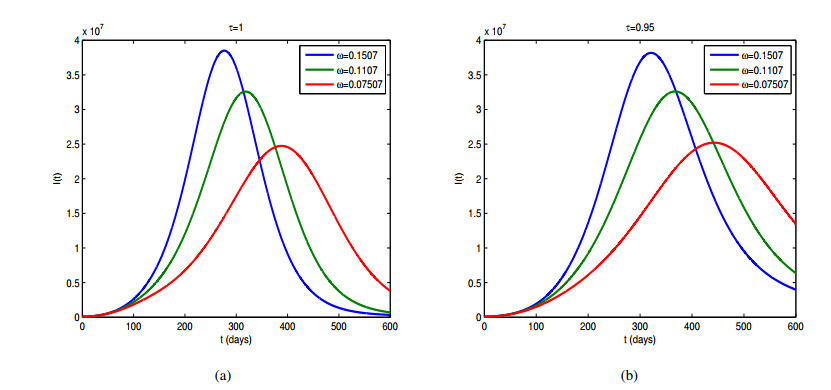
SARS-CoV-2 is the newly emerged infectious disease that started in Wuhan, China, in early December 2019 and has spread the world over very quickly, causing severe infections and death. Recently, vaccines have been used to curtail the severity of the disease without a permanent cure. The fractional-order models are beneficial for understanding disease epidemics as they tend to capture the memory and non-locality effects for mathematical models. In the present study, we analyze a deterministic and fractional epidemic model of COVID-19 for Indonesia, incorporating vaccination and environmental transmission of the pathogen. Further, the model is fitted to Indonesia's active cases data from 1 June 2021 to 20 July 2021, which helped determine the model parameters' value for our numerical simulation. Mathematical analyses such as boundedness, existence and uniqueness, reproduction number, and bifurcation were presented. Numerical simulations of the integer and fractional-order model were also carried out. The results obtained from the numerical simulations show that an increase in the contact rate of the virus transmission from the environment leads to an increase in the spread of SARS-CoV-2. In contrast, an increase in the vaccination rate negatively impacts on our model basic reproduction number. These results envisage here are essential for the control and possibly eradicate COVID-19 in Indonesia.

| [1] |
C. C. Lai, T. P. Shih, W. C. Ko, H. J. Tang, P. R. Hsueh, Severe acute respiratory syndrome coronavirus 2 (SARS -CoV-2) and corona virus disease-2019 (COVID-19): The epidemic and the challenges, Int. J. Antimicrob. Ag., 55 (2020), 105924. https://doi.org/10.1016/j.ijantimicag.2020.105924 doi: 10.1016/j.ijantimicag.2020.105924

|
| [2] | WHO, WHO Director-General's opening remarks at the media briefing on COVID-19, 2020. Available from: https://www.who.int/director-general/speeches/detail/who-director-general-s-opening-remarks-at-the-media-briefing-on-covid-19\–--11-march-2020/. |
| [3] | KPCPEN 2021, Data Vaksinasi COVID-19 Indonesia, 2021. Available from: https://covid19.go.id/p/berita/data-vaksinasi-covid-19-update-1-juni-2021. |
| [4] | WHO, Coronavirus disease (COVID-19): Vaccines, 2021. Available from: https://www.who.int/news-room/questions-and-answers/item/coronavirus-disease-(covid-19)-vaccines?gclid=EAIaIQobChMI7qzTv56K8wIViphmAh1jZQ-3EAAYASAAEgL8cfD_BwE&topicsurvey=v8kj13). |
| [5] |
F. Nyabadza, F. Chirove, C. W. Chukwu, M. V. Visaya, Modelling the potential impact of social distancing on the COVID-19 epidemic in South Africa, Comput. Math. Method. Med., 2020 (2020), 5379278. https://doi.org/10.1155/2020/5379278 doi: 10.1155/2020/5379278
|
| [6] | S. P. Gatyeni, C. W. Chukwu, F. Chirove, Fatmawati, F. Nyabadza, Application of optimal control to the dynamics of COVID-19 disease in South Africa, medRxiv, 2021. https://doi.org/10.1101/2020.08.10.20172049 |
| [7] |
S. Ullah, M. A. Khan, Modeling the impact of non-pharmaceutical interventions on the dynamics of novel coronavirus with optimal control analysis with a case study, Chaos Soliton. Fract., 139 (2020), 110075. https://doi.org/10.1016/j.chaos.2020.110075 doi: 10.1016/j.chaos.2020.110075
|
| [8] |
D. Aldila, B. M. Samiadji, G. M. Simorangkir, S. H. Khosnaw, M. Shahzad, Impact of early detection and vaccination strategy in COVID-19 eradication program in Jakarta, Indonesia, BMC Res. Notes, 14 (2021), 1–7. https://doi.org/10.1186/s13104-021-05540-9 doi: 10.1186/s13104-021-05540-9
|
| [9] |
A. Fuady, N. Nuraini, K. K. Sukandar, B. W. Lestari, Targeted vaccine allocation could increase the covid-19 vaccine benefits amidst its lack of availability: A mathematical modeling study in indonesia, Vaccines, 9 (2021), 462. https://doi.org/10.3390/vaccines9050462 doi: 10.3390/vaccines9050462
|
| [10] | N. Nuraini, K. Khairudin, P. Hadisoemarto, H. Susanto, A. Hasan, N. Sumarti, Mathematical models for assessing vaccination scenarios in several provinces in Indonesia, 6 (2021), 1236–1258. https://doi.org/10.1016/j.idm.2021.09.002 |
| [11] |
E. Bonyah, M. L. Juga, C. W. Chukwu, Fatmawati, A fractional order dengue fever model in the context of protected travelers, Alex. Eng. J., 61 (2021), 927–936. https://doi.org/10.1016/j.aej.2021.04.070 doi: 10.1016/j.aej.2021.04.070
|
| [12] |
E. Bonyah, C. W. Chukwu, M. L. Juga, Fatmawati, Modeling fractional order dynamics of Syphilis via Mittag-Leffler law, AIMS Math., 6 (2021), 8367–8389. https://doi.org/10.3934/math.2021485 doi: 10.3934/math.2021485
|
| [13] |
N. I. Okposo, M. O. Adewole, E. N. Okposo, H. I. Ojarikre, F. A. Abdullah, A mathematical study on a fractional COVID-19 transmission model within the framework of nonsingular and nonlocal kernel, Chaos Soliton. Fract., 152 (2021), 111427. https://doi.org/10.1016/j.chaos.2021.111427 doi: 10.1016/j.chaos.2021.111427
|
| [14] |
M. A. A. Oud, A. Ali, H. Alrabaiah, S. Ullah, M. A. Khan, S. Islam, A fractional order mathematical model for COVID-19 dynamics with quarantine, isolation, and environmental viral load, Adv. Differ. Equ., 2021 (2021), 106. https://doi.org/10.1186/s13662-021-03265-4 doi: 10.1186/s13662-021-03265-4
|
| [15] |
M. B. Jeelani, A. S. Alnahdi, M. S. Abdo, M. A. Abdulwasaa, K. Shah, H. A. Wahash, Mathematical modeling and forecasting of COVID-19 in Saudi Arabia under fractal-fractional derivative in Caputo sense with power-law, Axioms, 10 (2021), 228. https://doi.org/10.3390/axioms10030228 doi: 10.3390/axioms10030228
|
| [16] |
X. P. Li, H. Al Bayatti, A. Din, A. Zeb, A vigorous study of fractional order COVID-19 model via ABC derivatives, Results Phys., 29 (2021), 104737. https://doi.org/10.1016/j.rinp.2021.104737 doi: 10.1016/j.rinp.2021.104737
|
| [17] |
S. Bushnaq, T. Saeed, D. F. Torres, A. Zeb, Control of COVID-19 dynamics through a fractional-order model, Alex. Eng. J., 60 (2021), 3587–3592. https://doi.org/10.1016/j.aej.2021.02.022 doi: 10.1016/j.aej.2021.02.022
|
| [18] |
G. Nazir, A. Zeb, K. Shah, T. Saeed, R. A. Khan, S. I. U. Khan, Study of COVID-19 mathematical model of fractional order via modified Euler method, Alex. Eng. J., 60 (2021), 5287–5296. https://doi.org/10.1016/j.aej.2021.04.032 doi: 10.1016/j.aej.2021.04.032
|
| [19] |
Z. Zhang, A. Zeb, O. F. Egbelowo, V. S. Erturk, Dynamics of a fractional order mathematical model for COVID-19 epidemic, Adv. Differ. Equ., 2020 (2020), 1–16. https://doi.org/10.1186/s13662-020-02873-w doi: 10.1186/s13662-020-02873-w
|
| [20] |
A. Zeb, E. Alzahrani, V. S. Erturk, G. Zaman, Mathematical model for coronavirus disease 2019 (COVID-19) containing isolation class, Biomed Res. Int., 2020 (2020), 3452402. https://doi.org/10.1155/2020/3452402 doi: 10.1155/2020/3452402
|
| [21] |
J. Zu, M. L. Li, Z. F. Li, M. W. Shen, Y. N. Xiao, F. P. Ji, Transmission patterns of COVID-19 in the mainland of China and the efficacy of different control strategies: A data-and model-driven study, Infect. Dis. Poverty, 9 (2020), 1–14. https://doi.org/10.1186/s40249-020-00709-z doi: 10.1186/s40249-020-00709-z
|
| [22] |
P. A. Naik, M. Yavuz, S. Qureshi, J. Zu, S. Townley, Modeling and analysis of COVID-19 epidemics with treatment in fractional derivatives using real data from Pakistan, Eur. Phys. J. Plus, 135 (2020), 1–42. https://doi.org/10.1140/epjp/s13360-020-00819-5 doi: 10.1140/epjp/s13360-020-00819-5
|
| [23] |
P. A. Naik, J. Zu, M. B. Ghori, Modeling the effects of the contaminated environments on COVID-19 transmission in India, Results Phys., 29 (2021), 104774. https://doi.org/10.1016/j.rinp.2021.104774 doi: 10.1016/j.rinp.2021.104774
|
| [24] |
M. Yavuz, F. Ö. Coşar, F. Günay, F. N. Özdemir, A new mathematical modeling of the COVID-19 pandemic including the vaccination campaign, Open J. Model. Simul., 9 (2021), 299–321. https://doi.org/10.4236/ojmsi.2021.93020 doi: 10.4236/ojmsi.2021.93020
|
| [25] |
P. A. Naik, K. M. Owolabi, J. Zu, M. U. D. Naik, Modeling the transmission dynamics of COVID-19 pandemic in caputo type fractional derivative, J. Multiscale Model., 12 (2021), 2150006. https://doi.org/10.1142/S1756973721500062 doi: 10.1142/S1756973721500062
|
| [26] |
Y. M. Chu, A. Ali, M. A. Khan, S. Islam, S. Ullah, Dynamics of fractional order COVID-19 model with a case study of Saudi Arabia, Results Phys., 21 (2021), 103787. https://doi.org/10.1016/j.rinp.2020.103787 doi: 10.1016/j.rinp.2020.103787
|
| [27] |
A. Boudaoui, Y. El hadj Moussa, Z. Hammouch, S. Ullah, A fractional-order model describing the dynamics of the novel coronavirus (COVID-19) with nonsingular kernel, Chaos Soliton. Fract., 146 (2021), 110859. https://doi.org/10.1016/j.chaos.2021.110859 doi: 10.1016/j.chaos.2021.110859
|
| [28] |
B. A. Baba, B. Bilgehan, Optimal control of a fractional order model for the COVID–19 pandemic, Chaos Soliton. Fract., 144 (2021), 110678. https://doi.org/10.1016/j.chaos.2021.110678 doi: 10.1016/j.chaos.2021.110678
|
| [29] |
M. A. Aba Oud, A. Ali, H. Alrabaiah, S. Ullah, M. A. Khan, S. Islam, A fractional order mathematical model for COVID-19 dynamics with quarantine, isolation, and environmental viral load, Adv. Differ. Equ., 2021 (2021), 106. https://doi.org/10.1186/s13662-021-03265-4 doi: 10.1186/s13662-021-03265-4
|
| [30] |
N. I. Okposo, M. O. Adewole, E. N. Okposo, H. I. Ojarikre, F. A. Abdullah, A mathematical study on a fractional COVID-19 transmission model within the framework of nonsingular and nonlocal kernel, Chaos Soliton. Fract., 152 (2021), 111427. https://doi.org/10.1016/j.chaos.2021.111427 doi: 10.1016/j.chaos.2021.111427
|
| [31] | I. Podlubny, Fractional differential equations: An introduction to fractional derivatives, fractional differential equations, to methods of their solution and some of their applications, Elsevier, 1999. |
| [32] |
C. Vargas-De-León, Volterra-type Lyapunov functions for fractional-order epidemic systems, Commun. Nonlinear Sci., 24 (2015), 75–85. https://doi.org/10.1016/j.cnsns.2014.12.013 doi: 10.1016/j.cnsns.2014.12.013
|
| [33] | COVID-19 Indonesia, 2021. Available from: https://corona.jakarta.go.id/id. |
| [34] | Central bureau of statistics Indonesia, Hasil Sensus Penduduk 2020, 2021. Available from: https://www.bps.go.id/pressrelease/2021/01/21/1854/hasil-sensus-penduduk-2020.html. |
| [35] | Central bureau of statistics Indonesia, Umur Harapan Hidup Saat Lahir (UHH) (Tahun), 2019–2020, 2021. |
| [36] |
P. Van den Driessche, J. Watmough, Reproduction numbers and sub-threshold endemic equilibria for com-partmental models of disease transmission, Math. Biosci., 180 (2002), 29–48. https://doi.org/10.1016/S0025-5564(02)00108-6 doi: 10.1016/S0025-5564(02)00108-6
|
| [37] | Y. A. Kuznetsov, Elements of applied bifurcation theory, Springer Science & Business Media, 112 (2013), 594. |
| [38] |
C. Castillo-Chavez, B. Song, Dynamical models of tuberculosis and their applications, Math. Biosci. Eng., 2 (2004), 361–404. https://doi.org/10.3934/mbe.2004.1.361 doi: 10.3934/mbe.2004.1.361
|
| [39] | D. Aldila, Cost-effectiveness and backward bifurcation analysis on COVID-19 transmission model considering direct and indirect transmission, Commun. Math. Biol. Neu., 2020 (2020), 50. |
| [40] | K. Diethelm, D. Freed Alan, The fracpece subroutine for the numerical solution of differential equations of fractional order, Forsch. Wiss. Rechnen, 1999, 57–71. |
Figures(9) / Tables(3)

C. W. Chukwu, Fatmawati. Modelling fractional-order dynamics of COVID-19 with environmental transmission and vaccination: A case study of Indonesia[J]. AIMS Mathematics, 2022, 7(3): 4416-4438. doi: 10.3934/math.2022246


 DownLoad: