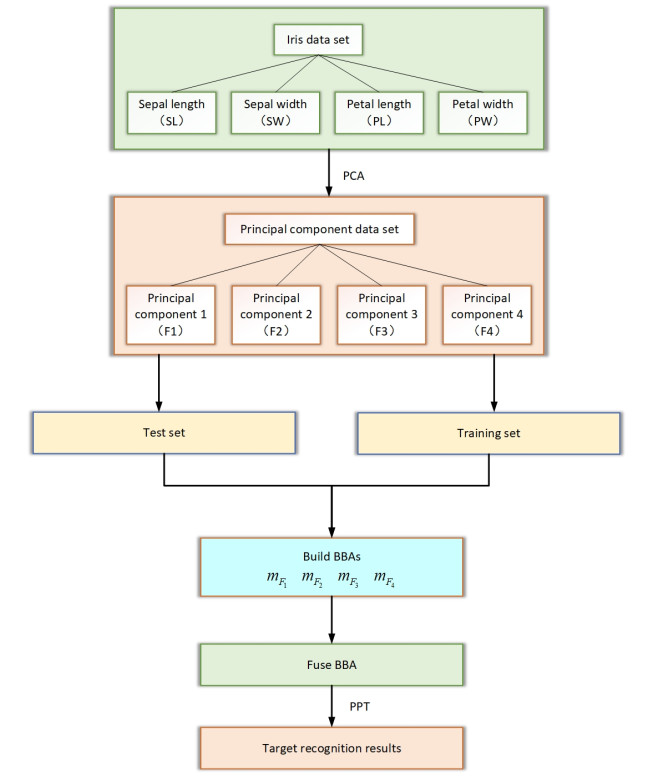
Dempster-Shafer evidence theory, as a generalization of probability theory, is a powerful tool for dealing with a variety of uncertainties, such as incompleteness, ambiguity, and conflict. Because of its advantages in information fusion compared with traditional probability theory, it is widely used in various fields. However, the classic Dempster's combination rule assumes that evidences are independent of each other, which is difficult to satisfy in real life. Ignoring the dependence among the evidences will lead to unreasonable fusion results, and even wrong conclusions. Considering the limitations of D-S evidence theory, this paper proposed a new evidence fusion model based on principal component analysis (PCA) to deal with the dependence among evidences. First, the approximate independent principal components of each information source were obtained based on principal component analysis. Second, the principal component data set was used as a new information source for evidence theory. Third, the basic belief assignments (BBAs) were constructed. As the fundamental construct of evidence theory, a BBA is a probabilistic function corresponding to each hypothesis, quantifying the belief assigned based on the evidence at hand. This function facilitates the synthesis of disparate evidence sources into a mathematically coherent and unified belief structure. After constructing the BBAs, the BBAs were fused and a conclusion was drawn. The case study verified that the proposed method is more robust than several traditional methods and can deal with redundant information effectively to obtain more stable results.
Citation: Xiaoyan Su, Shuwen Shang, Leihui Xiong, Ziying Hong, Jian Zhong. Research on dependent evidence combination based on principal component analysis[J]. Mathematical Biosciences and Engineering, 2024, 21(4): 4853-4873. doi: 10.3934/mbe.2024214
Dempster-Shafer evidence theory, as a generalization of probability theory, is a powerful tool for dealing with a variety of uncertainties, such as incompleteness, ambiguity, and conflict. Because of its advantages in information fusion compared with traditional probability theory, it is widely used in various fields. However, the classic Dempster's combination rule assumes that evidences are independent of each other, which is difficult to satisfy in real life. Ignoring the dependence among the evidences will lead to unreasonable fusion results, and even wrong conclusions. Considering the limitations of D-S evidence theory, this paper proposed a new evidence fusion model based on principal component analysis (PCA) to deal with the dependence among evidences. First, the approximate independent principal components of each information source were obtained based on principal component analysis. Second, the principal component data set was used as a new information source for evidence theory. Third, the basic belief assignments (BBAs) were constructed. As the fundamental construct of evidence theory, a BBA is a probabilistic function corresponding to each hypothesis, quantifying the belief assigned based on the evidence at hand. This function facilitates the synthesis of disparate evidence sources into a mathematically coherent and unified belief structure. After constructing the BBAs, the BBAs were fused and a conclusion was drawn. The case study verified that the proposed method is more robust than several traditional methods and can deal with redundant information effectively to obtain more stable results.

| [1] |
A. P. Dempster, Upper and lower probabilities induced by a multivalued mapping, Ann. Math. Stat., 38 (1967), 325–339. https://doi.org/10.1214/aoms/1177698950 doi: 10.1214/aoms/1177698950

|
| [2] | G. Shafer, A Mathematical Theory of Evidence, Princeton: Princeton University Press, 1976. https://doi.org/10.1515/9780691214696 |
| [3] |
Y. Deng, Uncertainty measure in evidence theory, Sci. China Inf. Sci., 63 (2020), 210201. https://doi.org/10.1007/s11432-020-3006-9 doi: 10.1007/s11432-020-3006-9
|
| [4] |
F. Xiao, Generalized quantum evidence theory, Appl. Intell., 53 (2023), 14329–14344. https://doi.org/10.1007/s10489-022-04181-0 doi: 10.1007/s10489-022-04181-0
|
| [5] |
Y. Cui, X. Deng, Plausibility Entropy: A New Total Uncertainty Measure in Evidence Theory Based on Plausibility Function, IEEE Trans. Syst. Man Cybern. Syst., 53 (2023), 3833–3844. https://doi.org/10.1109/TSMC.2022.3233156 doi: 10.1109/TSMC.2022.3233156
|
| [6] |
Y. Deng, Random permutation set, Int. J. Comput. Commun. Control, 17 (2022). https://doi.org/10.15837/ijccc.2022.1.4542 doi: 10.15837/ijccc.2022.1.4542
|
| [7] |
X. Deng, S. Xue, W. Jiang, A novel quantum model of mass function for uncertain information fusion, Inf. Fusion, 89 (2023), 619–631. https://doi.org/10.1016/j.inffus.2022.08.030 doi: 10.1016/j.inffus.2022.08.030
|
| [8] |
X. Chen, Y. Deng, A new belief entropy and its application in software risk analysis, Int. J. Comput. Commun. Control, 18 (2023). https://doi.org/10.15837/ijccc.2023.2.5299 doi: 10.15837/ijccc.2023.2.5299
|
| [9] |
F. Xiao, W. Pedrycz, Negation of the quantum mass function for multisource quantum information fusion with its application to pattern classification, IEEE Trans. Pattern Anal. Mach. Intell., 45 (2022), 2054–2070. https://doi.org/10.1109/TPAMI.2022.3167045 doi: 10.1109/TPAMI.2022.3167045
|
| [10] |
D. Li, Y. Deng, Measure information quality of basic probability assignment: An information volume method, Appl. Intell., 52 (2022), 11638–11651. https://doi.org/10.1007/s10489-021-03066-y doi: 10.1007/s10489-021-03066-y
|
| [11] |
C. Zhu, F. Xiao, A belief Hellinger distance for D–S evidence theory and its application in pattern recognition, Eng. Appl. Artif. Intell., 106 (2021), 104452. https://doi.org/10.1016/j.engappai.2021.104452 doi: 10.1016/j.engappai.2021.104452
|
| [12] |
Y. Tao, H. Hu, F. Xu, Z. Zhang, Ergonomic Risk Assessment of Construction Workers and Projects Based on Fuzzy Bayesian Network and DS Evidence Theory, J. Constr. Eng. Manag., 149 (2023), 04023034. https://doi.org/10.1061/JCEMD4.COENG-12821 doi: 10.1061/JCEMD4.COENG-12821
|
| [13] |
P. Lu, Y. Zhou, Y. Wu, D. Li, Risk assessment of complex footbridge based on Dempster–Shafer evidence theory using Fuzzy matter–element method, Appl. Soft Comput., 131 (2022), 109782. https://doi.org/10.1016/j.asoc.2022.109782 doi: 10.1016/j.asoc.2022.109782
|
| [14] |
S. I. Sezer, G. Elidolu, E. Akyuz, O. Arslan, An integrated risk assessment modelling for cargo manifold process on tanker ships under FMECA extended Dempster–Shafer theory and rule-based Bayesian network approach, Process Saf. Environ. Prot., 174 (2023), 340–352. https://doi.org/10.1016/j.psep.2023.04.024 doi: 10.1016/j.psep.2023.04.024
|
| [15] |
S. I. Sezer, G. Camliyurt, M. Aydin, E. Akyuz, P. Gardoni, A bow-tie extended DS evidence-HEART modelling for risk analysis of cargo tank cracks on oil/chemical tanker, Reliab. Eng. Syst. Saf., 237 (2023), 109346. https://doi.org/10.1016/j.ress.2023.109346 doi: 10.1016/j.ress.2023.109346
|
| [16] |
L. Fei, Y. Wang, An optimization model for rescuer assignments under an uncertain environment by using Dempster–Shafer theory, Knowl.-Based Syst., 255 (2022), 109680. https://doi.org/10.1016/j.knosys.2022.109680 doi: 10.1016/j.knosys.2022.109680
|
| [17] |
L. Fei, Y. Wang, Demand prediction of emergency materials using case-based reasoning extended by the Dempster-Shafer theory, Socio-Econ. Plan. Sci., 84 (2022), 101386. https://doi.org/10.1016/j.seps.2022.101386 doi: 10.1016/j.seps.2022.101386
|
| [18] |
R. Zhang, Z. Xu, X. Gou, An integrated method for multi-criteria decision-making based on the best-worst method and Dempster-Shafer evidence theory under double hierarchy hesitant fuzzy linguistic environment, Appl. Intell., 51 (2021), 713–735. https://doi.org/10.1007/s10489-020-01777-2 doi: 10.1007/s10489-020-01777-2
|
| [19] |
X. Su, S. Mahadevan, P. Xu, Y. Deng, Handling of dependence in Dempster–Shafer theory, Int. J. Intell. Syst., 30 (2015), 441–467. https://doi.org/10.1002/int.21695 doi: 10.1002/int.21695
|
| [20] |
X. Su, S. Mahadevan, W. Han, Y. Deng, Combining dependent bodies of evidence, Appl. Intell., 44 (2016), 634–644. https://doi.org/10.1007/s10489-015-0723-5 doi: 10.1007/s10489-015-0723-5
|
| [21] |
M. Chebbah, A. Martin, B. B. Yaghlane, Combining partially independent belief functions, Decis. Support Syst., 73 (2015), 37–46. https://doi.org/10.1016/j.dss.2015.02.017 doi: 10.1016/j.dss.2015.02.017
|
| [22] |
S. Destercke, D. Dubois, Idempotent conjunctive combination of belief functions: Extending the minimum rule of possibility theory, Inf. Sci., 181 (2011), 3925–3945. https://doi.org/10.1016/j.ins.2011.05.007 doi: 10.1016/j.ins.2011.05.007
|
| [23] |
M. E. G. V. Cattaneo, Belief functions combination without the assumption of independence of the information sources, Int. J. Approx. Reason., 52 (2011), 299–315. https://doi.org/10.1016/j.ijar.2010.10.006 doi: 10.1016/j.ijar.2010.10.006
|
| [24] |
C. Fu, S. Yang, The combination of dependence-based interval-valued evidential reasoning approach with balanced scorecard for performance assessment, Expert Syst. Appl., 39 (2012), 3717–3730. https://doi.org/10.1016/j.eswa.2011.09.069 doi: 10.1016/j.eswa.2011.09.069
|
| [25] |
F. Shi, X. Su, H. Qian, N. Yang, W. Han, Research on the fusion of dependent evidence based on rank correlation coefficient, Sensors, 17 (2017), 2362. https://doi.org/10.3390/s17102362 doi: 10.3390/s17102362
|
| [26] |
X. Su, L. Li, F. Shi, H. Qian, Research on the fusion of dependent evidence based on mutual information, IEEE Access, 6 (2018), 71839–71845. https://doi.org/10.1109/ACCESS.2018.2882545 doi: 10.1109/ACCESS.2018.2882545
|
| [27] |
G. Kong, D. Xu, J. Yang, T. Wang, B. Jiang, Evidential reasoning rule-based decision support system for predicting ICU admission and in-hospital death of trauma, IEEE Trans. Syst. Man Cybern. Syst., 51 (2020), 7131–7142. https://doi.org/10.1109/TSMC.2020.2967885 doi: 10.1109/TSMC.2020.2967885
|
| [28] |
S. Yao, J.-B. Yang, D.-L. Xu, P. Dark, Probabilistic modeling approach for interpretable inference and prediction with data for sepsis diagnosis, Expert Syst. Appl., 183 (2021), 115333. https://doi.org/10.1016/j.eswa.2021.115333 doi: 10.1016/j.eswa.2021.115333
|
| [29] |
T. Liu, D. A. Diaz-Pachon, J. S. Rao, J.-E. Dazard, High Dimensional Mode Hunting Using Pettiest Components Analysis, IEEE Trans. Pattern Anal. Mach. Intell., 45 (2022), 4637–4649. https://doi.org/10.1109/TPAMI.2022.3195462 doi: 10.1109/TPAMI.2022.3195462
|
| [30] |
J. Zhang, D. Zhou, M. Chen, Self-learning sparse PCA for multimode process monitoring, IEEE Trans. Ind. Inform., 19 (2022), 29–39. https://doi.org/10.1109/TII.2022.3178736 doi: 10.1109/TII.2022.3178736
|
| [31] |
A. D. McRae, J. Romberg, M. A. Davenport, Optimal convex lifted sparse phase retrieval and PCA with an atomic matrix norm regularizer, IEEE Trans. Inf. Theory, 69 (2022), 1866–1882. https://doi.org/10.48550/arXiv.2111.04652 doi: 10.48550/arXiv.2111.04652
|
| [32] |
S. Martinović, A. Alil, S. Milićević, D. Živojinović, T. V. Husović, Morphological assessment of cavitation caused damage of cordierite and zircon based materials using principal component analysis, Eng. Fail. Anal., 148 (2023), 107224. https://doi.org/10.1016/j.engfailanal.2023.107224 doi: 10.1016/j.engfailanal.2023.107224
|
| [33] |
H. B. Bisheh, G. G. Amiri, Structural damage detection based on variational mode decomposition and kernel PCA-based support vector machine, Eng. Struct., 278 (2023), 115565. https://doi.org/10.1016/j.engstruct.2022.115565 doi: 10.1016/j.engstruct.2022.115565
|
| [34] |
D. Gedon, A. H. Ribeiro, N. Wahlström, T. B. Schön, Invertible Kernel PCA with Random Fourier Features, IEEE Signal Process. Lett., 30 (2023), 563–567. https://doi.org/10.1109/LSP.2023.3275499 doi: 10.1109/LSP.2023.3275499
|
| [35] |
L. Shang, S. Wang, Application of improved principal component analysis in comprehensive assessment on thermal power generation units, Power Syst. Technol., 38 (2014), 1928–1933. https://doi.org/10.13335/j.1000-3673.pst.2014.07.032 doi: 10.13335/j.1000-3673.pst.2014.07.032
|
| [36] |
P. Xu, Y. Deng, X. Su, S. Mahadevan, A new method to determine basic probability assignment from training data, Knowl.-Based Syst., 46 (2013), 69–80. https://doi.org/10.1016/j.knosys.2013.03.005 doi: 10.1016/j.knosys.2013.03.005
|
| [37] |
R. A. Fisher, The use of multiple measurements in taxonomic problems, Ann. Eugen., 7 (1936), 179–188. https://doi.org/10.1111/j.1469-1809.1936.tb02137.x doi: 10.1111/j.1469-1809.1936.tb02137.x
|
| [38] | Iris, R. A. Fisher, 1988. Available from: https://doi.org/10.24432/C56C76 |
| [39] | Wine, S. Aeberhard, M. Forina, 1991. Available from: https://doi.org/10.24432/C5PC7J |
| [40] | Seeds, M. Charytanowicz, J. Niewczas, P. Kulczycki, P. Kowalski, S. Lukasik, 2012. Available from: https://doi.org/10.24432/C5H30K |


Figures(10) / Tables(5)

Xiaoyan Su, Shuwen Shang, Leihui Xiong, Ziying Hong, Jian Zhong. Research on dependent evidence combination based on principal component analysis[J]. Mathematical Biosciences and Engineering, 2024, 21(4): 4853-4873. doi: 10.3934/mbe.2024214


 DownLoad: