Bipolar disorder (BD) is a psychiatric disorder that affects an increasing number of people worldwide. The mechanisms of BD are unclear, but some studies have suggested that it may be related to genetic factors with high heritability. Moreover, research has shown that chronic stress can contribute to the development of major illnesses. In this paper, we used bioinformatics methods to analyze the possible mechanisms of chronic stress affecting BD through various aspects. We obtained gene expression data from postmortem brains of BD patients and healthy controls in datasets GSE12649 and GSE53987, and we identified 11 chronic stress-related genes (CSRGs) that were differentially expressed in BD. Then, we screened five biomarkers (IGFBP6, ALOX5AP, MAOA, AIF1 and TRPM3) using machine learning models. We further validated the expression and diagnostic value of the biomarkers in other datasets (GSE5388 and GSE78936) and performed functional enrichment analysis, regulatory network analysis and drug prediction based on the biomarkers. Our bioinformatics analysis revealed that chronic stress can affect the occurrence and development of BD through many aspects, including monoamine oxidase production and decomposition, neuroinflammation, ion permeability, pain perception and others. In this paper, we confirm the importance of studying the genetic influences of chronic stress on BD and other psychiatric disorders and suggested that biomarkers related to chronic stress may be potential diagnostic tools and therapeutic targets for BD.
Citation: Rongyanqi Wang, Lan Li, Man Chen, Xiaojuan Li, Yueyun Liu, Zhe Xue, Qingyu Ma, Jiaxu Chen. Gene expression insights: Chronic stress and bipolar disorder: A bioinformatics investigation[J]. Mathematical Biosciences and Engineering, 2024, 21(1): 392-414. doi: 10.3934/mbe.2024018
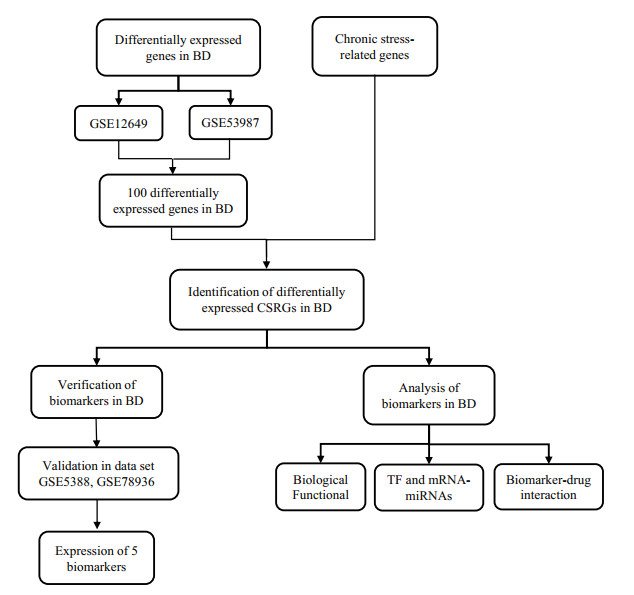
Bipolar disorder (BD) is a psychiatric disorder that affects an increasing number of people worldwide. The mechanisms of BD are unclear, but some studies have suggested that it may be related to genetic factors with high heritability. Moreover, research has shown that chronic stress can contribute to the development of major illnesses. In this paper, we used bioinformatics methods to analyze the possible mechanisms of chronic stress affecting BD through various aspects. We obtained gene expression data from postmortem brains of BD patients and healthy controls in datasets GSE12649 and GSE53987, and we identified 11 chronic stress-related genes (CSRGs) that were differentially expressed in BD. Then, we screened five biomarkers (IGFBP6, ALOX5AP, MAOA, AIF1 and TRPM3) using machine learning models. We further validated the expression and diagnostic value of the biomarkers in other datasets (GSE5388 and GSE78936) and performed functional enrichment analysis, regulatory network analysis and drug prediction based on the biomarkers. Our bioinformatics analysis revealed that chronic stress can affect the occurrence and development of BD through many aspects, including monoamine oxidase production and decomposition, neuroinflammation, ion permeability, pain perception and others. In this paper, we confirm the importance of studying the genetic influences of chronic stress on BD and other psychiatric disorders and suggested that biomarkers related to chronic stress may be potential diagnostic tools and therapeutic targets for BD.

| [1] | F. S. Goes, Diagnosis and management of bipolar disorders, BMJ, 381: e073591. http://dx.doi.org/10.1136/bmj-2022-073591 |
| [2] |
R. S. McIntyre, M. Berk, E. Brietzke, B. I. Goldstein, C. López-Jaramillo, L. V. Kessing et al., Bipolar disorders, Lancet, 396 (2020), 1841–1856. http://dx.doi.org/10.1016/s0140-6736(20)31544-0 doi: 10.1016/s0140-6736(20)31544-0

|
| [3] |
M. Simjanoski, S. Patel, R. D. Boni, V. Balanzá-Martínez, B. N. Frey, L. Minuzzi, et al., Lifestyle interventions for bipolar disorders: A systematic review and meta-analysis, Neurosci. Biobehav. Rev., 152 (2023), 105257. http://dx.doi.org/10.1016/j.neubiorev.2023.105257 doi: 10.1016/j.neubiorev.2023.105257
|
| [4] | D. Dyment, M. Lines, A. M. Innes, TRPM3-related neurodevelopmental disorder, in GeneReviews (eds. M. P. Adam, J. Feldman, G. M. Mirzaa et al.), University of Washington, Seattle, WA, 2023. |
| [5] |
I. Esterlis, S. DeBonee, R. Cool, S. Holmes, S. R. Baldassari, P. Maruff et al., Differential role of mglur5 in cognitive processes in posttraumatic stress disorder and major depression, Chronic Stress, 6 (2022), 247054702211058. http://dx.doi.org/10.1177/24705470221105804 doi: 10.1177/24705470221105804
|
| [6] |
G. Serra, F. D. Crescenzo, F. Maisto, J. R. Galante, M. E. Iannoni, M. Trasolini, et al., Suicidal behavior in juvenile bipolar disorder and major depressive disorder patients: Systematic review and meta-analysis, J. Affect. Disord., 311 (2022), 572–581. http://dx.doi.org/10.1016/j.jad.2022.05.063 doi: 10.1016/j.jad.2022.05.063
|
| [7] |
C. Zhuo, C. Zhou, H. Tian, Q. Li, J. Chen, L. Yang, et al., Lithium produces bi-directionally regulation of mood disturbance, acts synergistically with anti-depressive/-manic agents, and did not deteriorate the cognitive impairment in murine model of bipolar disorder, Transl. Psychiatry, 12 (2022), 359. http://dx.doi.org/10.1038/s41398-022-02087-6 doi: 10.1038/s41398-022-02087-6
|
| [8] |
X. You, Y. Zhang, Q. Long, Z. Liu, Z. Feng, W. Zhang, et al., Does single gene expression omnibus data mining analysis apply for only tumors and not mental illness? a preliminary study on bipolar disorder based on bioinformatics methodology, Medicine, 99 (2020), e21989. http://dx.doi.org/10.1097/md.0000000000021989 doi: 10.1097/md.0000000000021989
|
| [9] |
Y. Liu, H. Y. Gu, J. Zhu, Y. M. Niu, C. Zhang, G. L. Guo, Identification of hub genes and key pathways associated with bipolar disorder based on weighted gene co-expression network analysis, Front. Physiol., 10 (2019). http://dx.doi.org/10.3389/fphys.2019.01081 doi: 10.3389/fphys.2019.01081
|
| [10] |
M. Zhang, S. Zhao, Y. Chen, X. Zhang, Y. Li, P. Xu, et al., Chronic stress in bipolar disorders across the different clinical states: Roles of HPA axis and personality, Neuropsychiatr. Dis. Treat., 8 (2022), 1715–1725. http://dx.doi.org/10.2147/ndt.S372358 doi: 10.2147/ndt.S372358
|
| [11] | S. Noushad, S. Ahmed, B. Ansari, U. H. Mustafa, Y. Saleem, H. Hazrat, Physiological biomarkers of chronic stress: A systematic review, Int. J. Health Sci. (Qassim), 15 (2021), 46–59. |
| [12] |
E. Woo, L. H. Sansing, A. F. T. Arnsten, D. Datta, Chronic stress weakens connectivity in the prefrontal cortex: Architectural and molecular changes, Chronic Stress, 5 (2021), 247054702110292. http://dx.doi.org/10.1177/24705470211029254 doi: 10.1177/24705470211029254
|
| [13] |
B. S. McEwen, Neurobiological and systemic effects of chronic stress, Chronic Stress, 1 (2017), 247054701769232. http://dx.doi.org/10.1177/2470547017692328 doi: 10.1177/2470547017692328
|
| [14] |
H. Qiao, M. X. Li, C. Xu, H. B. Chen, S. C. An, X. M. Ma, Dendritic spines in depression: What we learned from animal models, Neural Plast., 2016 (2016), 1–26. http://dx.doi.org/10.1155/2016/8056370 doi: 10.1155/2016/8056370
|
| [15] |
M. F. Marin, C. Lord, J. Andrews, R. P. Juster, S. Sindi, G. Arsenault-Lapierre, et al., Chronic stress, cognitive functioning and mental health, Neurobiol. Learn. Mem., 96 (2011), 583–595. http://dx.doi.org/10.1016/j.nlm.2011.02.016 doi: 10.1016/j.nlm.2011.02.016
|
| [16] |
M. Heshmati, D. J. Christoffel, K. LeClair, F. Cathomas, S. A. Golden, H. Aleyasin, et al., Depression and social defeat stress are associated with inhibitory synaptic changes in the nucleus accumbens, J. Neurosci., 40 (2020), 6228–6233. http://dx.doi.org/10.1523/jneurosci.2568-19.2020 doi: 10.1523/jneurosci.2568-19.2020
|
| [17] |
W. Wang, W. Liu, D. Duan, H. Bai, Z. Wang, Y. Xing, Chronic social defeat stress mouse model: Current view on its behavioral deficits and modifications, Behav. Neurosci., 135 (2021), 326–335. http://dx.doi.org/10.1037/bne0000418 doi: 10.1037/bne0000418
|
| [18] |
S. Lu, S. Liu, P. Hou, B. Yang, M. Liu, L. Yin, et al., Soft tissue feature tracking based on deep matching network, Comput. Model. Eng. Sci., 136 (2023), 363–379. http://dx.doi.org/10.32604/cmes.2023.025217 doi: 10.32604/cmes.2023.025217
|
| [19] |
Y. Zhu, R. Huang, Z. Wu, S. Song, L. Cheng, R. Zhu, Deep learning-based predictive identification of neural stem cell differentiation, Nat. Commun., 12 (2021), 2614. http://dx.doi.org/10.1038/s41467-021-22758-0 doi: 10.1038/s41467-021-22758-0
|
| [20] |
X. Yi, X. Guan, C. Chen, Y. Zhang, Z. Zhang, M. Li, et al., Adrenal incidentaloma: machine learning-based quantitative texture analysis of unenhanced CT can effectively differentiate sPHEO from lipid-poor adrenal adenoma, J. Cancer, 9 (2018), 3577–3582. http://dx.doi.org/10.7150/jca.26356 doi: 10.7150/jca.26356
|
| [21] | H. N. Pham, T. T. T. Do, K. Y. J. Chan, G. Sen, A. Y. K. Han, P. Lim, et al., Multimodal detection of Parkinson disease based on vocal and improved spiral test, in 2019 International Conference on System Science and Engineering (ICSSE), IEEE, (2019), 279–284. http://dx.doi.org/10.1109/ICSSE.2019.8823309 |
| [22] | H. N. Pham, C. Y. Koay, T. Chakraborty, S. Gupta, B. L. Tan, H. Wu, et al., Lesion segmentation and automated melanoma detection using deep convolutional neural networks and xgboost, in 2019 International Conference on System Science and Engineering (ICSSE), IEEE, (2019), 142–147. http://dx.doi.org/10.1109/ICSSE.2019.8823129 |
| [23] |
V. T. Truong, B. P. Nguyen, T. H. Nguyen-Vo, W. Mazur, E. S. Chung, C. Palmer, et al., Application of machine learning in screening for congenital heart diseases using fetal echocardiography, Int. J. Cardiovasc. Imaging, 38 (2022), 1007–1015. http://dx.doi.org/10.1007/s10554-022-02566-3 doi: 10.1007/s10554-022-02566-3
|
| [24] |
B. P. Nguyen, H. N. Pham, H. Tran, N. Nghiem, Q. H. Nguyen, T. T. Do, et al., Predicting the onset of type 2 diabetes using wide and deep learning with electronic health records, Comput. Methods. Programs Biomed., 182 (2019), 105055. http://dx.doi.org/10.1016/j.cmpb.2019.105055 doi: 10.1016/j.cmpb.2019.105055
|
| [25] |
P. Peng, Y. Luan, P. Sun, L. Wang, X. Zeng, Y. Wang, et al., Prognostic factors in stage iv colorectal cancer patients with resection of liver and/or pulmonary metastases: A population-based cohort study, Front. Oncol., 12 (2022), 850937. http://dx.doi.org/10.3389/fonc.2022.850937 doi: 10.3389/fonc.2022.850937
|
| [26] |
T. H. Nguyen-Vo, L. Nguyen, N. Do, P. H. Le, T. N. Nguyen, Predicting drug-induced liver injury using convolutional neural network and molecular fingerprint-embedded features, ACS Omega, 5 (2020), 25432–25439. http://dx.doi.org/10.1021/acsomega.0c03866 doi: 10.1021/acsomega.0c03866
|
| [27] |
T. H. Nguyen-Vo, Q. H. Trinh, L. Nguyen, P. U. Nguyen-Hoang, T. N. Nguyen, D. T. Nguyen, et al., iCYP-MFE: Identifying human Cytochrome P450 inhibitors using multitask learning and molecular fingerprint-embedded encoding, J. Chem. Inf. Model., 62 (2021), 5059–5068. http://dx.doi.org/10.1021/acs.jcim.1c00628 doi: 10.1021/acs.jcim.1c00628
|
| [28] |
T. H. Nguyen-Vo, Q. H. Nguyen, T. T. Do, T. N. Nguyen, S. Rahardja, B. P. Nguyen iPseU-NCP: Identifying RNA pseudouridine sites using random forest and NCP-encoded features, BMC Genomics, 20 (2019), 1–11. http://dx.doi.org/10.1186/s12864-019-6357-y doi: 10.1186/s12864-019-6357-y
|
| [29] |
N. Q. K. Le, Q. H. Nguyen, X. Chen, S. Rahardja, B. P. Nguyen, Classification of adaptor proteins using recurrent neural networks and PSSM profiles, BMC Genomics, 20 (2019), 1–9. http://dx.doi.org/10.1186/s12864-019-6335-4 doi: 10.1186/s12864-019-6335-4
|
| [30] |
B. P. Nguyen, C. K. Chui, S. H. Ong, S. Chang, An efficient compression scheme for 4-D medical images using hierarchical vector quantization and motion compensation, Comput. Biol. Med., 41 (2011), 843–856. http://dx.doi.org/10.1016/j.compbiomed.2011.07.003 doi: 10.1016/j.compbiomed.2011.07.003
|
| [31] |
Y. Chen, L. Chen, Q. Zhou, Genetic association between eNOS gene polymorphisms and risk of carotid atherosclerosis: A meta-analysis, Herz, 46 (2020), 253–264. http://dx.doi.org/10.1007/s00059-020-04995-z doi: 10.1007/s00059-020-04995-z
|
| [32] |
X. Xie, X. Wang, Y. Liang, J. Yang, Y. Wu, L. Li, et al., Evaluating cancer-related biomarkers based on pathological images: A systematic review, Front. Oncol., 11 (2021), 763527. http://dx.doi.org/10.3389/fonc.2021.763527 doi: 10.3389/fonc.2021.763527
|
| [33] |
Z. He, C. Yue, X. Chen, X. Li, L. Zhang, S. Tan, et al., Integrative analysis identified CD38 as a key node that correlates highly with immunophenotype, chemoradiotherapy resistance, and prognosis of head and neck cancer, J. Cancer, 14 (2023), 72–87. http://dx.doi.org/10.7150/jca.59730 doi: 10.7150/jca.59730
|
| [34] |
H. Huang, N. Wu, Y. Liang, X. Peng, J. Shu, SLNL: A novel method for gene selection and phenotype classification, Int. J. Intell. Syst., 37 (2022), 6283–6304. http://dx.doi.org/10.1002/int.22844 doi: 10.1002/int.22844
|
| [35] |
H. Wang, T. Yang, J. Wu, D. Chen, W. Wang, Unveiling the mystery of SUMO-activating enzyme subunit 1: A groundbreaking biomarker in the early detection and advancement of hepatocellular carcinoma, Transplant. Proc., 55 (2023), 945–951. http://dx.doi.org/10.1016/j.transproceed.2023.03.042 doi: 10.1016/j.transproceed.2023.03.042
|
| [36] |
B. He, J. Lang, B. Wang, X. Liu, Q. Lu, J. He, et al., TOOme: A novel computational framework to infer cancer tissue-of-origin by integrating both gene mutation and expression, Front. Bioeng. Biotechnol., 8 (2020), 394. http://dx.doi.org/10.3389/fbioe.2020.00394 doi: 10.3389/fbioe.2020.00394
|
| [37] |
K. Iwamoto, M. Bundo, T. Kato, Altered expression of mitochondria-related genes in postmortem brains of patients with bipolar disorder or schizophrenia, as revealed by large-scale DNA microarray analysis, Hum. Mol. Genet., 14 (2004), 241–253. http://dx.doi.org/10.1093/hmg/ddi022 doi: 10.1093/hmg/ddi022
|
| [38] |
T. A. Lanz, V. Reinhart, M. J. Sheehan, S. J. S. Rizzo, S. E. Bove, L. C. James, et al., Postmortem transcriptional profiling reveals widespread increase in inflammation in schizophrenia: a comparison of prefrontal cortex, striatum, and hippocampus among matched tetrads of controls with subjects diagnosed with schizophrenia, bipolar or major depressive disorder, Transl. Psychiatry, 9 (2019), 151. http://dx.doi.org/10.1038/s41398-019-0492-8 doi: 10.1038/s41398-019-0492-8
|
| [39] |
M. M. Ryan, H. E. Lockstone, S. J. Huffaker, M. T. Wayland, M. J. Webster, S. Bahn, Gene expression analysis of bipolar disorder reveals downregulation of the ubiquitin cycle and alterations in synaptic genes, Mol. Psychiatry, 11 (2006), 965–978. http://dx.doi.org/10.1038/sj.mp.4001875 doi: 10.1038/sj.mp.4001875
|
| [40] |
J. Hu, J. Xu, L. Pang, H. Zhao, F. Li, Y. Deng, et al., Systematically characterizing dysfunctional long intergenic non-coding RNAs in multiple brain regions of major psychosis, Oncotarget, 7 (2016), 71087–71098. http://dx.doi.org/10.18632/oncotarget.12122 doi: 10.18632/oncotarget.12122
|
| [41] |
P. Shannon, A. Markiel, O. Ozier, N. S. Baliga, J. T. Wang, D. Ramage, et al., Cytoscape: A software environment for integrated models of biomolecular interaction networks, Genome Res., 13 (2003), 2498–2504. http://dx.doi.org/10.1101/gr.1239303 doi: 10.1101/gr.1239303
|
| [42] |
X. Robin, N. Turck, A. Hainard, N. Tiberti, F. Lisacek, J. C. Sanchez, et al., pROC: an open-source package for R and S+ to analyze and compare ROC curves, BMC Bioinf., 12 (2011), 1–8. http://dx.doi.org/10.1186/1471-2105-12-77 doi: 10.1186/1471-2105-12-77
|
| [43] |
B. P. Nguyen, W. L. Tay, C. K. Chui, Robust biometric recognition from palm depth images for gloved hands, IEEE Trans. Hum. Mach. Syst., 45 (2015), 799–804. http://dx.doi.org/10.1109/THMS.2015.2453203 doi: 10.1109/THMS.2015.2453203
|
| [44] |
A. X. Wang, S. S. Chukova, B. P. Nguyen, Ensemble k-nearest neighbors based on centroid displacement, Inf. Sci., 629 (2023), 313–323. http://dx.doi.org/10.1016/j.ins.2023.02.004 doi: 10.1016/j.ins.2023.02.004
|
| [45] |
A. X. Wang, S. S. Chukova, B. P. Nguyen, Synthetic minority oversampling using edited displacement-based k-nearest neighbors, Appl. Soft Comput., 148 (2023), 110895. http://dx.doi.org/10.1016/j.asoc.2023.110895 doi: 10.1016/j.asoc.2023.110895
|
| [46] |
S. A. Bengesser, H. Hohenberger, B. Tropper, N. Dalkner, A. Birner, F. T. Fellendorf, et al., Gene expression analysis of MAOA and the clock gene ARNTL in individuals with bipolar disorder compared to healthy controls, World J. Biol. Psychiatry, 23 (2021), 287–294. http://dx.doi.org/10.1080/15622975.2021.1973816 doi: 10.1080/15622975.2021.1973816
|
| [47] |
R. A. Furlong, L. Ho, J. S. Rubinsztein, C. Walsh, E. S. Paykel, D. C. Rubinsztein, Analysis of the monoamine oxidase A (MAOA) gene in bipolar affective disorder by association studies, meta-analyses, and sequencing of the promoter, Am. J. Med. Genet., 88 (1999), 398–406. http://dx.doi.org/10.1002/(sici)1096-8628(19990820)88:4<398::aid-ajmg18>3.0.co;2-y doi: 10.1002/(sici)1096-8628(19990820)88:4<398::aid-ajmg18>3.0.co;2-y
|
| [48] |
P. A. Kambey, L. D. Kodzo, F. Serojane, B. J. Oluwasola, The bi-directional association between bipolar disorder and obesity: Evidence from meta and bioinformatics analysis, Int. J. Obes., 47 (2023), 443–452. http://dx.doi.org/10.1038/s41366-023-01277-6 doi: 10.1038/s41366-023-01277-6
|
| [49] |
E. Petrasch-Parwez, A. Schöbel, A. Benali, Z. Moinfar, E. Förster, M. Brüne, et al., Lateralization of increased density of iba1-immunopositive microglial cells in the anterior midcingulate cortex of schizophrenia and bipolar disorder, Eur. Arch. Psychiatry Clin. Neurosci., 270 (2020), 819–828. http://dx.doi.org/10.1007/s00406-020-01107-0 doi: 10.1007/s00406-020-01107-0
|


Figures(9) / Tables(1)

Rongyanqi Wang, Lan Li, Man Chen, Xiaojuan Li, Yueyun Liu, Zhe Xue, Qingyu Ma, Jiaxu Chen. Gene expression insights: Chronic stress and bipolar disorder: A bioinformatics investigation[J]. Mathematical Biosciences and Engineering, 2024, 21(1): 392-414. doi: 10.3934/mbe.2024018


 DownLoad: