Mobility restrictions were widely practiced to reduce contact with others and prevent the spatial spread of COVID-19 infection. Using inter-prefectural mobility and epidemiological data, a statistical model was devised to predict the number of imported cases in each Japanese prefecture. The number of imported cases crossing prefectural borders in 2020 was predicted using inter-prefectural mobility rates based on mobile phone data and prevalence estimates in the origin prefectures. The simplistic model was quantified using surveillance data of cases with an inter-prefectural travel history. Subsequently, simulations were carried out to understand how imported cases vary with the mobility rate and prevalence at the origin. Overall, the predicted number of imported cases qualitatively captured the observed number of imported cases over time. Although Hokkaido and Okinawa are the northernmost and the southernmost prefectures, respectively, they were sensitive to differing prevalence rate in Tokyo and Osaka and the mobility rate. Additionally, other prefectures were sensitive to mobility change, assuming that an increment in the mobility rate was seen in all prefectures. Our findings indicate the need to account for the weight of an inter-prefectural mobility network when implementing countermeasures to restrict human movement. If the mobility rates were maintained lower than the observed rates, then the number of imported cases could have been maintained at substantially lower levels than the observed, thus potentially preventing the unnecessary spatial spread of COVID-19 in late 2020.
Citation: Asami Anzai, Syudo Yamasaki, Amanda Bleichrodt, Gerardo Chowell, Atsushi Nishida, Hiroshi Nishiura. Epidemiological impact of travel enhancement on the inter-prefectural importation dynamics of COVID-19 in Japan, 2020[J]. Mathematical Biosciences and Engineering, 2023, 20(12): 21499-21513. doi: 10.3934/mbe.2023951
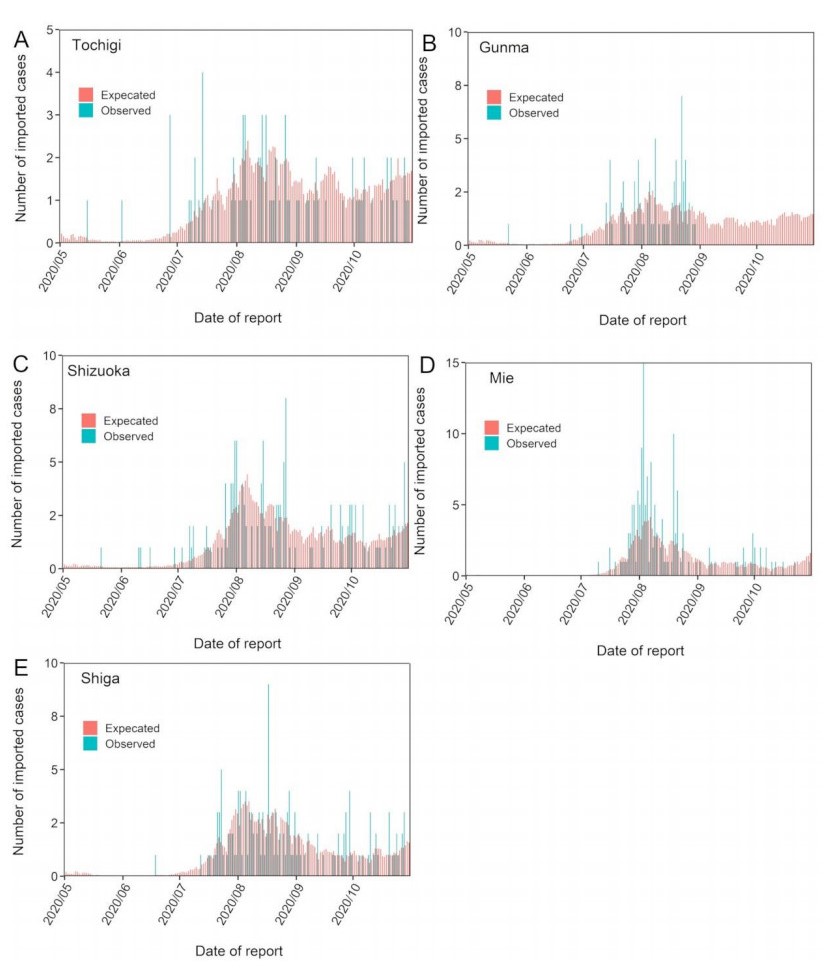
Mobility restrictions were widely practiced to reduce contact with others and prevent the spatial spread of COVID-19 infection. Using inter-prefectural mobility and epidemiological data, a statistical model was devised to predict the number of imported cases in each Japanese prefecture. The number of imported cases crossing prefectural borders in 2020 was predicted using inter-prefectural mobility rates based on mobile phone data and prevalence estimates in the origin prefectures. The simplistic model was quantified using surveillance data of cases with an inter-prefectural travel history. Subsequently, simulations were carried out to understand how imported cases vary with the mobility rate and prevalence at the origin. Overall, the predicted number of imported cases qualitatively captured the observed number of imported cases over time. Although Hokkaido and Okinawa are the northernmost and the southernmost prefectures, respectively, they were sensitive to differing prevalence rate in Tokyo and Osaka and the mobility rate. Additionally, other prefectures were sensitive to mobility change, assuming that an increment in the mobility rate was seen in all prefectures. Our findings indicate the need to account for the weight of an inter-prefectural mobility network when implementing countermeasures to restrict human movement. If the mobility rates were maintained lower than the observed rates, then the number of imported cases could have been maintained at substantially lower levels than the observed, thus potentially preventing the unnecessary spatial spread of COVID-19 in late 2020.

| [1] |
S. Wu, R. Neill, C. De Foo, A. Q. Chua, A. S. Jung, V. Haldane, et al., Aggressive containment, suppression, and mitigation of covid-19: Lessons learnt from eight countries, BMJ, 375 (2021), e067508. https://doi.org/10.1136/bmj-2021-067508 doi: 10.1136/bmj-2021-067508

|
| [2] |
S. Hsiang, D. Allen, S. Annan-Phan, K. Bell, I. Bolliger, T. Chong, et al., The effect of large-scale anti-contagion policies on the COVID-19 pandemic, Nature, 584 (2020), 262–267. https://doi.org/10.1038/s41586-020-2691-0 doi: 10.1038/s41586-020-2691-0
|
| [3] |
M. Gatto, E. Bertuzzo, L. Mari, S. Miccoli, L. Carraro, R. Casagrandi, et al., Spread and dynamics of the COVID-19 epidemic in Italy: Effects of emergency containment measures, Proc. Natl. Acad. Sci. U S A, 117 (2020), 10484–10491. https://doi.org/10.1073/pnas.2004978117 doi: 10.1073/pnas.2004978117
|
| [4] |
K. Lee, K. A. Grépin, C. Worsnop, S. Marion, J. Piper, M. Song, Managing borders during public health emergencies of international concern: a proposed typology of cross-border health measures, Global Health, 17 (2021), 62. https://doi.org/10.1186/s12992-021-00709-0 doi: 10.1186/s12992-021-00709-0
|
| [5] | K. A. Grépin, T. L. Ho, Z. Liu, S. Marion, J. Piper, C. Z. Worsnop, et al., Evidence of the effectiveness of travel-related measures during the early phase of the COVID-19 pandemic: A rapid systematic review, BMJ Glob. Health, 6 (2021), 4537. http://dx.doi.org/10.1136/bmjgh-2020-004537 |
| [6] |
H. Lau, V. Khosrawipour, P. Kocbach, A. Mikolajczyk, J. Schubert, J. Bania, et al., The positive impact of lockdown in Wuhan on containing the COVID-19 outbreak in China, J. Travel Med., 27 (2020), 1–7. https://doi.org/10.1093/jtm/taaa037 doi: 10.1093/jtm/taaa037
|
| [7] |
G. Guzzetta, F. Riccardo, V. Marziano, P. Poletti, F. Trentini, A. Bella, et al., Impact of a nationwide lockdown on SARS-CoV-2 transmissibility, Italy, Emerg. Infect. Dis., 27 (2021), 267–270. https://doi.org/10.3201/eid2701.202114 doi: 10.3201/eid2701.202114
|
| [8] |
J. Burns, A. Movsisyan, J. M. Stratil, R. L. Biallas, M. Coenen, K. M. Emmert-Fees, et al., International travel-related control measures to contain the COVID-19 pandemic: A rapid review, Cochrane Database Syst. Rev., 3 (2021), CD013717. https://doi.org/10.1002/14651858.CD013717.pub2 doi: 10.1002/14651858.CD013717.pub2
|
| [9] |
A. Osterrieder, G. Cuman, W. Pan-Ngum, P. K. Cheah, P. K. Cheah, P. Peerawaranun, et al., Economic and social impacts of COVID-19 and public health measures: Results from an anonymous online survey in Thailand, Malaysia, the UK, Italy and Slovenia, BMJ Open, 11 (2021), e046863. http://dx.doi.org/10.1136/bmjopen-2020-046863 doi: 10.1136/bmjopen-2020-046863
|
| [10] |
G. Bonaccorsi, F. Pierri, M. Cinelli, A. Flori, A. Galeazzi, F. Porcelli, et al., Economic and social consequences of human mobility restrictions under COVID-19, Proc. Natl. Acad. Sci. U S A, 117 (2020), 15530–15535. https://doi.org/10.1073/pnas.2007658117 doi: 10.1073/pnas.2007658117
|
| [11] |
C. Klinger, J. Burns, A, Movsisyan, R. Biallas, S. L. Norris, J. E. Rabe, et al., Unintended health and societal consequences of international travel measures during the COVID-19 pandemic: A scoping review, J. Travel Med., 28 (2021), taab123. https://doi.org/10.1093/jtm/taab123 doi: 10.1093/jtm/taab123
|
| [12] | A. Movsisyan, J. Burns, R. Biallas, M. Coenen, K. Geffert, O. Horstick, et al., Travel-related control measures to contain the COVID-19 pandemic: an evidence map, BMJ Open, 11 (2021), e041619. http://dx.doi.org/10.1136/bmjopen-2020-041619 |
| [13] |
B. L. Dickens, J. R. Koo, J. M. Lim, M. Park, H. Sun, Y. Sun, et al., Determining quarantine length and testing frequency for international border opening during the COVID-19 pandemic, J. Travel Med., 28 (2021), taab088. https://doi.org/10.1093/jtm/taab088 doi: 10.1093/jtm/taab088
|
| [14] |
T. M. Le, L. Raynal, O. Talbot, H. Hambridge, C. Drovandi, A. Mira, et al., Framework for assessing and easing global COVID-19 travel restrictions, Sci. Rep., 12 (2022), 6985. https://doi.org/10.1038/s41598-022-10678-y doi: 10.1038/s41598-022-10678-y
|
| [15] |
C. R. Wells, A. Pandey, M. C. Fitzpatrick, W. S. Crystal, B. H. Singer, S. M. Moghadas, et al., Quarantine and testing strategies to ameliorate transmission due to travel during the COVID-19 pandemic: A modelling study, Lancet Reg. Health Eur., 14 (2022), 100304. https://doi.org/10.1016/j.lanepe.2021.100304 doi: 10.1016/j.lanepe.2021.100304
|
| [16] |
P. Nouvellet, S. Bhatia, A. Cori, K. E. C. Ainslie, M. Baguelin, S. Bhatt, et al., Reduction in mobility and COVID-19 transmission, Nat. Commun., 12. (2021), 1090. https://doi.org/10.1038/s41467-021-21358-2 doi: 10.1038/s41467-021-21358-2
|
| [17] | Cabinet Secretariat of Japan: COVID-19 emergency declarations, 2021. Available from: https://corona.go.jp/emergency |
| [18] |
Y. Ishii, K. Hayakawa, M. Chikaraishi, Sustaining self-restraint until the middle of the COVID-19 pandemic in Tokyo, Sci. Rep., 12 (2022), 20825. https://doi.org/10.1038/s41598-022-25489-4 doi: 10.1038/s41598-022-25489-4
|
| [19] |
S. Nagata, T. Nakaya, Y. Adachi, T. Inamori, K. Nakamura, D. Arima, et al., Mobility Change and COVID-19 in Japan: Mobile data analysis of locations of infection, J. Epidemiol., 31 (2021), 387–391. https://doi.org/10.2188/jea.JE20200625 doi: 10.2188/jea.JE20200625
|
| [20] |
C. Ghaznavi, D. Yoneoka, Y. Tanoue, S. Gilmour, T. Kawashima, A. Eguchi, et al., Inter-prefectural travel and network connectedness during the COVID-19 pandemic in Japan, J. Epidemiol., 32 (2022), 510–518. https://doi.org/10.2188/jea.JE20220064 doi: 10.2188/jea.JE20220064
|
| [21] |
Y. Kawakami, S. Nojiri, D. Nakamoto, Y. Irie, S. Miyazawa, M. Kuroki, et al., Novel indicator for the spread of new coronavirus disease 2019 and its association with human mobility in Japan, Sci Rep., 13 (2023), 115. https://doi.org/10.1038/s41598-022-27322-4 doi: 10.1038/s41598-022-27322-4
|
| [22] |
D. Nakamoto, S. Nojiri, C. Taguchi, Y. Kawakami, S. Miyazawa, M. Kuroki, et al., The impact of declaring the state of emergency on human mobility during COVID-19 pandemic in Japan, Clin. Epidemiol. Glob. Health, 17 (2022), 101149. https://doi.org/10.1016/j.cegh.2022.101149 doi: 10.1016/j.cegh.2022.101149
|
| [23] | Japan Tourism Agency: Go To Travel Campaign, 2020. Available from: https://biz.goto.jata-net.or.jp/ |
| [24] | Prime Minister's Office of Japan: Prime Minister's Press Conference, 2020. Available from: https://www.kantei.go.jp/jp/99_suga/statement/2020/1214kaiken02.html |
| [25] | Japan Tourism Agency: Travel Subsidy Program, 2022. Available from: https://www.mlit.go.jp/kankocho/news06_000570.html |
| [26] |
R. Kinoshita, S. M. Jung, T. Kobayashi, A. R. Akhmetzhanov, H. Nishiura, Epidemiology of coronavirus disease 2019 (COVID-19) in Japan during the first and second waves, Math. Biosci. Eng., 19 (2022), 6088–6101. https://doi.org/10.3934/mbe.2022284 doi: 10.3934/mbe.2022284
|
| [27] |
S. Okamoto, State of emergency and human mobility during the COVID-19 pandemic in Japan, J. Transp. Health, 26 (2022), 101405. https://doi.org/10.1016/j.jth.2022.101405 doi: 10.1016/j.jth.2022.101405
|
| [28] |
I. Y. Chu, P. Alam, H. J. Larson, L. Lin, Social consequences of mass quarantine during epidemics: A systematic review with implications for the COVID-19 response, J. Travel Med., 27 (2020), taaa192. https://doi.org/10.1093/jtm/taaa192 doi: 10.1093/jtm/taaa192
|
| [29] |
T. W. Russell, J. T. Wu, S. Clifford, W. J. Edmunds, A. J. Kucharski, M. Jit, et al., Effect of internationally imported cases on internal spread of COVID-19: A mathematical modelling study, Lancet Public Health, 6 (2021), e12–20. https://doi.org/10.1016/S2468-2667(20)30263-2 doi: 10.1016/S2468-2667(20)30263-2
|
| [30] | LocationMind xPop: Importation Risk. Cabinet Secretariat, 2021. Available from: https://corona.go.jp/dashboard/pdf/inflow_risk_20210614.pdf |
| [31] | Ministry of Health, Labour and Welfare: Notice of Amendment of Act on the Prevention of Infectious Diseases and Medical Care for Patients with Infectious Diseases (the Infectious Diseases Control Law), 2020. Available from: https://www.mhlw.go.jp/content/10900000/000593023.pdf |
| [32] | Ministry of Health, Labour, and Welfare: Health Center Real-time Information-sharing System on COVID-19 (HER-SYS), 2022. Available from: https://www.mhlw.go.jp/stf/seisakunitsuite/bunya/0000121431_00129.html |
| [33] | Ministry of Health, Labour and Welfare: Trend in the number of newly confirmed cases (daily), 2022. Available from: https://www.mhlw.go.jp/stf/covid-19/open-data.html |
| [34] | Location Mind Inc: Location Mind xPop. Available from: https://locationmind.com/top-page-e/ |
| [35] | Telecommunications Carriers Association: Number of subscribers by carriers, 2022. Available from: https://www.tca.or.jp/database/ |
| [36] | Statistics Bureau of Japan: Population estimates (As of October 1st, 2019), 2020. Available from: https://www.stat.go.jp/english/data/jinsui/2.html |
| [37] |
S. Hakki, J. Zhou, J. Jonnerby, A. Singanayagam, J. L. Barnett, K. J. Madon, et al., Onset and window of SARS-CoV-2 infectiousness and temporal correlation with symptom onset: A prospective, longitudinal, community cohort study, Lancet Respir. Med., 10 (2022), 1061–1073. https://doi.org/10.1016/S2213-2600(22)00226-0 doi: 10.1016/S2213-2600(22)00226-0
|
| [38] | Cabinet Secretariat: COVID-19 information and resources. Available from: https://corona.go.jp/dashboard/ |
| [39] |
R. Kanamori, Y. Kawakami, S. Nojiri, S. Miyazawa, M. Kuroki, Y. Nishizaki, Changes in social environment due to the state of emergency and Go To campaign during the COVID-19 pandemic in Japan: An ecological study, PLoS One, 17 (2022), e0267395. https://doi.org/10.1371/journal.pone.0267395 doi: 10.1371/journal.pone.0267395
|
| [40] | Japan Tourism Agency: Overnight Travel Statistics Survey, 2023. Available from: https://www.mlit.go.jp/kankocho/siryou/toukei/shukuhakutoukei.html |
 mbe-20-12-951_supplementary.docx mbe-20-12-951_supplementary.docx |
 |
| mbe-20-12-951_ final Additional_data.csv |
|


Figures(5)

Asami Anzai, Syudo Yamasaki, Amanda Bleichrodt, Gerardo Chowell, Atsushi Nishida, Hiroshi Nishiura. Epidemiological impact of travel enhancement on the inter-prefectural importation dynamics of COVID-19 in Japan, 2020[J]. Mathematical Biosciences and Engineering, 2023, 20(12): 21499-21513. doi: 10.3934/mbe.2023951


 DownLoad: