Research article Special Issues

Threshold control strategy for a Filippov model with group defense of pests and a constant-rate release of natural enemies


  • In this paper, we establish an integrated pest management Filippov model with group defense of pests and a constant rate release of natural enemies. First, the dynamics of the subsystems in the Filippov system are analyzed. Second, the dynamics of the sliding mode system and the types of equilibria of the Filippov system are discussed. Then the complex dynamics of the Filippov system are investigated by using numerical analysis when there is a globally asymptotically stable limit cycle and a globally asymptotically stable equilibrium in two subsystems, respectively. Furthermore, we analyze the existence region of a sliding mode and pseudo equilibrium, as well as the complex dynamics of the Filippov system, such as boundary equilibrium bifurcation, the grazing bifurcation, the buckling bifurcation and the crossing bifurcation. These complex sliding bifurcations reveal that the selection of key parameters can control the population density no more than the economic threshold, so as to prevent the outbreak of pests.

    Citation: Baolin Kang, Xiang Hou, Bing Liu. Threshold control strategy for a Filippov model with group defense of pests and a constant-rate release of natural enemies[J]. Mathematical Biosciences and Engineering, 2023, 20(7): 12076-12092. doi: 10.3934/mbe.2023537

    Related Papers:

    [1] Ya Li, Z. Feng . Dynamics of a plant-herbivore model with toxin-induced functional response. Mathematical Biosciences and Engineering, 2010, 7(1): 149-169. doi: 10.3934/mbe.2010.7.149
    [2] Xinru Zhou, Xinmiao Rong, Meng Fan, Josué-Antonio Nescolarde-Selvaa . Stoichiometric modeling of aboveground-belowground interaction of herbaceous plant. Mathematical Biosciences and Engineering, 2019, 16(1): 25-55. doi: 10.3934/mbe.2019002
    [3] Alhadi E. Alamir, Gomah E. Nenaah, Mohamed A. Hafiz . Mathematical probit and logistic mortality models of the Khapra beetle fumigated with plant essential oils. Mathematical Biosciences and Engineering, 2015, 12(4): 687-697. doi: 10.3934/mbe.2015.12.687
    [4] Jeong-Mi Yoon, Volodymyr Hrynkiv, Lisa Morano, Anh Tuan Nguyen, Sara Wilder, Forrest Mitchell . Mathematical modeling of Glassy-winged sharpshooter population. Mathematical Biosciences and Engineering, 2014, 11(3): 667-677. doi: 10.3934/mbe.2014.11.667
    [5] Yang Kuang, Jef Huisman, James J. Elser . Stoichiometric Plant-Herbivore Models and Their Interpretation. Mathematical Biosciences and Engineering, 2004, 1(2): 215-222. doi: 10.3934/mbe.2004.1.215
    [6] Guangyu Sui, Meng Fan, Irakli Loladze, Yang Kuang . The dynamics of a stoichiometric plant-herbivore model and its discrete analog. Mathematical Biosciences and Engineering, 2007, 4(1): 29-46. doi: 10.3934/mbe.2007.4.29
    [7] Zhilan Feng, Wenzhang Huang, Donald L. DeAngelis . Spatially heterogeneous invasion of toxic plant mediated by herbivory. Mathematical Biosciences and Engineering, 2013, 10(5&6): 1519-1538. doi: 10.3934/mbe.2013.10.1519
    [8] Yang Li, Jia Li . Stage-structured discrete-time models for interacting wild and sterile mosquitoes with beverton-holt survivability. Mathematical Biosciences and Engineering, 2019, 16(2): 572-602. doi: 10.3934/mbe.2019028
    [9] Sunmi Lee, Chang Yong Han, Minseok Kim, Yun Kang . Optimal control of a discrete-time plant–herbivore/pest model with bistability in fluctuating environments. Mathematical Biosciences and Engineering, 2022, 19(5): 5075-5103. doi: 10.3934/mbe.2022237
    [10] Luca Galbusera, Sara Pasquali, Gianni Gilioli . Stability and optimal control for some classes of tritrophic systems. Mathematical Biosciences and Engineering, 2014, 11(2): 257-283. doi: 10.3934/mbe.2014.11.257
  • In this paper, we establish an integrated pest management Filippov model with group defense of pests and a constant rate release of natural enemies. First, the dynamics of the subsystems in the Filippov system are analyzed. Second, the dynamics of the sliding mode system and the types of equilibria of the Filippov system are discussed. Then the complex dynamics of the Filippov system are investigated by using numerical analysis when there is a globally asymptotically stable limit cycle and a globally asymptotically stable equilibrium in two subsystems, respectively. Furthermore, we analyze the existence region of a sliding mode and pseudo equilibrium, as well as the complex dynamics of the Filippov system, such as boundary equilibrium bifurcation, the grazing bifurcation, the buckling bifurcation and the crossing bifurcation. These complex sliding bifurcations reveal that the selection of key parameters can control the population density no more than the economic threshold, so as to prevent the outbreak of pests.


    Hand-foot-and-mouth disease (HFMD) causes a substantial disease burden in Asian regions including China, mainly in children below 5 years old and partly in adolescent students [1,2]. Enterovirus 71 (EV71), coxsackievirus A16 (CA16) are the most common enterovirus serotypes causing HFMD in China [3,4]. Although most cases of HFMD are mildly self-limiting, characterized by fever, flat spots or bumps on the hands, feet and mouth, possible transmission routes of HFMD contain casual contact with contaminated discharges, fluid of blisters or stool from infected persons, or contaminated objects, severe cases may develop into heart and lung failure and even death [5,6,7].

    In the last decade, many severe HFMD outbreaks have occurred in East Asia and Southeast Asia, which has become a serious public health problem in the affected countries and regions. Despite generation and approval of an EV71 vaccine in China in 2016, recently several HFMD outbreaks were caused by other pathogens, making it important to take additional actions to control HFMD epidemics [8]. The increasing burden of HFMD has become a serious public health problem in China, causing the government to pay greater attention to the risk factors of this disease, and focus on the effective prevention and control strategies.

    A distinct seasonal pattern with annual peaks in the summer was reported in temperate regions [9], whereas in tropical and subtropical regions, more than two peaks may occur within a year [10,11,12,13,14]. Many studies have confirmed that meteorological factors have an important influence on the incidence of HFMD despite the inconsistent results from different studies [9,12,15,16,17,18,19]. Relative-humidity and temperature are regarded as the top two meteorological factors affecting the HFMD transmission [15,17,18,19]. Attending kindergarten, child-care center or school and public gathering were also pointed out as risk factors for HFMD [20,21,22]. However, it is not clear whether above factors are related to multiple-peak pattern, and when and how these factors play a critical role in determining the HFMD transmission in one year.

    Mathematical epidemiology is the study of the spread of disease in space and time, with the aim to identify the factors that are responsible for or contributing to their occurrence. The basic reproduction number (R0) is often used to assess the transmission potential or transmissibility of an infectious disease, which indicates the average number of expected secondary infections resulting from a single infectious case [23]. In general, if it is greater than one, the disease will continue to spread, while if it is less than one, the disease will eventually disappear [24,25]. Both statistically robust analytical methods (model-free estimation) and dynamic modelling of infectious diseases (model-based estimation) have contributed greatly to estimate R0, which may be used to guide infectious disease prevention, control and eradication [10,26,27].

    Now, mathematical models have become one of the important tools for analyzing the spread and control of HFMD [3,28,29,30,31,32,33]. The aim of this study is to investigate the transmission dynamics and examine when and how its potential factors play a decisive role in the annual multiple-peak pattern based on the surveillance data of HFMD in Wenzhou city, Zhejiang province, China. We first estimated daily and annual model-free basic reproduction number Rfree0(day) and Rfree0(year) based on the infected data and the infection characteristics of HFMD, in which Rfree0(day) means the average number of secondary cases that each infected individual would infect if the conditions remained as they were at the time of a day, and Rfree0(year) is the annual average of Rfree0(day). Then we developed a mathematical model incorporating the potential factors, which are screened and identified by the correlation with the obtained daily model-free basic reproduction number, including school opening or not, and meteorological factors. After then, reported HFMD infection data were further used to estimate the undetermined model parameters. Thus, the annual model-based basic reproduction number Rmodel0(year) can be calculated after some reasonable approximation, and sensitivity analysis of the model was performed to estimate the resultant effects of the potential factors. In the end, some feasible control strategies of HFMD were proposed based on the above analyses.

    Infected data of HFMD in Wenzhou between 1 January 2010 to 31 December 2015 were collected by Wenzhou Center for Disease Control and Prevention [34], including basic demographic characteristics of HFMD cases, and daily incident cases. According to the obtained records, all the cases were children aged between 0 and 14 years old, and there were 203,488 cases in all.

    School summer and winter vacation as well as school opening duration was determined according to the guidelines of the school calendar issued by the Education Bureau [35].

    Daily meteorological factors, including minimum temperature, mean temperature, maximum temperature, minimum relative humidity and mean relative humidity, were collected from the China Meteorological Data Sharing Service System [36]. A weather monitoring station is located in Ruian County, Wenzhou City (N27o', E120o39'), from which the data are usually used to represent the meteorological conditions of the whole Wenzhou city.

    To quantify the intensity of transmission over time, we first suppose that serial interval (the time between the onset of symptoms in a primary case and the onset of symptoms in secondary cases) is equal to the sum of L and D, where L represents the duration of incubation and D denotes the duration of infection [37]. Then serial interval distribution was obtained by calculating the joint probability density function of L and D. Thus, according to the method in [26], we can estimate the daily model-free basic reproduction number Rfree0(day) by using "epiEstim" Excel software package [26]. According to the annual average, we can obtain the annual model-free basic reproduction number Rfree0(year). See Supplementary A for more details.

    According to the primary epidemiological properties of HFMD and the implemented public health interventions (quarantine, isolation and hygiene precaution), we divide the total population (N) into five compartments, named as susceptible (S), exposed but not yet infectious (E), infectious (I), quarantine (Q) and recovered (R). Figure 1 illustrates the flowchart of the five compartments, which describes how individuals can move among the states.

    Based on the flowchart in Figure 1, the dynamic model can be described by the following non-autonomous differential equations:

    {dSdt=λ(d+c)Sβ(t)SIN+ηR,dEdt=β(t)SIN(d+σ)E,dIdt=σE(d+δ1+k+γ1)I,dQdt=kI(d+δ2+γ2)Q,dRdt=γ1I+γ2Q(d+η+c)R,dNdt=λdNcScRδ1Iδ2Q. (2.1)

    The meaning and values of parameters, and initial conditions in model (2.1) are given in Table 4 (See Supplementary B). Note that once individuals are infected with the virus, even though they are growing in age, they can only leave the system after evolving into recovered compartment. Thus, the parameter of transfer rate due to age growth c only appears in the first, fifth and last equations in (2.1).

    Here β(t) is the contact rate between susceptible (S) and infectious (I), which is a time-varying, continuous, positive function. Concretely, β(t) can be divided into five sections: (1) the interaction factor between school opening and meteorological effect during spring semester, βs×m(t); (2) the interaction factor between school opening and meteorological effect during fall semester, βf×m(t); (3) the meteorological factor during spring semester, βms(t); (4) the meteorological factor during fall semester, βmf(t); (5) the meteorological factor during winter and summer vacation, βmr(t). Therefore, β(t) can be expressed as

    β(t)=βs×m(t)+βf×m(t)+βms(t)+βmf(t)+βmr(t). (2.2)

    For detailed expressions of (2.2) and more details, see Supplementary B.

    Figure 1.  Flowchart of HFMD transmission in a populations.

    Based on the reported HFMD cases and the dynamic model (2.1), an adaptive Metropolis-Hastings algorithm was conducted to carry out the Markov Chain Monte Carlo (MCMC) procedure to estimate the undetermined parameters in contact rate and their standard deviations (see Supplementary C for details). The algorithm runs for 1000000 iterations with a burn-in of 500000 iterations, with the Geweke convergence diagnostic method employed to assess the convergence [38]. The mean values of the estimated parameters and their standard deviations are listed in Table 5. Note that the fluctuations of meteorological factors in different years can be approximately regarded as periodic changes. i.e., the contact rate β(t) can be approximately regarded as annual periodic function. Thus, based on the results in [39,40], the annual model-based basic reproduction number Rmodel0(year) can be calculated by estimated parameters and simulation numerical integration (See Supplementary D for details).

    Note that there are 19 undetermined parameters in contact rate, each with different mean value and variance, which means that it is tedious and extremely complex to study their influence on the outcomes. In order to detect the underlying factors more simply, a better idea is to do the sensitivity analysis for different categories of parameters. Thus, according to the expression (2.2) of contact rate, we classified all parameters into five factors, also marked as βs×m, βf×m, βms, βmf and βmr (see Supplementary B for details). Concretely, we use Latin hypercube sampling (LHS) and partial rank correlation coefficients (PRCCs) [41,42] to study the dependence of the above five factors on daily contact rate and annual model-based basic reproduction number and daily contact rate from 2010 to 2015.

    Firstly, to identify key underlying factors that influenced the HFMD dynamics, we used LHS and PRCCs to examine the sensitivity of the annual model-based reproduction number to the five factors [42,43]. Normal distribution for all input parameters with the mean values and standard deviations was given in Table 5. By substituting the sampled parameters' values into the formulas (7.2-7.6) in Supplementary B, all five factors' values were obtained. Then the annual global PRCCs were calculated between the five factors and the corresponding output variable, i.e., the annual model-based reproduction number.

    Secondly, because the correlation between daily model-free basic reproduction number and daily contact rate has statistical significance, time-varying sensitivity was done between daily contact rate and five factors. Concretely, we still choose all five factors as the input variables, but use the estimated daily contact rate as the output variable. Using similar sampling parameter method as above, time-varying PRCCs were calculated for each factor. Here the sample size Ns is 10000 in both global and time-varying sensitivity analyses. Similar to [41,42], we considered absolute values of PRCC >0.4 as indicating an important or strong correlation between input parameters and output variables, values between 0.2 and 0.4 as moderate or weak correlations, and values between 0 and 0.2 as not significantly different from zero.

    For non-normal distribution data, such as all meteorological factors, median with the corresponding first and third quartiles (Q1-Q3) was reported. Otherwise, Mean ± standard deviation (SD) was presented, such as annual model-free and model-based basic reproduction number. Spearman correlation coefficient was used to measure the correlation between meteorological factors, and the correlation between daily model-free basic reproduction number and contact rate. According to whether the daily model-free basic regeneration number is less than one, we divide the meteorological factors into two groups (Rfree0(day)1 and Rfree0(day)<1), and Mann-Whitney test was used to analyze the difference between the two groups. Furthermore, independent-samples t test was performed to analyze the difference between annual model-free and model-based basic reproduction numbers. In order to compare with the threshold value (one), one-sample t test was performed for both annual model-free and model-based basic reproduction numbers. A two-tail P<0.05 was considered statistically significant.

    Figure 2 showed the estimated daily model-free basic reproduction number (Rfree0(day)) and the reported daily HFMD infectious cases in Wenzhou between 1 January 2010 to 31 December 2015. In every year, we can see that the basic reproduction number of HFMD (blue solid line in Figure 2) began to increase above unit during early March and it usually remained above one for around four months from early March to late June. After that, a rebound of basic reproduction number occurred between September and October in autumn, then after wards fluctuated below one for most of the time during winter. This is consistent with the multiple-peak pattern of HFMD outbreaks, which can be seen from the reported data (orange and green histogram in Figure 2).

    Figure 2.  Estimated daily model-free basic reproduction number (Rfree0(day)) and the reported daily HFMD infectious cases in Wenzhou, 2010-2015. Blue solid line and it's gray shade represent mean and 95 confidence interval (CI) of the daily model-free basic reproduction number. The black dashed line represents the critical basic reproduction number threshold one. The histogram in this figure represents the daily number of reported infectious cases and the orange bars denotes school opening while the green bars represent days in school vacation.

    Figure 3 revealed that daily model-free basic reproduction number changed with school opening days during spring semester and fall semester, respectively. In the early stage of the spring semester, the basic reproduction number began to rise exponentially and quickly exceeded threshold one in no more than half a month (Figure 3A), and it usually peaked around the 30th day after school beginning and then remained above one until about the 120th day. Similarly, at the beginning of the fall semester, the basic reproduction number also grew rapidly and exceeded one in half a month (Figure 3B), and it usually peaked around the 30th day after the beginning of the fall semester and then fell down to less than one in a month. After two months of school beginning, the basic reproduction number began to increase again and reached a peak slightly above one, and then continued to decline through winter.

    Figure 3.  The tendency of daily model-free basic reproduction number during school opening days. (A) Spring semester. (B) Fall semester. Blue dots represent daily model-free basic reproduction number Rfree0(day) per year (from 2010 to 2015). Red dot line and the orange error bars represent it's mean and corresponding standard error of daily model-free basic reproduction number. The black dashed line represents the critical basic reproduction number threshold one.

    Various meteorological factors were found to be inter-related with each other. Table 1 summarized the correlation coefficients between all these factors. It was found that mean temperature, maximum temperature and minimum temperature were highly correlated with each other, with the correlation coefficients larger than 0.90. Moreover, mean relative humidity and minimum relative humidity were also highly interrelated with a correlation coefficient 0.910.

    Table 1.  Spearman correlation coefficient between different meteorological factors.
    Mean TEM Maximum TEM Minimum TEM Mean RHU
    Maximum TEM 0.977
    Minimum TEM 0.988 0.943
    Mean RHU 0.190 0.114 0.265
    Minimum RHU 0.206 0.087 0.295 0.910
    Note: TEM represents temperature; RHU represents relative humidity.

     | Show Table
    DownLoad: CSV

    Table 2 showed the comparison of each meteorological factors between the group of daily model-free reproduction number Rfree0(day)1 and Rfree0(day)<1. There were significant differences in all factors between the two groups (P<0.05). Hence, combining the previous correlation analysis results, we included only mean temperature and mean relative humidity in the dynamic model, and excluded other highly correlated variables.

    Table 2.  Comparison of meteorological factors (Median (Q1, Q3)).
    Parameters Rfree0(day)1 Rfree0(day)<1 P value
    Mean TEM 19.3 (14.4, 23.2) 20.0 (10.1, 27.7) <0.001
    Maximum TEM 23.3 (18.3, 27.2) 23.8 (14.1, 31.2) <0.001
    Minimum TEM 16.8 (11.6, 20.8) 17.1 (7.7, 25.0) <0.001
    Mean RHU 78.5 (68.0, 86.0) 76.0 (68.0, 84.0) <0.001
    Minimum RHU 59.0 (46.0, 70.0) 57.0 (45.0, 68.0) 0.005
    Note: TEM represents temperature; RHU represents relative humidity.

     | Show Table
    DownLoad: CSV

    We employed an adaptive Metropolis-Hastings algorithm to carry out extensive MCMC simulations [38], and to estimate mean values of parameters in the contact rate expression (2.2). Using large sample realization, we fitted the model (2.1) to the data of reported HFMD cases and the fitted parameters are shown in Table 5 in Supplementary C.

    Figure 4 illustrates the best-fit numerical simulation of the model with the fitted parameters, which shows that the model was well fitted to the reported cases, and can provide the overall trend of HFMD infected population in Wenzhou city. Furthermore, the annual model-based basic reproduction number Rmodel0(year) from 2010 to 2015 were given in Table 3. Comparing with the threshold one, we find that all annual model-based and model-free basic reproduction numbers were significantly larger than threshold one, which indicates the consistency of two estimation methods. This suggests that our findings may be a possible mirror of the real transmission of HFMD i.e., HFMD is an endemic disease in Wenzhou city, which is consistent with the relevant studies in other regions of China [29,30,31,33]. However, we can also find that the model-based estimates are usually less than model-free estimates (Table 3), which should arouse our attention and further research in the future.

    Table 3.  Comparison of annual basic reproduction numbers from 2010 to 2015 (mean±SD).
    Year Rfree0(year) Rmodel0(year)
    2010 1.034±0.012 1.026±0.012
    2011 1.153±0.012 1.125±0.012
    2012 1.133±0.012 1.119±0.012
    2013 1.123±0.011 1.112±0.012
    2014 1.149±0.013 1.123±0.012
    2015 1.068±0.012 1.041±0.011
    : P<0.05 represents the comparison with Rfree0(year); : P<0.05 represents the comparison with threshold one

     | Show Table
    DownLoad: CSV
    Figure 4.  Illustration of the fitting result of model (2.1) from January 1st 2010 to December 31th, 2015 under estimated parameters. The solid blue line represents the model-predicted HFMD infected cases and the reported cases are shown as red dots. The gray areas represent the 95% confidence interval of model prediction.

    Taking annual model-based reproduction number as the target output variable, we calculated the PRCCs of all five factors (βs×m, βf×m, βms, βmf and βmr) in contact rate. From Figure 5, we found that all five factors were sensitive to the annual model-based basic reproduction number every year. As expected, the stronger the factor, the greater annual basic reproduction number. In particular, we find that the PRCCs of each factor change little every year, which indicates that each factor has better robustness to the impact of HFMD outbreak. By comparing PRCCs of each factor, we can further conclude that the influence of factors (βs×m, βf×m and βms) are greater than that of factors (βmf and βmr). These may provide potential guidance for HFMD prevention and control in strategy formulation.

    Figure 5.  Illustration of the sensitivity analysis of the annual model-based basic reproduction number to the five factors in contact rate. The gray area represents PRCC value between 0.2 and 0.4 that is moderate correlation. PRCC values higher than the grey area denote strong correlations, while PRCC values lower than the grey area represent no significant correlations.

    Firstly, the correlation between the daily model-free basic reproduction number and the daily model-based contact rate was demonstrated. Figure 6A shows the time series diagram of estimated daily model-free basic reproduction number and model-based contact rate. Furthermore, the results of Spearman correlation analysis indicates that there is a significant correlation between them (ρ=0.446, P<0.05).

    Figure 6.  Illustration of time-varying sensitivity analysis. (A) Time series diagram of estimated daily model-free basic reproduction number Rfree0(day) and model-based contact rate β(t). Blue solid line and the gray shade represent mean value and 95% confidence interval (CI) of Rfree0(day) from 2010 to 2015. Orange, yellow, green, purple and blue shade represent different parts of the daily contact rate, βs×m(t), βf×m(t), βms(t), βmf(t) and βmr(t), respectively. (B) PRCCs between estimated daily contact rate and all five factors over time.

    Due to the positive correlation between them, time-varying analysis is performed through the time-varying PRCCs between the above-mentioned five factors and daily contact rate β(t) with time (Figure 6B). Because the PRCCs of meteorological factor (βmr) is very large during summer vacation, we can naturally conclude that the cases during this period are mainly caused by the effect of meteorological factors. In addition, during the spring semester, the PRCCs of meteorological factor (βms) is increasing gradually, but the PRCCs of interaction factor between school opening and meteorological effect (βs×m) is decreasing gradually, and those PRCCs almost maintain a high level throughout the spring semester. This may be the reason for the observed persistent peak of HFMD outbreaks in spring semester. In autumn semester, the variation trend of PRCCs of βmf and βf×m is similar to βms and βs×m, but the time for the interaction factor to maintain a higher level is obviously shorter than that for the meteorological factors to maintain a higher level. This may be the reason for the observed multiple small peaks in autumn semester. As a result, these may provide a quantitative characterization of the underlying factors in the annual multi-peak pattern of HFMD outbreak.

    Similar to the pattern in other subtropical and tropical regions, HFMD epidemics in Wenzhou occurred at least twice a year. The underlying factors for the annual pattern of HFMD multiple outbreaks have been investigated widely [10,11,12,13,14]. Some studies suggested a strong association between HFMD and weather [11,12]. In Hong Kong, researchers found that HFMD transmission was mainly associated with depletion of susceptible and limited impact were suggested from meteorological factors and school holidays [44]. However, in our study, it is clear that high contact rate was synchronized with the rapid increase of the daily model-free basic reproduction number, especially at the beginning of the school semester (Figure 6A). This pattern may be driven by a new cohort of susceptible children and few infected students entering kindergartens as well as the increase in contact rates among children in the new school semester [44]. Nevertheless, further confirmatory investigation is needed to demonstrate the impact of new students in kindergartens on HFMD transmission.

    Though many studies indicated that meteorological factors play an important role in HFMD transmission [9,12,15,16,17,18,19], this study further find that there are different impact effect in different seasons and their interaction with school opening. Meteorological factors in spring semester, the interaction factor between school opening and meteorological effect, made more significant contributions to HFMD transmission (Figure 5 and 6). Meanwhile, both daily model-free basic reproduction number and contact rate in summer holidays were obviously higher than that in winter holidays (Figure 6A). Those results were consistent with the previous studies that temperature and humidity may jointly affect this childhood disease [45], and such interactive impact needs to be considered when evaluating at different school semesters.

    Based on the whole analysis, we can identify two feasible strategies for efficiently lessening the basic reproduction number, i.e., for containing HFMD epidemics. The first measure is to increase social distance. The transmission of enterovirus and coxsackievirus is most efficient in crowded settings and, therefore, most countries and regions, including Malaysia, Singapore, Taiwan, Hong Kong, and China, have adopted social distancing measures, such as closures of childcare facilities and schools, and cancellation of public functions involving children [46,47]. In our study, the optimum timing for implementation was at the beginning of every school semester when the peer-group at school started to gather together. At this time, as soon as an infected was detected in the childcare facilities and schools, social distancing measures must be immediately implemented. Such control measure may lower the basic reproduction number and decrease the peak HFMD incidence. Secondly, health education focusing on personal hygiene and good sanitation, including frequent hand washing, proper disposal of soiled nappies, and disinfection of soiled surfaces with chlorinated (bleach) disinfectants, should be addressed in the spring semester. There are two possible reasons why we highlight this measure. On the one hand, physical activity of adolescence is lower during winter and increases during warmer months and therefore, weather conditions may be associated with behavioral patterns that lead to increased contact among children, thereby facilitating the spread of HFMD infection [9,48,49]. On the other hand, weather changes have been credited with improving the duration of viral survival and virulence in the environment [50,51,52], and such changes increase the number of opportunities for hosts to become infected as a result of contact with contaminated surfaces, aspiration of contaminated fomites, or inhalation of aerosols produced by the coughs of infected individuals [53,54]. More evidence on the underlying biological mechanism of HFMD transmission is needed to improve the understanding of the potential effect of meteorological factors.

    A few limitations should be considered when interpreting the findings from this study. First, the estimation of model-free basic reproduction number was based on hospitalized HFMD cases and may not reflect the trend of population incidence reliably. This may be the reason why model-free annual basic reproduction number had a minor difference with model-based annual reproduction number. Second, we adopted the dates of summer and winter vacation from the Education Bureau, but some kindergartens started schools earlier. This may partly explain the rebound of model-free basic reproduction number slightly earlier than the start of the school year in September. Finally, despite that we developed a mathematical model to establish causation between HFMD transmission, we may not incorporate all potential driving factors.

    The authors are very grateful to the anonymous referees for their valuable comments and suggestions. This research was supported by the National Natural Science Foundation of P. R. China (Grant Nos. 11771448, 61672013, 61772017) and Huaian Key Laboratory for Infectious Diseases Control and Prevention (HAP201704).

    The authors declare that they have no competing interests.

    Supplementary A: Estimation of the daily and annual model-free basic reproduction number

    Similarly to [37], we assumed that serial interval (the time between the onset of symptoms in a primary case and the onset of symptoms in secondary cases) is equal to the sum of L and D, where L represents the duration of incubation and D denotes the duration of infection. As a result, [55] obtained the probability density function of incubation period of HFMD whose best-fitted function was gamma distribution. Concretely, since the estimated median incubation period was 5.4(95% CI 4.4-6.5) days, based on the parameters in [55], we know the probability density function of incubation L was fIncubation(x)=ba11Γ(a1)xa11eb1x if x0, and fIncubation(x)=0 if x<0, in which a1=6.9637,b1=1.2217.

    In addition, the disability length for symptomatic HFMD or infection was estimated at 5.7(95% CI 5.4-6.0) in [56,57]. Suppose that HFMD infection is also obeys a gamma distribution. Then, based on the parameters in [56,57], the probability density function of infection D was fInfection(x)=ba22Γ(a2)xa21eb2x if x0, and fInfection(x)=0 if x<0, in which a2=1.0264,b2=0.1901.

    Hence the joint probability density function of the sum of incubation period and infection duration (L+D), described as the probability density function of serial interval [26], was given by

    fSI(x)=+0fIncubation(xs)fInfection(s)ds=x0fIncubation(xs)fInfection(s)ds=ba11ba22Γ(a1)Γ(a2)x0(xs)a11eb1(xs)sa21eb2sds. (4.1)

    Due to the difficulty in solving the above integral, we used numerical integration method to obtain the result (see Figure 7). After that, the daily model-free basic reproduction number (Rfree0(day)) can be calculated based on the infected data and the probability density distribution function of serial interval through the method and Ecxel software package "epiEstim" in [26]. Taking the annual average of Rfree0(day), we can obtain the annual model-free basic reproduction number Rfree0(year).

    Figure 7.  Probability density function of incubation, infection and serial interval.

    Supplementary B: Model parameters, initial conditions and contact rate

    B1. Model parameters and initial conditions in model (2.1)

    According to Statistical Year book and Census data from Wenzhou Statistical Bureau [58], the average daily number of new babies from 2010 to 2015 is λ=334.459, and average daily mortality rate is d=1.904×10⁵. Assume that the average daily deaths of people under 14 years old is dN(t), the average daily number of people transferred out due to age growth is cN(t), we can get dNdt=λ(d+c)N. By solving above equation, we obtained that N(t)=λd+c+(N(0)λd+c)e(d+c)t, and N(0) is the initial susceptible. Fortunately, according to the Statistical Year book and Census data from Wenzhou Statistical Bureau, we find that the total population under 14 years in January 1, 2011 and December 31, 2015 is 1305373 and 1355698, respectively. Using these information, we can estimate the values of the parameters with the help of least square method. As a result, c=2.113×10⁴ and N(0)=1292553. Because the number of susceptible is almost equal to total population, we have S(0)=N(0).

    Overall, the definitions and values of all parameters and initial values of model (2.1) are listed in Table 4.

    Table 4.  Parameters and initial values of model (2.1).
    Parameter Definition Source Mean value
    λ Recruitment rate of susceptible (per day) Calculated 334.459
    c Transfer rate due to age growth (day) Calculated 2.11312×10⁴
    d Per capita natural mortality rate (per day) Calculated 1.9040×10⁵
    1/σ Mean incubation period (day) [55] 5.4
    k Quarantined rate (per day) [3] 0.007177
    1/γ1 mean recovery time of an infected person (day) [56] 5.7
    1/γ2 mean quarantined time (day) [3] 16
    δ1 Disease-induced mortality from infectious (per day) [3] 0
    δ2 Disease-induced mortality from quarantine [3] 0.024887
    η Progression rate of the recovered (per day) [3] 0.015
    S(0) Initial value of susceptible Calculated 1292553
    E(0) Initial value of exposed [3] 30
    I(0) Initial value of infectious Reported 81
    Q(0) Initial value of quarantine [3] 46
    R(0) Initial value of recovered [3] 46

     | Show Table
    DownLoad: CSV

    B2. Contact rate

    The contact rate between susceptible and infected, β(t), is a time-varying, continuous, positive function, which is mainly determined by school opening or not, and meteorological factors. The former can be divided into three phases, spring semester, fall semester and vacation (summer and winter vacation), while the mean temperature and relative humidity were selected to represent meteorological factors. For the sake of narrative convenience, several variables are expressed as bellow: δr(t) indicates whether it is the school vacation or not (1 represents school vacation while 0 denotes school opening); δs(t) indicates whether it is the spring semester or not (1 represents spring semester (including the weekend and other short-term holiday during spring semester) while 0 means not); δf(t) indicates whether it is the fall semester or not (1 represents fall semester (including the weekend and other short-term holiday during fall semester) while 0 means not); xs(t) refers to the cumulative opening days of spring semester in one year; xf(t) refers to the cumulative opening days of fall semester in one year. Since we can see from Figure 3 that the both variation between daily model-free basic reproduction number Rfree0(day) and school opening days in spring and fall semesters are similar to the form of probability density function similar of gamma distribution, the effect of the cumulative school opening days on the daily contact rate is defined as ys(t)=xs(t)b11eb2xs(t) in spring semester and yf(t)=xf(t)b31eb4xf(t) in fall semester.

    Since [59,60] points out that there is no time lag effect between temperature and disease outbreak, to normalize the mean temperature per day, T(t) is defined as the average temperature per day divided by 40 because the highest daily mean temperature of Wenzhou city is no more than 40oC. However, [59] indicates that there exists time lag effect between humidity and disease outbreaks. Note that the daily model-free basic reproduction number Rfree0(day) is a measure of the severity of HFMD outbreaks. We first calculate the correlation coefficient ρˉHR(tτ),Rfree0(day) between Rfree0(day) and the measured mean relative humidity with different time lag days ˉHR(tτ), τ=0,1,,30 (Figure 8). Then, according to the magnitude and stationarity of the correlation coefficients, we get that the outbreak of disease at time t is mainly driven by the average relative humidity between t12 and t23 days. Thus, the average relative humidity at time is defined as HR(t)=23τ=12r(τ)ˉHR(tτ), in which r(τ)=ρˉHR(tτ),Rfree0(day)/23s=12ρˉHR(ts),Rfree0(day) is corresponding weight coefficient.

    Figure 8.  The Spearman correlation coefficient between daily model-free basic reproduction number Rfree0(day) and the measured mean relative humidity with different time lag days ˉHR(tτ), τ=0,1,,30.

    In summary, according to the seasonal variation, school opening and their interaction effect, we divide contact rate β(t) approximately into the following five parts:

    (1) the interaction factor between school opening and meteorological effect during spring semester,

    βs×m(t)=ys(t)(b5+b6T(t)+b7HR(t)). (4.2)

    (2) the interaction factor between school opening and meteorological effect during fall semester,

    βf×m(t)=yf(t)(b8+b9T(t)+b10HR(t)). (4.3)

    (3) the meteorological factor during spring semester,

    βms(t)=δs(t)(b11+b12T(t)+b13HR(t)). (4.4)

    (4) the meteorological factor during fall semester,

    βmf(t)=δf(t)(b14+b15T(t)+b16HR(t)). (4.5)

    (5) the meteorological factor during winter and summer holiday,

    βmr(t)=δr(t)(b17+b18T(t)+b19HR(t)). (4.6)

    Therefore, β(t) can be expressed as (2.2) in the main text.

    Supplementary C: Parameter estimation in contact rate

    The variance of measured components, I(t), was given by an inverse gamma distribution with hyper-parameters (0.01,4), where 0.01 is the initial error variance which is updated by the inverse gamma distribution [61], and the small MCMC package provided in this website was used to estimate the parameters. When estimating unknown parameters and initial conditions for model (2.1), the following prior information were given: bi[0,+),i=1,2,3,4 and bj(=,+),j=5,6,,19; the proposed density was chosen to be a multivariate normal distribution. These ranges were used to ensure good convergence of the MCMC chain.

    By fitting model (2.1) to the reported HFMD cases from 2010 to 2015 in Wenzhou city, we estimate mean values of bi,i=1,2,,19, and their standard deviations (SD) in Table 5. Figure 9 is the distribution diagram of each parameter.

    Table 5.  Estimated parameters in contact rate.
    Parameter Mean±SD Parameter Mean±SD
    b1 0.3257±2.3079×10³ b11 0.2683±1.5734×10³
    b2 7.9764×10⁹±6.0361×10⁹ b12 0.3240±2.6312×10³
    b3 2.7990±1.0528×10² b13 0.3737±1.0570×10³
    b4 0.3086±1.0272×10³ b14 0.3377±3.0434×10⁴
    b5 2.5272±1.1446×10² b15 0.0527±2.7698×10⁴
    b6 5.9314±2.0221×10² b16 0.3014±3.8947×10⁴
    b7 1.7517±1.6270×10² b17 0.0788±4.1117×10⁴
    b8 0.5895±7.7061×10³ b18 0.3952±2.1027×10⁴
    b9 0.4353±4.8126×10³ b19 0.0788±4.1117×10⁴
    b10 1.2471±1.5149×10²

     | Show Table
    DownLoad: CSV
    Figure 9.  Distribution of each parameter bi in contact rate based on MCMC analysis, i=1,2,,19. The algorithm runs for 1000000 iterations with a burn-in of 500000 iterations, and the Geweke convergence diagnostic method was employed to assess convergence of chains. The initial values of each parameter were randomly selected within their feasible ranges.

    Supplementary D: Annual model-based basic reproduction number

    According to [40], the annual model-based basic reproduction number Rmodel0(year) of model (2.1) can be defined by the spectral radius of the next infection operator. Note that the disease-free steady state of model (2.1) is E0=(λ/(d+c),0,0,0,0,λ/(d+c)), the contact rate β(t) can be approximated as an annual periodic function and the period is marked as ω. Using the notation and definition in [40], as well as the general calculation procedure in [39], for the approximate periodic model (2.1) we have

    F(t)=(0β(t)0000000),V(t)=(d+σ00σd+δ1+k+γ100kd+δ2+γ2).

    In order to characterize model-based basic reproduction number of model (2.1), we consider the following linear ω-periodic system

    dWdt=(V(t)+F(t)θ)W,tR (4.7)

    with parameter θ(0,). Let W(t,s,θ),ts,sR, be the evolution operator of the system (7.7) on R3. For each θ(0,), the matrix V(t)+F(t)θ is cooperative. Thus, the linear operator W(t,s,θ) is positive in R3 for each ts,sR. By Theorem 2.1 in [40], Rmodel0(year) can be defined as the unique solution of ρ(W(ω,0,θ))=1 and Rmodel0(year)=θ in this case, in which ρ(W(ω,0,θ)) is the spectral radius of W(ω,0,θ).


    [1] W. Peng, N. L. Ma, D. Zhang, Q. Zhou, X. Yue, S. C. Khoo, et al., A review of historical and recent locust outbreaks: Links to global warming, food security and mitigation strategies, Environ. Res., 191 (2020), 110046. https://doi.org/10.1016/j.envres.2020.110046 doi: 10.1016/j.envres.2020.110046
    [2] X. Gao, G. Li, X. Wang, S. Wang, F. Li, Y. Wang, et al., The locust plagues of the Ming and Qing dynasties in the Xiang-E-Gan region, China, Nat. Hazards, 107 (2021), 1149–1165. https://doi.org/10.1007/s11069-021-04622-y doi: 10.1007/s11069-021-04622-y
    [3] H. I. Freedman, G. S. Wolkowicz, Predator-prey systems with group defence: the paradox of enrichment revisited, Bull. Math. Biol., 48 (1986), 493–508. https://doi.org/10.1007/BF02462320 doi: 10.1007/BF02462320
    [4] H. I. Freedman, S. Ruan, Hopf bifurcation in three-species food chain models with group defense, Math. Biosci., 111 (1992), 73–87. https://doi.org/10.1016/0025-5564(92)90079-C doi: 10.1016/0025-5564(92)90079-C
    [5] J. C. Holmes, W. M. Bethel, Modification of intermediate host behaviour by parasites, Zool. J. Linn. Soc., 51 (1972), 123–149.
    [6] A. A. Salih, M. Baraibar, K. K. Mwangi, G. Artan, Climate change and locust outbreak in East Africa, Nat. Clim. Change, 10 (2020), 584–585. https://doi.org/10.1038/s41558-020-0835-8 doi: 10.1038/s41558-020-0835-8
    [7] C. N. Meynard, M. Lecoq, M. P. Chapuis, C. Piou, On the relative role of climate change and management in the current desert locust outbreak in East Africa, Global. Change. Biol., 26 (2020), 3753–3755. https://doi.org/10.1111/gcb.15137 doi: 10.1111/gcb.15137
    [8] M. L. Flint, Integrated Pest Management for Walnuts, 2nd edition, University of California, Oakland, 1987.
    [9] J. C. V. Lenteren, J. Woets, Biological and integrated pest control in greenhouses, Ann. Rev. Entomol, 33 (1988), 239–250. https://doi.org/10.1146/annurev.en.33.010188.001323 doi: 10.1146/annurev.en.33.010188.001323
    [10] S. Y. Tang, Y. Tian, R. A. Cheke, Dynamic complexity of a predator-prey model for IPM with nonlinear impulsive control incorporating a regulatory factor for predator releases, Math. Model. Anal., 24 (2019), 134–154. https://doi.org/10.3846/mma.2019.010 doi: 10.3846/mma.2019.010
    [11] T. T. Yu, Y. Tian, H. J. Guo, X. Song, Dynamical analysis of an integrated pest management predator Cprey model with weak Allee effect, J. Biol. Dyn., 13 (2019), 218–244. https://doi.org/10.1080/17513758.2019.1589000 doi: 10.1080/17513758.2019.1589000
    [12] B. P. Baker, T. A. Green, A. J. Loker, Biological control and integrated pest management in organic and conventional systems, Biol. Control, 140 (2020), 104095. https://doi.org/10.1016/j.biocontrol.2019.104095 doi: 10.1016/j.biocontrol.2019.104095
    [13] J. C. Headley, Defining the Economic Threshold, in Pest Control Strategies for the Future, National Academy of Sciences, (1972), 100–108.
    [14] L. G. Higley, D. J. Boethel, Handbook of Soybean Insect Pests, Entomological Society of America, 1994.
    [15] L. P. Pedigo, S. H. Hutchins, L. G. Higley, Economic injury levels in theory and practice, Ann. Rev. Entomol., 31 (1986), 341–368. https://doi.org/10.1146/annurev.en.31.010186.002013 doi: 10.1146/annurev.en.31.010186.002013
    [16] Y. Tian, K. Sun, L. S. Chen, Geometric approach to the stability analysis of the periodic solution in a semi-continuous dynamic system, Int. J. Biomath., 7 (2014), 1450018. https://doi.org/10.1142/S1793524514500181 doi: 10.1142/S1793524514500181
    [17] S. Y. Tang, W. H. Pang, R. A. Cheke, J. Wu, Global dynamics of a state-dependent feedback control system, Adv. Differ. Equ-Ny, 1 (2015).
    [18] B. Liu, Y. Tian, B. L. Kang, Dynamics on a Holling II predator Cprey model with state-dependent impulsive control, Int. J. Biomath., 5 (2012), 1260006. https://doi.org/10.1142/S1793524512600066 doi: 10.1142/S1793524512600066
    [19] Y. Tian, S. Y. Tang, Dynamics of a density-dependent predator-prey biological system with nonlinear impulsive control, Math. Biosci. Eng., 18 (2021), 7318–7343. https://doi.org/10.3934/mbe.2021362 doi: 10.3934/mbe.2021362
    [20] I. Ullah Khan, S. Ullah, E. Bonyah, B. A. Alwan, A. Alshehri, A state-dependent impulsive nonlinear system with ratio-dependent action threshold for investigating the pest-natural enemy model, Complexity, 2022 (2022), 7903450. https://doi.org/10.1155/2022/7903450 doi: 10.1155/2022/7903450
    [21] V. I. Utkin, Sliding Modes and Their Applications in Variable Structure Systems, Mir Publishers, Moscow, 1994.
    [22] A. F. Filippov, Differential Equations with Discontinuous Righthand Sides, Kluwer Academic Publishers, Dordrecht, 1988.
    [23] V. I. Utkin, Sliding Modes in Control and Optimization, Springer-Verlag, Berlin, 1992.
    [24] Y. A. Kuznetsov, S. Rinaldi, A. Gragnani, One parameter bifurcations in planar Filippov systems, Int. J. Bifurc. Chaos, 13 (2003), 2157–2188. https://doi.org/10.1142/S0218127403007874 doi: 10.1142/S0218127403007874
    [25] W. J. Qin, S. Y. Tang, C. C. Xiang, Y. Yang, Effects of limited medical resource on a Filippov infectious disease model induced by selection pressure, Appl. Math. Comput., 283 (2016), 339–354. https://doi.org/10.1016/j.amc.2016.02.042 doi: 10.1016/j.amc.2016.02.042
    [26] D. Y. Wu, H. Y. Zhao, Y. Yuan, Complex dynamics of a diffusive predator-prey model with strong Allee effect and threshold harvesting, J. Math. Anal. Appl., 469 (2019), 982–1014.
    [27] Y. N. Xiao, X. X. Xu, S. Y. Tang, Sliding mode control of outbreaks of emerging infectious diseases, Bull. Math. Biol., 74 (2012), 2403–2422. https://doi.org/10.1007/s11538-012-9758-5 doi: 10.1007/s11538-012-9758-5
    [28] W. J. Qin, X. W. Tan, X. T. Shi, J. Chen, X. Liu, Dynamics and bifurcation analysis of a Filippov predator-prey ecosystem in a seasonally fluctuating environment, Int. J. Bifurc. Chaos, 29 (2019), 1950020. https://doi.org/10.1142/S0218127419500202 doi: 10.1142/S0218127419500202
    [29] J. Bhattacharyya, P. T. Piiroinen, S. Banerjee, Dynamics of a Filippov predator-prey system with stage-specific intermittent harvesting, Nonlinear Dyn., 105 (2021), 1019–1043. https://doi.org/10.1007/s11071-021-06549-2 doi: 10.1007/s11071-021-06549-2
    [30] K. Enberg, Benefits of threshold strategies and age-selective harvesting in a fluctuating fish stock of Norwegian spring spawning herring Clupea harengus, Mar. Ecol. Prog. Ser., 298 (2005), 277–286. https://doi.org/10.3354/meps298277 doi: 10.3354/meps298277
    [31] V. I. Utkin, J. Guldner, J. X. Shi, Sliding Model Control in Electromechanical Systems, Taylor Francis Group, London, 2009.
    [32] C. Dong, C. Xiang, W. Qin, Y. Yang, Global dynamics for a Filippov system with media effects, Math. Biosci. Eng., 19 (2022), 2835–2852. https://doi.org/10.3934/mbe.2022130 doi: 10.3934/mbe.2022130
    [33] C. Erazo, M. E. Homer, P. T. Piiroinen, M. Bernardo, Dynamic cell mapping algorithm for computing basins of attraction in planar Filippov systems, Int. J. Bifurc. Chaos, 27 (2017), 1730041. https://doi.org/10.1142/S0218127417300415 doi: 10.1142/S0218127417300415
    [34] J. Deng, S. Tang, H. Shu, Joint impacts of media, vaccination and treatment on an epidemic Filippov model with application to COVID-19, J. Theor. Biol., 523 (2021), 110698.
    [35] D. M. Xiao, S. R. Ruan, Codimension two bifurcations in a predator Cprey system with group defense, Int. J. Bifurc. Chaos, 11 (2001), 2123–2131.
    [36] X. Hou, B. Liu, Y. Wang, Z. Zhao, Complex dynamics in a Filippov pest control model with group defense, Int. J. Biomath., 15 (2022), 2250053. https://doi.org/10.1142/S179352452250053X doi: 10.1142/S179352452250053X
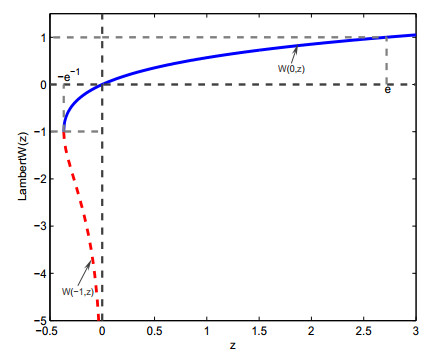
    [37] R. M. Corless, G. H. Gonnet, D. E. G. Hare, D. J. Jeffrey, D. E. Knuth, On the LambertW function, Adv. Comput. Math., 5 (1996), 329–359.
  • This article has been cited by:

    1. Fan Xia, Feng Deng, Hui Tian, Wei He, Yanni Xiao, Xiaodan Sun, Estimation of the reproduction number and identification of periodicity for HFMD infections in northwest China, 2020, 484, 00225193, 110027, 10.1016/j.jtbi.2019.110027
    2. Zuqin Ding, Yong Li, Yongli Cai, Yueping Dong, Weiming Wang, Optimal Control Strategies of HFMD in Wenzhou, China, 2020, 2020, 1076-2787, 1, 10.1155/2020/5902698
    3. Jinyu Wang, Sheng Li, Nonlinear effect of temperature on hand, foot, and mouth disease in Lanzhou, China, 2020, 99, 0025-7974, e23007, 10.1097/MD.0000000000023007
    4. Pussadee Laor, Tawatchai Apidechkul, Siriyaporn Khunthason, Vivat Keawdounglek, Suntorn Sudsandee, Krailak Fakkaew, Weerayuth Siriratruengsuk, Association of environmental factors and high HFMD occurrence in northern Thailand, 2020, 20, 1471-2458, 10.1186/s12889-020-09905-w
    5. Chenxi Dai, Kaifa Wang, Adaptive Weighted Neighbors Method for Sensitivity Analysis, 2022, 14, 1913-2751, 652, 10.1007/s12539-022-00512-4
    6. I. A. Moneim, G. A. Mosa, A realistic model for the periodic dynamics of the hand-foot-and-mouth disease, 2022, 7, 2473-6988, 2585, 10.3934/math.2022145
    7. Zafer BEKİRYAZICI, Saime HASİMOGLU, Comparison of a random model of Hand-Foot-Mouth Disease model with Gaussian and Laplacian parameters, 2021, 2146-538X, 10.17714/gumusfenbil.973990
    8. Chenxi Dai, Dongsheng Zhou, Bo Gao, Kaifa Wang, Eric H. Y. Lau, A new method for the joint estimation of instantaneous reproductive number and serial interval during epidemics, 2023, 19, 1553-7358, e1011021, 10.1371/journal.pcbi.1011021
    9. Aili Wang, Duo Bai, Jingming He, Stacey R. Smith, Optimal control of bi-seasonal hand, foot and mouth disease in mainland China suggests transmission from children and isolating older infected individuals are critical, 2024, 89, 0303-6812, 10.1007/s00285-024-02141-5
    10. Yingying Zhang, Ruohan Wang, Yanan Cai, Atila Bueno, Relaxation Oscillation in SEIR Epidemic Models with the Intrinsic Growth Rate, 2024, 2024, 1076-2787, 10.1155/2024/5373794
  • Reader Comments
  • © 2023 the Author(s), licensee AIMS Press. This is an open access article distributed under the terms of the Creative Commons Attribution License (http://creativecommons.org/licenses/by/4.0)
通讯作者: 陈斌, bchen63@163.com
  • 1. 

    沈阳化工大学材料科学与工程学院 沈阳 110142

  1. 本站搜索
  2. 百度学术搜索
  3. 万方数据库搜索
  4. CNKI搜索

Metrics

Article views(1877) PDF downloads(91) Cited by(1)

Figures and Tables

Figures(9)

Other Articles By Authors

/

DownLoad:  Full-Size Img  PowerPoint
Return
Return

Catalog