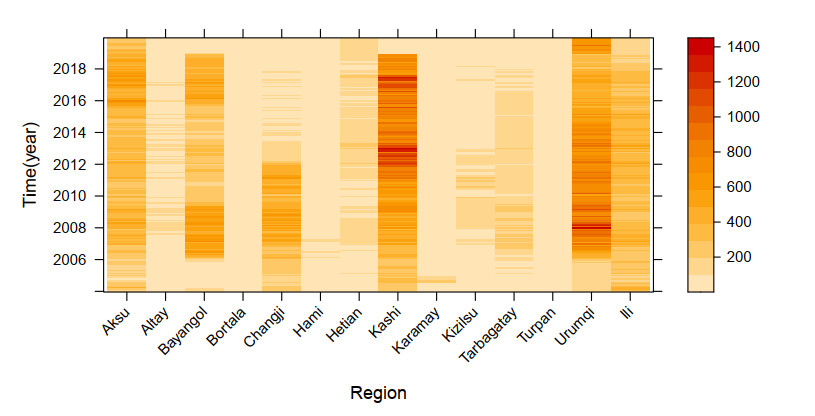
This study aimed to explore the spatio-temporal distribution characteristics and risk factors of hepatitis B (HB) in 14 prefectures of Xinjiang, China, and to provide a relevant reference basis for the prevention and treatment of HB. Based on HB incidence data and risk factor indicators in 14 prefectures in Xinjiang from 2004 to 2019, we explored the distribution characteristics of the risk of HB incidence using global trend analysis and spatial autocorrelation analysis and established a Bayesian spatiotemporal model to identify the risk factors of HB and their spatio-temporal distribution to fit and extrapolate the Bayesian spatiotemporal model using the Integrated Nested Laplace Approximation (INLA) method. There was spatial autocorrelation in the risk of HB and an overall increasing trend from west to east and north to south. The natural growth rate, per capita GDP, number of students, and number of hospital beds per 10, 000 people were all significantly associated with the risk of HB incidence. From 2004 to 2019, the risk of HB increased annually in 14 prefectures in Xinjiang, with Changji Hui Autonomous Prefecture, Urumqi City, Karamay City, and Bayangol Mongol Autonomous Prefecture having the highest rates.
Citation: Yijia Wang, Na Xie, Zhe Wang, Shuzhen Ding, Xijian Hu, Kai Wang. Spatio-temporal distribution characteristics of the risk of viral hepatitis B incidence based on INLA in 14 prefectures of Xinjiang from 2004 to 2019[J]. Mathematical Biosciences and Engineering, 2023, 20(6): 10678-10693. doi: 10.3934/mbe.2023473
This study aimed to explore the spatio-temporal distribution characteristics and risk factors of hepatitis B (HB) in 14 prefectures of Xinjiang, China, and to provide a relevant reference basis for the prevention and treatment of HB. Based on HB incidence data and risk factor indicators in 14 prefectures in Xinjiang from 2004 to 2019, we explored the distribution characteristics of the risk of HB incidence using global trend analysis and spatial autocorrelation analysis and established a Bayesian spatiotemporal model to identify the risk factors of HB and their spatio-temporal distribution to fit and extrapolate the Bayesian spatiotemporal model using the Integrated Nested Laplace Approximation (INLA) method. There was spatial autocorrelation in the risk of HB and an overall increasing trend from west to east and north to south. The natural growth rate, per capita GDP, number of students, and number of hospital beds per 10, 000 people were all significantly associated with the risk of HB incidence. From 2004 to 2019, the risk of HB increased annually in 14 prefectures in Xinjiang, with Changji Hui Autonomous Prefecture, Urumqi City, Karamay City, and Bayangol Mongol Autonomous Prefecture having the highest rates.

| [1] |
Y. P. Yan, H. X. Su, Z. H. Ji, Z. J. Shao, Z. S. Pu, Epidemiology of hepatitis B virus infection in China: Current status and challenges, J. Clin. Transl. Hepatol., 2 (2014), 15–22. https://doi.org/10.14218/JCTH.2013.00030 doi: 10.14218/JCTH.2013.00030

|
| [2] |
R. Zampino, A. Boemio, C. Sagnelli, L. Alessio, L. E. Adinolfi. E. Sagnelli et al., Hepatitis B virus burden in developing countries, World J. Gastroenterol., 21 (2015), 11941–11953. https://doi.org/10.3748/wjg.v21.i42.11941 doi: 10.3748/wjg.v21.i42.11941
|
| [3] |
Y. Jiang, X. Dou, C. Yan, L. Wan, H. C. Liu, M. C. Li, et al., Epidemiological characteristics and trends of notifiable infectious diseases in China from 1986 to 2016, J. Global Health, 10 (2020), 020803. https://doi.org/10.7189/jogh.10.020803 doi: 10.7189/jogh.10.020803
|
| [4] |
Y. Wang, B. Wang, J. Wang, H. Asiya, X. Tang, Q. Zheng, Analysis of morbidity and mortality characteristics of notifiable infectious diseases in Xinjiang, 2019, Bull Dis. Control Prev., 35 (2020), 14–19. https://doi.org/10.13215/j.cnki.jbyfkztb.2006018 doi: 10.13215/j.cnki.jbyfkztb.2006018
|
| [5] | H. Gao, W. Luan, M. Wang, Y. Dong, Epidemic characteristics of main infectious diseases in Yantai city between 2010 and 2012 and prevention strategy research, Pak. J. Pharm. Sci., 29 (2016), 2191–2198. |
| [6] |
H. Wang, P. Men, Y. F. Xiao, P. Gao, M. Lv, Q. L. Yuan, et al., Hepatitis B infection in the general population of China: a systematic review and meta-analysis, BMC Infect. Dis., 19 (2019), 811. https://doi.org/10.1186/s12879-019-4428-y doi: 10.1186/s12879-019-4428-y
|
| [7] | Z. Wang, Y. Liu, R. Zhang, X. Gong, Y. Shi, H. Zhang, Epidemiological characteristics of hepatitis B in China from 2004 to 2013, Chin. Gen. Pract., 20 (2017), 2879–2083. |
| [8] | B. Zhu, J. Liu, Y. Fu, B. Zhang, Y. Mao, Spatio-temporal epidemiology of viral hepatitis in China (2003–2015): Implications for prevention and control policies, Int. J. Environ. Res. Public Health, 15 (2018), 661. |
| [9] |
E. Sagnelli, C. Sagnelli, M. Pisaturo, M. Macera, N. Coppola, Epidemiology of acute and chronic hepatitis B and delta over the last 5 decades in Italy, World J. Gastroenterol., 20 (2014), 7635–7643. https://doi.org/10.3748/wjg.v20.i24.7635 doi: 10.3748/wjg.v20.i24.7635
|
| [10] |
E. Ochola, P. Ocama, C. G. Orach, Z. K. Nankinga, J. N. Kalyango, W. McFarland, et al., High burden of hepatitis B infection in Northern Uganda: results of a population-based survey, BMC Public Health, 13 (2013), 727. https://doi.org/10.1186/1471-2458-13-727 doi: 10.1186/1471-2458-13-727
|
| [11] | H. Kinfe, E. G. Sendo, K. B. Gebremedhin, Prevalence of hepatitis B virus infection and factors associated with hepatitis B virus infection among pregnant women presented to antenatal care clinics at Adigrat General Hospital in Northern Ethiopia, Int. J. Women's Health, 13 (2021), 119–127. |
| [12] |
M. Zhang, J. Ge, Z. Lin, The impact of the number of Hospital beds and spatial heterogeneity on an SIS epidemic model, Acta Appl. Math., 167 (2020), 59–73. https://doi.org/10.1007/s10440-019-00268-y doi: 10.1007/s10440-019-00268-y
|
| [13] |
K. Liu, S. Yang, Q. Zhou, Y. Qiao, Spatiotemporal evolution and spatial network analysis of the urban ecological carrying capacity in the Yellow River basin, Int. J. Environ. Res. Public Health, 19 (2021), 229. https://doi.org/10.3390/ijerph19010229 doi: 10.3390/ijerph19010229
|
| [14] |
Y. H. Xu, Z. L. Yang, Specification tests for temporal heterogeneity in spatial panel data models with fixed effects, Reg. Sci. Urban Econ., 81 (2020), 103488. https://doi.org/10.1016/j.regsciurbeco.2019.103488 doi: 10.1016/j.regsciurbeco.2019.103488
|
| [15] |
H. Rue, S. Martino, N. Chopin, Approximate Bayesian inference for latent Gaussian models by using integrated nested Laplace approximations, J. R. Stat. Soc. B, 71 (2009), 319–392. https://doi.org/10.1111/j.1467-9868.2008.00700.x doi: 10.1111/j.1467-9868.2008.00700.x
|
| [16] |
Y. Fong, H. Rue, J. Wakefield, Bayesian inference for generalized linear mixed models, Biostatistics, 11 (2010), 397–412. https://doi.org/10.1093/biostatistics/kxp053 doi: 10.1093/biostatistics/kxp053
|
| [17] |
L. Grilli, S. Meteli, C. Rampichini, Bayesian estimation with integrated nested Laplace approximation for binary logit mixed models, J. Stat. Comput. Simul., 85 (2015), 2718–2726. https://doi.org/10.1080/00949655.2014.935377 doi: 10.1080/00949655.2014.935377
|
| [18] |
X. L. Sun, B. Minasny, H. L. Wang, Y. G. Zhao, G. L. Zhang, Y. J. Wu, Spatiotemporal modelling of soil organic matter changes in Jiangsu, China between 1980 and 2006 using INLA-SPDE, Geoderma, 384 (2021), 114808. https://doi.org/10.1016/j.geoderma.2020.114808 doi: 10.1016/j.geoderma.2020.114808
|
| [19] |
M. C. Rufener, P. G. Kinas, M. F. Nobrega, L. D. F. Oliveira, Bayesian spatial predictive models for data-poor fisheries, Ecol. Modell., 348 (2017), 125–134. https://doi.org/10.1016/j.ecolmodel.2017.01.022 doi: 10.1016/j.ecolmodel.2017.01.022
|
| [20] |
N. Lezama-Ochoa, M. G. Pennino, M. A. Hall, J. Lopez, H. Murua, Using a Bayesian modelling approach (INLA-SPDE) to predict the occurrence of the Spinetail Devil Ray (Mobular mobular), Sci. Rep., 10 (2020), 18822. https://doi.org/10.1038/s41598-020-73879-3 doi: 10.1038/s41598-020-73879-3
|
| [21] |
I. T. Vlad, P. Juan, J. Mateu, Bayesian spatio-temporal prediction of cancer dynamics, Comput. Math. Appl., 70 (2015), 857–868. https://doi.org/10.1016/j.camwa.2015.06.006 doi: 10.1016/j.camwa.2015.06.006
|
| [22] |
J. H. Froelicher, G. Forjaz, P. S. Rosenberg, P. Chernyavskiy, Geographic disparities of breast cancer incidence in Portugal at the district level: A spatial age-period-cohort analysis, 1998–2011, Cancer Epidemiol., 74 (2021), 102009. https://doi.org/10.1016/j.canep.2021.102009 doi: 10.1016/j.canep.2021.102009
|
| [23] |
B. Rowland, S. P. Rushton, M. D. F. Shirley, M. A. Brown, G. E. Budge, Identifying the climatic drivers of honeybee disease in England and Wales, Sci. Rep., 11 (2021), 21953. https://doi.org/10.1038/s41598-021-01495-w doi: 10.1038/s41598-021-01495-w
|
| [24] |
S. Y. Bie, X. J. Hu, H. G. Zhang, K. Wang, Z. Dou, Influential factors and spatial-temporal distribution of tuberculosis in mainland China, Sci. Rep., 11 (2021), 6274. https://doi.org/10.1038/s41598-021-85781-7 doi: 10.1038/s41598-021-85781-7
|
| [25] |
H. Rue, S. Martino, Approximate Bayesian inference for hierarchical Gaussian Markov random field models, J. Stat. Plann. Inference, 137 (2007), 3177–3192. https://doi.org/10.1016/j.jspi.2006.07.016 doi: 10.1016/j.jspi.2006.07.016
|
| [26] |
N. Aral, H, Bakir, Spatio-temporal pattern of COVID-19 outbreak in Turkey, GeoJournal, 2022 (2022), 1–12. https://doi.org/10.1007/s10708-022-10666-9 doi: 10.1007/s10708-022-10666-9
|
| [27] |
J. Abellan, S. Richardson, N. Best, Use of space-time models to investigate the stability of patterns of disease, Environ. Health Perspect., 116 (2008), 1111–1119. https://doi.org/10.1289/ehp.10814 doi: 10.1289/ehp.10814
|
| [28] | A. B. Lawson, Bayesian Disease Mapping: Hierarchical Modeling in Spatial Epidemiology, 3rd edition, Chapman and Hall/CRC, 2018. |
| [29] |
L. K. Held, J. Besag, Modelling risk from a disease in time and space, Stat. Med., 17 (1998), 2045–2060. https://doi.org/10.1002/(SICI)1097-0258(19980930)17:18<2045::AID-SIM943>3.0.CO;2-P doi: 10.1002/(SICI)1097-0258(19980930)17:18<2045::AID-SIM943>3.0.CO;2-P
|
| [30] |
J. Teng J, S. Ding, H. Zhang, K. Wang, X. Hu, Bayesian spatiotemporal modelling analysis of hemorrhagic fever with renal syndrome outbreaks in China using R-INLA, Zoonoses Public Health, 70 (2023), 46–57. https://doi.org/10.1111/zph.12999 doi: 10.1111/zph.12999
|
| [31] |
L. H. Knorr, Bayesian modelling of inseparable space time variation in disease risk, Stat. Med., 19 (2000), 2555–2567. https://doi.org/10.1002/1097-0258(20000915/30)19:17/18<2555::AID-SIM587>3.0.CO;2-%23 doi: 10.1002/1097-0258(20000915/30)19:17/18<2555::AID-SIM587>3.0.CO;2-%23
|
| [32] | X. Wang, Y. R. Ryan, J. J. Faraway, Bayesian Regression Modeling with INLA, Taylor & Francis Group an Informa Business, Chapman and Hall/CRC, (2018), 77–79. https://doi.org/10.1201/9781351165761 |
| [33] |
L. Bernardinelli, D. Clayton, C. Pascutto, C. Montomoli, M. Ghislandi, M. Songini, Bayesian analysis of space-time variation in disease risk, Stat. Med., 14 (1995), 2433–2443. https://doi.org/10.1002/sim.4780142112 doi: 10.1002/sim.4780142112
|
| [34] |
W. Sun, J. Gong, J. Zhou, Y. Zhao, J. Tan, A. N. Ibrahim, et al., Spatial, social and environmental study of tuberculosis in China using statistical and GIS technology, Int. J. Environ. Res. Public Health, 12 (2015), 1425–1448. https://doi.org/10.3390/ijerph120201425 doi: 10.3390/ijerph120201425
|
| [35] |
X. Ma, X. F. Luo, L. Li, Y. Li, G. Q. Sun, The influence of mask use on the spread of COVID-19 during pandemic in New York City, Results Phys., 34 (2022), 105224. https://doi.org/10.1016/j.rinp.2022.105224 doi: 10.1016/j.rinp.2022.105224
|
| [36] |
G. Q. Sun, H. T. Zhang, L. L. Chang, Z. Jin, H. Wang, S. G. Ruan, On the dynamics of a diffusive foot-and-mouth disease model with nonlocal infections, SIAM J. Appl. Math., 82 (2022), 1587–1610. https://doi.org/10.1137/21M141299 doi: 10.1137/21M141299
|
| [37] |
X. Liang, S. Bi, W. Yang, L. Wang, G. Cui, F. Cui, et al., Epidemiological serosurvey of hepatitis B in China declining HBV prevalence due to hepatitis B vaccination, Vaccine, 27 (2009), 6550–6557. https://doi.org/10.1016/j.vaccine.2009.08.048 doi: 10.1016/j.vaccine.2009.08.048
|
| [38] |
F. Cui, L. Shen, L. Li, H. Wang, F. Wang, S. Bi, et al., Prevention of chronic hepatitis B after 3 decades of escalating vaccination policy, China, Emerging Infect. Dis., 23 (2017), 765–772. https://doi.org/10.3201/eid2305.161477 doi: 10.3201/eid2305.161477
|
| [39] | Z. Y. Gong, Global trends in the progress of routine vaccination against hepatitis B in early childhood in 2003, Dis. Surveillance, 19 (2004), 113–115. |
| [40] | X. Ma, G. Q. Sun, Z. H. Wang, Y. M. Chu, Z. Jin, B. L. Li, Transmission dynamics of brucellosis in Jilin province, China: Effects of different control measures, Commun. Nonlinear Sci. Numer. Simul., 114 (2022), 106702. |
| [41] | H. L. Li, X. L. Zhang, K. Wang, A quantitative study on the epidemic situation of tuberculosis based on thetransmission disease dynamics in 14 prefectures of Xinjiang from 2005 to 2017, Chin. J. Infect. Control, 17 (2018), 945–950. |
| [42] |
J. Liu, W. Liang, W. Jing, M. Liu, Countdown to 2030: eliminating hepatitis B disease, China, Bull World Health Organ, 97 (2019), 230–238. https://doi.org/10.2471/BLT.18.219469 doi: 10.2471/BLT.18.219469
|


Figures(3) / Tables(5)

Yijia Wang, Na Xie, Zhe Wang, Shuzhen Ding, Xijian Hu, Kai Wang. Spatio-temporal distribution characteristics of the risk of viral hepatitis B incidence based on INLA in 14 prefectures of Xinjiang from 2004 to 2019[J]. Mathematical Biosciences and Engineering, 2023, 20(6): 10678-10693. doi: 10.3934/mbe.2023473


 DownLoad: