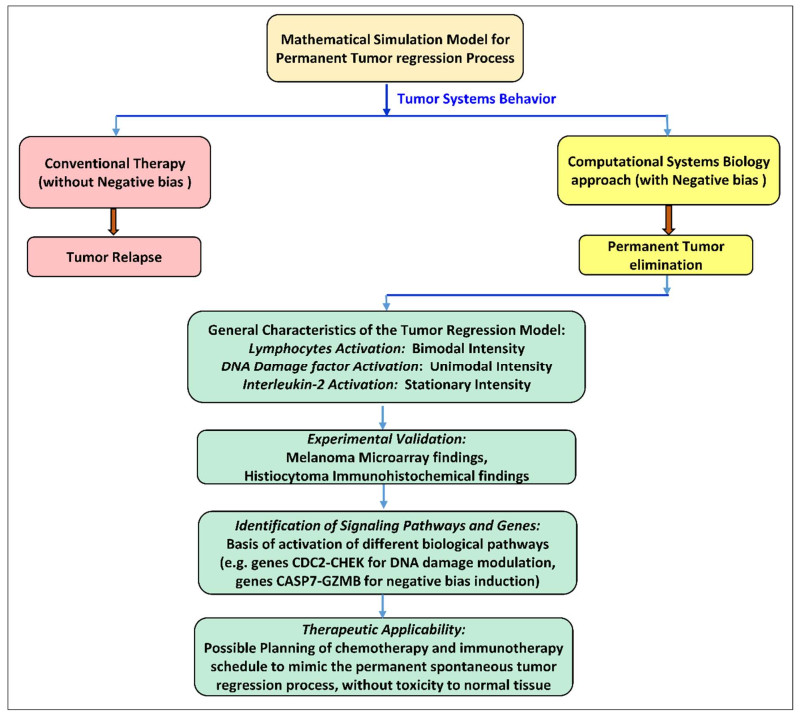
Complete spontaneous tumor regression (without treatment) is well documented to occur in animals and humans as epidemiological analysis show, whereby the malignancy is permanently eliminated. We have developed a novel computational systems biology model for this unique phenomenon to furnish insight into the possibility of therapeutically replicating such regression processes on tumors clinically, without toxic side effects. We have formulated oncological informatics approach using cell-kinetics coupled differential equations while protecting normal tissue. We investigated three main tumor-lysis components: (ⅰ) DNA blockade factors, (ⅱ) Interleukin-2 (IL-2), and (ⅲ) Cytotoxic T-cells (CD8+ T). We studied the temporal variations of these factors, utilizing preclinical experimental investigations on malignant tumors, using mammalian melanoma microarray and histiocytoma immunochemical assessment. We found that permanent tumor regression can occur by: 1) Negative-Bias shift in population trajectory of tumor cells, eradicating them under first-order asymptotic kinetics, and 2) Temporal alteration in the three antitumor components (DNA replication-blockade, Antitumor T-lymphocyte, IL-2), which are respectively characterized by the following patterns: (a) Unimodal Inverted-U function, (b) Bimodal M-function, (c) Stationary-step function. These provide a time-wise orchestrated tri-phasic cytotoxic profile. We have also elucidated gene-expression levels corresponding to the above three components: (ⅰ) DNA-damage G2/M checkpoint regulation [genes: CDC2-CHEK], (ⅱ) Chemokine signaling: IL-2/15 [genes: IL2RG-IKT3], (ⅲ) T-lymphocyte signaling (genes: TRGV5-CD28). All three components quantitatively followed the same activation profiles predicted by our computational model (Smirnov-Kolmogorov statistical test satisfied, α = 5%). We have shown that the genes CASP7-GZMB are signatures of Negative-bias dynamics, enabling eradication of the residual tumor. Using the negative-biasing principle, we have furnished the dose-time profile of equivalent therapeutic agents (DNA-alkylator, IL-2, T-cell input) so that melanoma tumor may therapeutically undergo permanent extinction by replicating the spontaneous tumor regression dynamics.
Citation: Bindu Kumari, Chandrashekhar Sakode, Raghavendran Lakshminarayanan, Prasun K. Roy. Computational systems biology approach for permanent tumor elimination and normal tissue protection using negative biasing: Experimental validation in malignant melanoma as case study[J]. Mathematical Biosciences and Engineering, 2023, 20(5): 9572-9606. doi: 10.3934/mbe.2023420
Complete spontaneous tumor regression (without treatment) is well documented to occur in animals and humans as epidemiological analysis show, whereby the malignancy is permanently eliminated. We have developed a novel computational systems biology model for this unique phenomenon to furnish insight into the possibility of therapeutically replicating such regression processes on tumors clinically, without toxic side effects. We have formulated oncological informatics approach using cell-kinetics coupled differential equations while protecting normal tissue. We investigated three main tumor-lysis components: (ⅰ) DNA blockade factors, (ⅱ) Interleukin-2 (IL-2), and (ⅲ) Cytotoxic T-cells (CD8+ T). We studied the temporal variations of these factors, utilizing preclinical experimental investigations on malignant tumors, using mammalian melanoma microarray and histiocytoma immunochemical assessment. We found that permanent tumor regression can occur by: 1) Negative-Bias shift in population trajectory of tumor cells, eradicating them under first-order asymptotic kinetics, and 2) Temporal alteration in the three antitumor components (DNA replication-blockade, Antitumor T-lymphocyte, IL-2), which are respectively characterized by the following patterns: (a) Unimodal Inverted-U function, (b) Bimodal M-function, (c) Stationary-step function. These provide a time-wise orchestrated tri-phasic cytotoxic profile. We have also elucidated gene-expression levels corresponding to the above three components: (ⅰ) DNA-damage G2/M checkpoint regulation [genes: CDC2-CHEK], (ⅱ) Chemokine signaling: IL-2/15 [genes: IL2RG-IKT3], (ⅲ) T-lymphocyte signaling (genes: TRGV5-CD28). All three components quantitatively followed the same activation profiles predicted by our computational model (Smirnov-Kolmogorov statistical test satisfied, α = 5%). We have shown that the genes CASP7-GZMB are signatures of Negative-bias dynamics, enabling eradication of the residual tumor. Using the negative-biasing principle, we have furnished the dose-time profile of equivalent therapeutic agents (DNA-alkylator, IL-2, T-cell input) so that melanoma tumor may therapeutically undergo permanent extinction by replicating the spontaneous tumor regression dynamics.

| [1] |
L. T. H. Phi, I. N. Sari, Y. G. Yang, S. H. Lee, N. Jun, K. S. Kim, et al., Cancer Stem Cells (CSCs) in Drug Resistance and their Therapeutic Implications in Cancer Treatment, Stem Cells Int., 2018 (2018), 16. https://doi.org/10.1155/2018/5416923 doi: 10.1155/2018/5416923

|
| [2] |
C. J. Wheeler, A. Das, G. Liu, J. S. Yu, K. L. Black, Clinical responsiveness of glioblastoma multiforme to chemotherapy after vaccination, Clin. Cancer Res., 10 (2004), 5316–5326. https://doi.org/10.1158/1078-0432.CCR-04-0497 doi: 10.1158/1078-0432.CCR-04-0497
|
| [3] |
R. A. Fenstermaker, M. J. Ciesielski, Immunotherapeutic strategies for malignant glioma, Cancer Cont., 11 (2004), 181–191. https://doi.org/10.1177/107327480401100306 doi: 10.1177/107327480401100306
|
| [4] |
P. H. Zahl, P. C. Gøtzsche, J. Mæhlen, Natural history of breast cancers detected in the Swedish mammography screening programme: a cohort study, Lancet Oncol., 12 (2011), 1118–1124, https://doi.org/10.1016/S1470-2045(11)70250-9 doi: 10.1016/S1470-2045(11)70250-9
|
| [5] |
D. G. Fryback, N. K. Stout, M. A. Rosenberg, A. Trentham-Dietz, V. Kuruchittham, P. L. Remington, The Wisconsin breast cancer epidemiology simulation model, J. Natl. Cancer Inst. Monogr., 2006 (2006), 37–47, https://doi.org/10.1093/jncimonographs/lgj007 doi: 10.1093/jncimonographs/lgj007
|
| [6] | T. C. Everson, Spontaneous regression of cancer, Prog. Clin. Cancer, 3 (1967), 79–95. |
| [7] | "Spontaneous regression of cancer" or "Spontaneous remission of cancer", PubMed, (2022). Available from: https://pubmed.ncbi.nlm.nih.gov/?term = sponteneous+regression+of+cancer+or+sponteneous+remission+of+cancer. |
| [8] | H. E. Kaiser, Biological viewpoints of neoplastic regression, In Vivo, 8 (1994), 155–165. |
| [9] | M. C. Perry, D. C. Doll, C. E. Freter, The Chemotherapy Sourcebook, Lippincott Williams & Wilkins, Philadelphia, 2012. |
| [10] |
D. D. Majumder, P. K. Roy, Cancer self‐remission and tumour instability–a cybernetic analysis Towards a fresh paradigm for cancer treatment, Kybernetes, 29 (2000), 896–927. https://doi.org/10.1108/03684920010342035 doi: 10.1108/03684920010342035
|
| [11] | M. Eisen, Mathematical Models in Cell Biology and Cancer Chemotherapy, Lecture Notes in Biomathematics, Springer Berlin, Heidelberg. https://doi.org/10.1007/978-3-642-93126-0 |
| [12] |
A. J. Coldman, J. H. Goldie, A stochastic model for the origin and treatment of tumors containing drug-resistant cells, Bull. Math. Biol., 48 (1986), 279–292. https://doi.org/10.1007/BF02459682 doi: 10.1007/BF02459682
|
| [13] |
H. E. Skipper, On mathematical modeling of critical variables in cancer treatment, Bull. Math. Biol., 48 (1986), 253–278. https://doi.org/10.1007/BF02459681 doi: 10.1007/BF02459681
|
| [14] |
N. Bellomo, L. Preziosi, Modelling and mathematical problems related to tumor evolution and its interaction with the immune system, Math. Comput. Model., 32 (2000), 413–452, https://doi.org/10.1016/S0895-7177(00)00143-6 doi: 10.1016/S0895-7177(00)00143-6
|
| [15] |
C. M. Sakode, R. Padhi, S. Kapoor, V. P. S. Rallabandi, P. K. Roy, Multimodal therapy for complete regression of malignant melanoma using constrained nonlinear optimal dynamic inversion, Biomed. Signal Process. Control, 13 (2014), 198–211, https://doi.org/10.1016/j.bspc.2014.04.010 doi: 10.1016/j.bspc.2014.04.010
|
| [16] |
I. Osińska, K. Popko, U. Demkow, Perforin: an important player in immune response, Cent. Eur. J. Immunol., 39 (2014), 109–115. https://doi.org/10.5114/ceji.2014.42135 doi: 10.5114/ceji.2014.42135
|
| [17] |
M. Bots, J. P. Medema, Granzymes at a glance, J. Cell. Sci., 119 (2006), 5011–5014. https://doi.org/10.1242/jcs.03239 doi: 10.1242/jcs.03239
|
| [18] | H. F. Lodish, A. Berk, C. A. Kaiser, C. Kaiser, M. Krieger, Molecular Cell Biology, 4th edition, Macmillan, New York, 2000. |
| [19] | A. Bruce, B. Dennis, L. Julian, Molecular Biology of the Cell (Second Edition), Garland Science, New York, (2006). |
| [20] |
J. S. Orange, Formation and function of the lytic NK-cell immunological synapse, Nat. Rev. Immunol., 8 (2008), 713–725. https://doi.org/10.1038/nri2381 doi: 10.1038/nri2381
|
| [21] |
M. R. Jenkins, G. M. Griffiths, The synapse and cytolytic machinery of cytotoxic T cells, Curr. Opin. Immunol., 22 (2010), 308–313. https://doi.org/10.1016/j.coi.2010.02.008 doi: 10.1016/j.coi.2010.02.008
|
| [22] | Spontaneous cancer regression of melanoma, PubMed, (2022). Available from: https://pubmed.ncbi.nlm.nih.gov/?term = spontaneous+cancer+regression+of+melanoma. |
| [23] |
K. Blessing, K. M. McLaren, Histological regression in primary cutaneous melanoma: recognition, prevalence and significance, Histopathology, 20 (1992), 315–322. https://doi.org/10.1111/j.1365-2559.1992.tb00988.x doi: 10.1111/j.1365-2559.1992.tb00988.x
|
| [24] |
S. Ribero, M. R. Gualano, S. Osella-Abate, Association of histologic regression in primary melanoma with sentinel lymph node status: A systematic review and meta-analysis, JAMA Dermatol., 151 (2015), 1301–1307. https://doi.org/10.1001/jamadermatol.2015.2235 doi: 10.1001/jamadermatol.2015.2235
|
| [25] | Editorial, Melanoma research gathers momentum, Lancet, 385 (2015), 2323. |
| [26] | I. G. Vladimirova, Thermodynamics of Biological Processes, Boston: De Gruyter, Berlin, 1978. https://doi.org/10.1515/9783110860511-027 |
| [27] |
T. Z. Biktimirov, A. A. Butov, Y. G. Savinov, Optimal control of the moment of spontaneous tumor regression, Automat. Remote Cont., 66 (2005), 658–663. https://doi.org/10.1007/s10513-005-0108-z doi: 10.1007/s10513-005-0108-z
|
| [28] |
N. Kondo, A. Takahashi, K. Ono, DNA damage induced by alkylating agents and repair pathways, J. Nucleic Acids, 2010 (2010). https://doi.org/10.4061/2010/543531 doi: 10.4061/2010/543531
|
| [29] |
E. C. Friedberg, L. D. McDaniel, R. A. Schultz, The role of endogenous and exogenous DNA damage and mutagenesis, Curr. Opin Genet. Dev., 14 (2004), 5–10. https://doi.org/10.1016/j.gde.2003.11.001 doi: 10.1016/j.gde.2003.11.001
|
| [30] |
G. P. Dunn, A. T. Bruce, H. Ikeda, L. J. Old, R. D. Schreiber, Cancer immunoediting: from immunosurveillance to tumor escape, Nat. Immunol., 3 (2002), 991–998. https://doi.org/10.1038/ni1102-991 doi: 10.1038/ni1102-991
|
| [31] |
G. P. Dunn, L. J. Old, R. D. Schreiber, The immunobiology of cancer immunosurveillance and immunoediting, Immunity, 21 (2004), 137–148. https://doi.org/10.1016/j.immuni.2004.07.017 doi: 10.1016/j.immuni.2004.07.017
|
| [32] |
M. Ewend, R. Thompson, R. Anderson, A. K. Sills, K. Staveley-O'Carroll, B. M. Tyler, et al., Intracranial paracrine interleukin-2 therapy stimulates prolonged antitumor immunity that extends outside the central nervous system, J. Immunother., 2 (2000), 435–448. https://doi.org/10.1097/00002371-200007000-00007 doi: 10.1097/00002371-200007000-00007
|
| [33] |
L. G. de Pillis, W. Gu, A. E. Radunskaya, Mixed immunotherapy and chemotherapy of tumors: modeling, applications and biological interpretations, J. Theor. Biol., 238 (2006), 841–862, https://doi.org/10.1016/j.jtbi.2005.06.037 doi: 10.1016/j.jtbi.2005.06.037
|
| [34] |
V. A. Kuznetsov, I. L. Makalkin, M. A. Taylor, A. S. Perelson, Nonlinear dynamics of immunogenic tumors: Parameter estimation and global bifurcation analysis, Bull. Math. Biol., 56 (1994), 295–321. https://doi.org/10.1007/BF02460644 doi: 10.1007/BF02460644
|
| [35] |
D. Kirschner, J. C. Panetta, Modeling immunotherapy of the tumor-immune interaction. J. Math. Biol., 37 (1998), 235–252, https://doi.org/10.1007/s002850050127 doi: 10.1007/s002850050127
|
| [36] |
L. G. de Pillis, A. E. Radunskaya, C. L. Wiseman, A validated mathematical model of cell-mediated immune response to tumor growth, Cancer Res., 65 (2005), 7950–7958, https://doi.org/10.1158/0008-5472.CAN-05-0564 doi: 10.1158/0008-5472.CAN-05-0564
|
| [37] |
P. K. Roy, R. Kozma, D. D. Majumder, From neurocomputation to immunocomputation-a model and algorithm for fluctuation-induced instability and phase transition in biological systems, IEEE Trans. Evol. Comput., 6 (2002), 292–305, https://doi.org/10.1109/TEVC.2002.1011542 doi: 10.1109/TEVC.2002.1011542
|
| [38] |
S. Singh, R. Padhi, Automatic path planning and control design for autonomous landing of UAVs using dynamic inversion, Am. Control Conf., 2009 (2009), 2409–2414. https://doi.org/10.1109/ACC.2009.5160444 doi: 10.1109/ACC.2009.5160444
|
| [39] | H. Khalil, Nonlinear Systems, 2th edition, in Prentice-Hall, New Jersey, 1996. |
| [40] |
S. Nanda, H. Moore, S. Lenhart, Optimal control of treatment in a mathematical model of chronic myelogenous leukemia, Math. Biosci., 210 (2007), 143–156, https://doi.org/10.1016/j.mbs.2007.05.003 doi: 10.1016/j.mbs.2007.05.003
|
| [41] |
F. Rambow, G. Piton, S. Bouet, J. J. Leplat, S. Baulande, A. Marrau, et al., Gene expression signature for spontaneous cancer regression in melanoma pigs, Neoplasia, 10 (2008), 714–726, https://doi.org/10.1593/neo.08344 doi: 10.1593/neo.08344
|
| [42] | Analyze your own microarray data in R/Bioconductor-BITS wiki., 2022. Available from: https://wiki.bits.vib.be/index.php/Analyze_your_own_microarray_data_in_R/Bioconductor. |
| [43] |
D. M. Ugo, Does the cell number 10(9) still really fit one gram of tumor tissue?, Cell Cycle, 8 (2009), 505–506. https://doi.org/10.4161/cc.8.3.7608 doi: 10.4161/cc.8.3.7608
|
| [44] |
J. Foo, F. Michor, Evolution of acquired resistance to anti-cancer therapy, J. Theor. Biol., 355 (2014), 10–20, https://doi.org/10.1016/j.jtbi.2014.02.025 doi: 10.1016/j.jtbi.2014.02.025
|
| [45] | A. I. Zotin, Thermodynamic Bases of Biological Processes: Physiological Reactions and Adaptations, Walter de Gruyter, Berlin, (1990). https://doi.org/10.1515/9783110849974 |
| [46] |
K. A. Smith, Interleukin-2: inception, impact, and implications, Science, 240 (1988), 1169–1176, https://doi.org/10.1126/science.3131876 doi: 10.1126/science.3131876
|
| [47] | S. Ratner, Mechanisms of Lymphocyte Extravasation, 1st edition, S. Karger, Basel, 1992. |
| [48] |
I. Rousalova, E. Krepela, Granzyme B-induced apoptosis in cancer cells and its regulation. Int. J. Oncol., 37 (2010), 1361–1378, https://doi.org/10.3892/ijo_00000788 doi: 10.3892/ijo_00000788
|
| [49] |
A. Khar., Mechanisms involved in natural killer cell mediated target cell death leading to spontaneous tumour regression, J. Biosci., 22 (1997), 23–31, https://doi.org/10.1007/BF02703615 doi: 10.1007/BF02703615
|
| [50] |
Q. Gao, G. Zhou, S. J. Lin, R. Paus, Z. C. Yue, How chemotherapy and radiotherapy damage the tissue: Comparative biology lessons from feather and hair models, Exp. Dermatol, 28 (2019), 413–418. https://doi.org/10.1111/exd.13846 doi: 10.1111/exd.13846
|
| [51] |
C. Yarana, D. K.St. Clair, Chemotherapy-induced tissue injury: An insight into the role of extracellular vesicles-mediated oxidative stress responses, Antioxidants (Basel), 6 (2017), 75. https://doi.org/10.3390/antiox6040075 doi: 10.3390/antiox6040075
|
| [52] |
A. Z. Ayob, T. S. Ramasamy, Cancer stem cells as key drivers of tumour progression, J. Biomed. Sci., 25 (2018), 20. https://doi.org/10.1186/s12929-018-0426-4 doi: 10.1186/s12929-018-0426-4
|
| [53] |
M. E. Dudley, J. R. Wunderlich, P. F. Robbins, J. C. Yang, P. Hwu, D. J. Schwartzentruber, et al., Cancer regression and autoimmunity in patients after clonal repopulation with antitumor lymphocytes, Science, 298 (2002), 850–854, https://doi.org/10.1126/science.1076514 doi: 10.1126/science.1076514
|
| [54] |
M. L. Disis, H. Bernhard, E. M. Jaffee, Use of tumour-responsive T cells as cancer treatment, Lancet, 373 (2009), 673–683. https://doi.org/10.1016/S0140-6736(09)60404-9 doi: 10.1016/S0140-6736(09)60404-9
|
| [55] |
A. Radbruch, A. Thiel, Cell therapy for autoimmune diseases: does it have a future, Ann. Rheum. Dis., 63 (2004), 96–101. http://dx.doi.org/10.1136/ard.2004.028340 doi: 10.1136/ard.2004.028340
|
| [56] |
N. Sengupta, T. S. MacFie, T. T. MacDonald, D. Pennington, A. R. Silver, Cancer immunoediting and "spontaneous" tumor regression, Pathol. Res. Pract., 206 (2010), 1–8. https://doi.org/10.1016/j.prp.2009.10.001 doi: 10.1016/j.prp.2009.10.001
|
| [57] |
R. Martin, K. L. Teo, Optimal control of drug administration in cancer chemotherapy, World Sci., 1993 (1993), 204. https://doi.org/10.1142/2048 doi: 10.1142/2048
|
 mbe-20-05-420 supplementary.pdf mbe-20-05-420 supplementary.pdf |
 |


Figures(17) / Tables(2)

Bindu Kumari, Chandrashekhar Sakode, Raghavendran Lakshminarayanan, Prasun K. Roy. Computational systems biology approach for permanent tumor elimination and normal tissue protection using negative biasing: Experimental validation in malignant melanoma as case study[J]. Mathematical Biosciences and Engineering, 2023, 20(5): 9572-9606. doi: 10.3934/mbe.2023420


 DownLoad: