LTB4 receptor 1 (LTB4R), as the high affinity leukotriene B4 receptor, is rapidly revealing its function in malignancies. However, it is still uncertain.
We investigated the expression pattern and prognostic significance of LTB4R in pan-cancer across different databases, including ONCOMINE, PrognoScan, GEPIA, and Kaplan-Meier Plotter, in this study. Meanwhile, we explored the significance of LTB4R in tumor metastasis by HCMDB. Then functional enrichment analysis of related genes was performed using GeneMANIA and DAVID. Lastly, utilizing the TIMER datasets, we looked into the links between LTB4R expression and immune infiltration in malignancies.
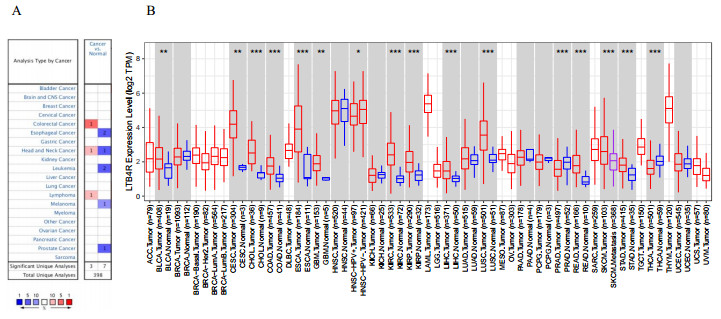
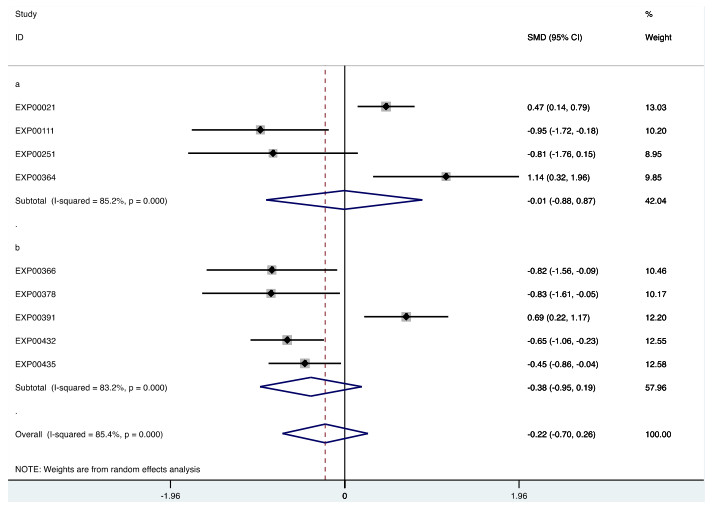
In general, tumor tissue displayed higher levels of LTB4R expression than normal tissue. Although LTB4R had a negative influence on pan-cancer, a high expression level of LTB4R was protective of LIHC (liver hepatocellular carcinoma) patients' survival. There was no significant difference in the distribution of LTB4R between non-metastatic and metastatic tumors. Based on Gene Set Enrichment Analysis, LTB4R was implicated in pathways involved in inflammation, immunity, metabolism, and cancer diseases. The correlation between immune cells and LTB4R was found to be distinct across cancer types. Furthermore, markers of infiltrating immune cells, such as Treg, T cell exhaustion and T helper cells, exhibited different LTB4R-related immune infiltration patterns.
The LTB4R is associated with immune infiltrates and can be used as a prognostic biomarker in pan-cancer.
Citation: Sidan Long, Shuangshuang Ji, Kunmin Xiao, Peng Xue, Shijie Zhu. Prognostic and immunological value of LTB4R in pan-cancer[J]. Mathematical Biosciences and Engineering, 2021, 18(6): 9336-9356. doi: 10.3934/mbe.2021459
LTB4 receptor 1 (LTB4R), as the high affinity leukotriene B4 receptor, is rapidly revealing its function in malignancies. However, it is still uncertain.
We investigated the expression pattern and prognostic significance of LTB4R in pan-cancer across different databases, including ONCOMINE, PrognoScan, GEPIA, and Kaplan-Meier Plotter, in this study. Meanwhile, we explored the significance of LTB4R in tumor metastasis by HCMDB. Then functional enrichment analysis of related genes was performed using GeneMANIA and DAVID. Lastly, utilizing the TIMER datasets, we looked into the links between LTB4R expression and immune infiltration in malignancies.
In general, tumor tissue displayed higher levels of LTB4R expression than normal tissue. Although LTB4R had a negative influence on pan-cancer, a high expression level of LTB4R was protective of LIHC (liver hepatocellular carcinoma) patients' survival. There was no significant difference in the distribution of LTB4R between non-metastatic and metastatic tumors. Based on Gene Set Enrichment Analysis, LTB4R was implicated in pathways involved in inflammation, immunity, metabolism, and cancer diseases. The correlation between immune cells and LTB4R was found to be distinct across cancer types. Furthermore, markers of infiltrating immune cells, such as Treg, T cell exhaustion and T helper cells, exhibited different LTB4R-related immune infiltration patterns.
The LTB4R is associated with immune infiltrates and can be used as a prognostic biomarker in pan-cancer.

| [1] |
H. Zhao, L. Wu, G. Yan, Y. Chen, M. Zhou, Y. Wu, et al., Inflammation and tumor progression: Signaling pathways and targeted intervention, Signal Transduct. Target Ther., 6 (2021), 263. doi: 10.1038/s41392-021-00658-5

|
| [2] |
W. Tang, Z. Chen, W. Zhang, Y. Cheng, B. Zhang, F. Wu, et al., The mechanisms of sorafenib resistance in hepatocellular carcinoma: theoretical basis and therapeutic aspects, Signal Transduct. Target Ther., 5 (2020), 87. doi: 10.1038/s41392-020-0187-x
|
| [3] |
C. Aloe, H. Wang, R. Vlahos, L. Irving, D. Steinfort, S. Bozinovski, Emerging and multifaceted role of neutrophils in lung cancer, Transl. Lung Cancer Res., 10 (2021), 2806–2818. doi: 10.21037/tlcr-20-760
|
| [4] |
T. Yokomizo, T. Izumi, K. Chang, Y. Takuwa, T. Shimizu, A G-protein-coupled receptor for leukotriene B4 that mediates chemotaxis, Nature, 387 (1997), 620–624. doi: 10.1038/42506
|
| [5] |
R. He, Y. Chen, Q. Cai, The role of the LTB4-BLT1 axis in health and disease, Pharmacol. Res., 158 (2020), 104857. doi: 10.1016/j.phrs.2020.104857
|
| [6] | G. Y. Moore, G. P. Pidgeon, Cross-talk between cancer cells and the tumour microenvironment: The role of the 5-lipoxygenase pathway, Int. J. Mol. Sci., 18 (2017). |
| [7] |
M. Bäck, D. X. Bu, R. Bränström, Y. Sheikine, Z. Q. Yan, G. K. Hansson, Leukotriene B4 signaling through NF-kappaB-dependent BLT1 receptors on vascular smooth muscle cells in atherosclerosis and intimal hyperplasia, Proc. Natl. Acad. Sci. U S A, 102 (2005), 17501–17506. doi: 10.1073/pnas.0505845102
|
| [8] |
H. Qiu, A. S. Johansson, M. Sjöström, M. Wan, O. Schröder, J. Palmblad, et al., Differential induction of BLT receptor expression on human endothelial cells by lipopolysaccharide, cytokines, and leukotriene B4, Proc. Natl. Acad. Sci. U S A, 103 (2006), 6913–6918. doi: 10.1073/pnas.0602208103
|
| [9] |
K. Goodarzi, M. Goodarzi, A. M. Tager, A. D. Luster, U. H. von Andrian, Leukotriene B4 and BLT1 control cytotoxic effector T cell recruitment to inflamed tissues, Nat. Immunol., 4 (2003), 965–973. doi: 10.1038/ni972
|
| [10] |
K. A. Lundeen, B. Sun, L. Karlsson, A. M. Fourie, Leukotriene B4 receptors BLT1 and BLT2: expression and function in human and murine mast cells, J. Immunol., 177 (2006), 3439–3447. doi: 10.4049/jimmunol.177.5.3439
|
| [11] |
A. Del Prete, W. H. Shao, S. Mitola, G. Santoro, S. Sozzani, B. Haribabu, Regulation of dendritic cell migration and adaptive immune response by leukotriene B4 receptors: a role for LTB4 in up-regulation of CCR7 expression and function, Blood, 109 (2007), 626–631. doi: 10.1182/blood-2006-02-003665
|
| [12] |
V. R. Jala, S. R. Bodduluri, S. R. Satpathy, Z. Chheda, R. K. Sharma, B. Haribabu, The yin and yang of leukotriene B(4) mediated inflammation in cancer, Semin Immunol., 33 (2017), 58–64. doi: 10.1016/j.smim.2017.09.005
|
| [13] |
L. Hui, Y. Chen, Tumor microenvironment: Sanctuary of the devil, Cancer Lett., 368 (2015), 7–13. doi: 10.1016/j.canlet.2015.07.039
|
| [14] | W. Zou, J. D. Wolchok, L. Chen, PD-L1 (B7-H1) and PD-1 pathway blockade for cancer therapy: Mechanisms, response biomarkers, and combinations, Sci. Transl. Med., 8 (2016), 328–324. |
| [15] |
D. R. Rhodes, S. Kalyana-Sundaram, V. Mahavisno, R. Varambally, J. Yu, B. B. Briggs, et al., Oncomine 3.0: Genes, pathways, and networks in a collection of 18,000 cancer gene expression profiles, Neoplasia, 9 (2007), 166–180. doi: 10.1593/neo.07112
|
| [16] |
G. Zheng, Y. Ma, Y. Zou, A. Yin, W. Li, D. Dong, HCMDB: The human cancer metastasis database, Nucleic Acids Res., 46 (2018), D950–D955. doi: 10.1093/nar/gkx1008
|
| [17] |
H. Mizuno, K. Kitada, K. Nakai, A. Sarai, PrognoScan: A new database for meta-analysis of the prognostic value of genes, BMC Med. Genom., 2 (2009), 18. doi: 10.1186/1755-8794-2-18
|
| [18] |
Á. Nagy, A. Lánczky, O. Menyhárt, B. Győrffy, Validation of miRNA prognostic power in hepatocellular carcinoma using expression data of independent datasets, Sci. Rep., 8 (2018), 9227. doi: 10.1038/s41598-018-27521-y
|
| [19] |
Z. Tang, C. Li, B. Kang, G. Gao, C. Li, Z. Zhang, GEPIA: A web server for cancer and normal gene expression profiling and interactive analyses, Nucleic Acids Res., 45 (2017), W98–W102. doi: 10.1093/nar/gkx247
|
| [20] |
D. Warde-Farley, S. L. Donaldson, O. Comes, K. Zuberi, R. Badrawi, P. Chao, et al., The GeneMANIA prediction server: biological network integration for gene prioritization and predicting gene function, Nucleic Acids Res., 38 (2010), W214–W220. doi: 10.1093/nar/gkq537
|
| [21] |
Y. Zhou, B. Zhou, L. Pache, M. Chang, A. H. Khodabakhshi, O. Tanaseichuk, et al., Metascape provides a biologist-oriented resource for the analysis of systems-level datasets, Nat. Commun., 10 (2019), 1523. doi: 10.1038/s41467-019-09234-6
|
| [22] |
G. Dennis Jr, B. T. Sherman, D. A. Hosack, J. Yang, W. Gao, H. C. Lane, et al., DAVID: Database for annotation, visualization, and integrated discovery, Genome Biol., 4 (2003), P3. doi: 10.1186/gb-2003-4-5-p3
|
| [23] |
B. Li, E. Severson, J. C. Pignon, H. Zhao, T. Li, J. Novak, et al., Comprehensive analyses of tumor immunity: Implications for cancer immunotherapy, Genome Biol., 17 (2016), 174. doi: 10.1186/s13059-016-1028-7
|
| [24] |
J. K. Rhee, Y. C. Jung, K. R. Kim, J. Yoo, J. Kim, Y. J. Lee, et al., Impact of tumor purity on immune gene expression and clustering analyses across multiple cancer types, Cancer Immunol. Res., 6 (2018), 87–97. doi: 10.1158/2326-6066.CIR-17-0201
|
| [25] |
X. Chen, S. Sood, C. S. Yang, N. Li, Z. Sun, Five-lipoxygenase pathway of arachidonic acid metabolism in carcino-genesis and cancer chemoprevention, Curr. Cancer Drug Targets, 6 (2006), 613–622. doi: 10.2174/156800906778742451
|
| [26] |
K. A. Hilliard, V. A. Blaho, C. D. Jackson, C. R. Brown, Leukotriene B4 receptor BLT1 signaling is critical for neutrophil apoptosis and resolution of experimental Lyme arthritis, FASEB J., 34 (2020), 2840–2852. doi: 10.1096/fj.201902014R
|
| [27] |
T. Nagatake, S. I. Hirata, T. Koga, E. Kuroda, S. Kobari, H. Suzuki, et al., BLT1 mediates commensal bacteria-dependent innate immune signals to enhance antigen-specific intestinal IgA responses, Mucosal Immunol., 12 (2019), 1082–1091. doi: 10.1038/s41385-019-0175-z
|
| [28] |
P. A. Jänne, L. Paz-Ares, Y. Oh, C. Eschbach, V. Hirsh, N. Enas, et al., Randomized, double-blind, phase Ⅱ trial comparing gemcitabine-cisplatin plus the LTB4 antagonist LY293111 versus gemcitabine-cisplatin plus placebo in first-line non-small-cell lung cancer, J. Thorac. Oncol., 9 (2014), 126–131. doi: 10.1097/JTO.0000000000000037
|
| [29] |
T. Baetz, E. Eisenhauer, L. Siu, M. MacLean, K. Doppler, W. Walsh, et al., A phase I study of oral LY293111 given daily in combination with irinotecan in patients with solid tumours, Invest New Drugs, 25 (2007), 217–225. doi: 10.1007/s10637-006-9021-8
|
| [30] |
H. H. Wu, X. Yan, Z. Chen, G. W. Du, X. J. Bai, K. Tuoheti, et al., GNRH1 and LTB4R might be novel immune-related prognostic biomarkers in clear cell renal cell carcinoma (ccRCC), Cancer Cell Int., 21 (2021), 354. doi: 10.1186/s12935-021-02052-1
|
| [31] | N. G. Naydenov, S. Lechuga, E. H. Huang, A. I. Ivanov, Myosin Motors: Novel Regulators and Therapeutic Targets in Colorectal Cancer, Cancers (Basel)., 13 (2021). |
| [32] |
R. K. Sharma, Z. Chheda, V. R. Jala, B. Haribabu, Expression of leukotriene B4 receptor-1 on CD8+ T cells is required for their migration into tumors to elicit effective antitumor immunity, J. Immunol., 191 (2013), 3462–3470. doi: 10.4049/jimmunol.1300967
|
| [33] |
Z. S. Chheda, R. K. Sharma, V. R. Jala, A. D. Luster, B. Haribabu, Chemoattractant Receptors BLT1 and CXCR3 Regulate Antitumor Immunity by Facilitating CD8+ T Cell Migration into Tumors, J. Immunol., 197 (2016), 2016–2026. doi: 10.4049/jimmunol.1502376
|
| [34] |
J. Galon, A. Costes, F. Sanchez-Cabo, A. Kirilovsky, B. Mlecnik, C. Lagorce-Pagès, et al., Type, density, and location of immune cells within human colorectal tumors predict clinical outcome, Science, 313 (2006), 1960–1964. doi: 10.1126/science.1129139
|
| [35] |
H. Ohnishi, N. Miyahara, A. Dakhama, K. Takeda, S. Mathis, B. Haribabu, et al., Corticosteroids enhance CD8+ T cell-mediated airway hyperresponsiveness and allergic inflammation by upregulating leukotriene B4 receptor 1, J. Allergy Clin. Immunol., 121 (2008), 864–871. doi: 10.1016/j.jaci.2008.01.035
|
| [36] |
A. Giladi, I. Amit, Single-cell genomics: A stepping stone for future immunology discoveries, Cell, 172 (2018), 14–21. doi: 10.1016/j.cell.2017.11.011
|
| [37] |
E. Papalexi, R. Satija, Single-cell RNA sequencing to explore immune cell heterogeneity, Nat. Rev. Immunol., 18 (2018), 35–45. doi: 10.1038/nri.2017.76
|
 mbe-18-06-459 sup1 immune infiltrates in the majority of cancer types 1.png mbe-18-06-459 sup1 immune infiltrates in the majority of cancer types 1.png

|

|
mbe-18-06-459 sup2 immune infiltrates in the majority of cancer types 2.png

|
|


Figures(8) / Tables(3)

Sidan Long, Shuangshuang Ji, Kunmin Xiao, Peng Xue, Shijie Zhu. Prognostic and immunological value of LTB4R in pan-cancer[J]. Mathematical Biosciences and Engineering, 2021, 18(6): 9336-9356. doi: 10.3934/mbe.2021459


 DownLoad: