Metastasis-Associated in Colon Cancer 1(MACC1) is a validated biomarker for metastasis and is linked to survival. Although extensive experimental evidence indicates an association between MACC1 and diverse cancers, no pan-cancer analyses have yet been performed for this marker, and the role of MACC1 in immunology remains unknown.
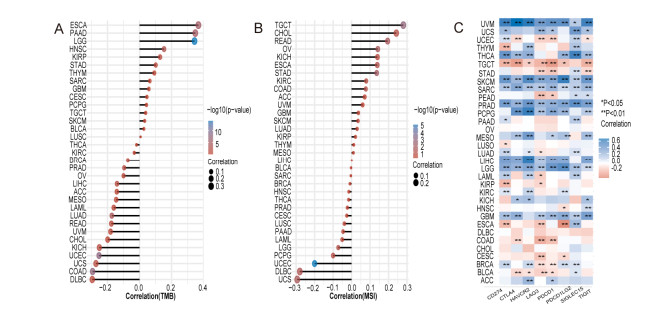
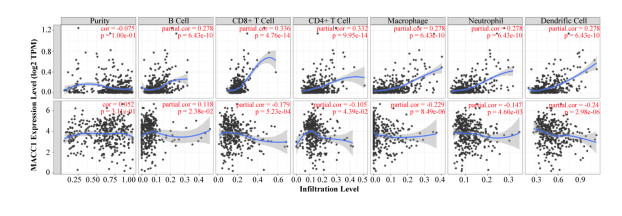
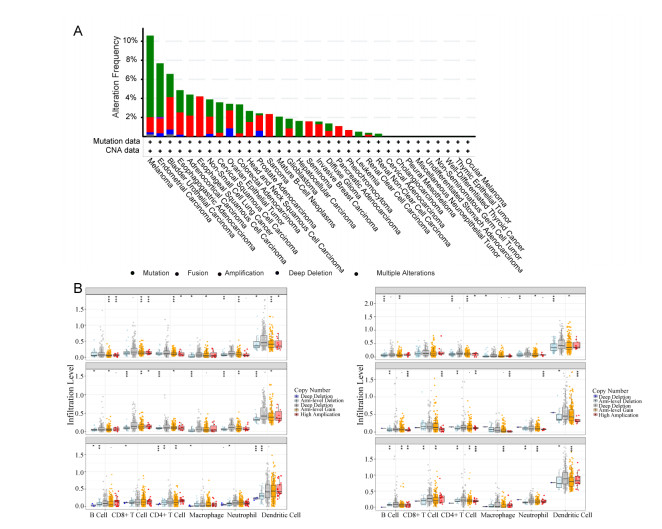
In our study, we performed the analysis of MACC1 expression and its influence on prognosis using multiple databases, including TIMER2, GEPIA2, Kaplan-Meier plotter. MACC1 promoter methylation levels were evaluated using the UALCAN database. Based on the TCGA database, we explored the relationship between MACC1 and tumor mutational burden (TMB), microsatellite instability (MSI), immune checkpoints using the R programming language. We evaluated the association between MACC1 and immune infiltration via TIMER and UALCAN.
Our results revealed that abnormal DNA methylation may be an important cause for the different expression of MACC1 across cancer types. Meanwhile, we explored the potential oncogenic roles of MACC1 and found significant prognostic value. MACC1 may be related to T-cell function and the polarization of tumor-associated macrophages, especially in STAD and LGG. Its expression was associated with immune infiltration and was found to be closely related to immune checkpoint-associated genes, especially CD274 and SIGLEC15, indicating that MACC1 may be a potential immune therapeutic target for several malignancies. Our paper reveals for the first time the relationship between MACC1 and cancer immunology.
MACC1 might act as a predictor for the immune response in cancer patients, and could also represent a new potential immunotherapeutic target.
Citation: Ye Hu, Meiling Wang, Kainan Wang, Jiyue Gao, Jiaci Tong, Zuowei Zhao, Man Li. A potential role for metastasis-associated in colon cancer 1 (MACC1) as a pan-cancer prognostic and immunological biomarker[J]. Mathematical Biosciences and Engineering, 2021, 18(6): 8331-8353. doi: 10.3934/mbe.2021413
Metastasis-Associated in Colon Cancer 1(MACC1) is a validated biomarker for metastasis and is linked to survival. Although extensive experimental evidence indicates an association between MACC1 and diverse cancers, no pan-cancer analyses have yet been performed for this marker, and the role of MACC1 in immunology remains unknown.
In our study, we performed the analysis of MACC1 expression and its influence on prognosis using multiple databases, including TIMER2, GEPIA2, Kaplan-Meier plotter. MACC1 promoter methylation levels were evaluated using the UALCAN database. Based on the TCGA database, we explored the relationship between MACC1 and tumor mutational burden (TMB), microsatellite instability (MSI), immune checkpoints using the R programming language. We evaluated the association between MACC1 and immune infiltration via TIMER and UALCAN.
Our results revealed that abnormal DNA methylation may be an important cause for the different expression of MACC1 across cancer types. Meanwhile, we explored the potential oncogenic roles of MACC1 and found significant prognostic value. MACC1 may be related to T-cell function and the polarization of tumor-associated macrophages, especially in STAD and LGG. Its expression was associated with immune infiltration and was found to be closely related to immune checkpoint-associated genes, especially CD274 and SIGLEC15, indicating that MACC1 may be a potential immune therapeutic target for several malignancies. Our paper reveals for the first time the relationship between MACC1 and cancer immunology.
MACC1 might act as a predictor for the immune response in cancer patients, and could also represent a new potential immunotherapeutic target.

| [1] |
L. A. Salas, K. C. Johnson, D. C. Koestler, D. E. O'Sullivan, B. C. Christensen, Integrative epigenetic and genetic pan-cancer somatic alteration portraits, Epigenetics, 12 (2017), 561-574. doi: 10.1080/15592294.2017.1319043

|
| [2] |
S. Xie, C. Shen, M. Tan, M. Li, X. Song, C. Wang, Systematic analysis of gene expression alterations and clinical outcomes of adenylate cyclase-associated protein in cancer, Oncotarget, 8 (2017), 27216-27239. doi: 10.18632/oncotarget.16111
|
| [3] |
M. W. Ball, M. A. Gorin, C. G. Drake, H. J. Hammers, M. E. Allaf, The Landscape of Whole-genome Alterations and Pathologic Features in Genitourinary Malignancies: An Analysis of the Cancer Genome Atlas, Eur. Urol. Focus, 3 (2017), 584-589. doi: 10.1016/j.euf.2017.01.007
|
| [4] | J. Fridlyand, A. M. Snijders, B. Ylstra, H. Li, A. Olshen, R. Segraves, et al., Breast tumor copy number aberration phenotypes and genomic instability, BMC Cancer, 6 (2016), 96. |
| [5] | U. Stein, W. Walther, F. Arlt, H. Schwabe, J. Smith, I. Fichtner, et al., MACC1, a newly identified key regulator of HGF-MET signaling, predicts colon cancer metastasis, Nat. Med., 15 (2009), 59-67. |
| [6] | A. Shirahata, W. Fan, K. Sakuraba, K. Yokomizo, T. Goto, H. Mizukami, et al., MACC 1 as a Marker for Vascular Invasive Hepatocellular Carcinoma, Anticancer Res., 31 (2011), 777-780. |
| [7] |
G. Wang, M. X. Kang, W. J. Lu, Y. Chen, B. Zhang, Y. L. Wu, MACC1: A potential molecule associated with pancreatic cancer metastasis and chemoresistance, Oncol. Lett, 4 (2012), 783-791. doi: 10.3892/ol.2012.784
|
| [8] |
H. Shimokawa, H. Uramoto, T. Onitsuka, C. Guang, T. Hanagiri, T. Oyama, et al., Overexpression of MACC1 mRNA in lung adenocarcinoma is associated with postoperative recurrence, J. Thorac. Cardiovasc Surg., 141 (2011), 895-898. doi: 10.1016/j.jtcvs.2010.09.044
|
| [9] |
R. T. Zhang, H. R. Shi, Z. M. Chen, Q. H. Wu, F. Ren, H. L. Huang, Effects of metastasis-associated in colon cancer 1 inhibition by small hairpin RNA on ovarian carcinoma OVCAR-3 cells, J. Exp. Clin. Can. Res., 30 (2011), 83. doi: 10.1186/1756-9966-30-83
|
| [10] |
Y. B. Huang, H. Z. Zhang, J. C. Cai, L. S. Fang, J. H. Wu, C. S. Ye, et al., Overexpression of MACC1 and Its significance in human Breast Cancer Progression, Cell Biosci., 3 (2013), 16. doi: 10.1186/2045-3701-3-16
|
| [11] |
T. H. Yang, M. Kon, J. H. Hung, C. Delisi, Combinations of newly confirmed Glioma-Associated loci link regions on chromosomes 1 and 9 to increased disease risk, BMC Med. Genom., 4 (2011), 63. doi: 10.1186/1755-8794-4-63
|
| [12] |
J. Barbazan, Y. Dunkel, H. Y. Li, U. Nitsche, K. P. Janssen, K. Messer, et al., Prognostic Impact of Modulators of G proteins in Circulating Tumor Cells from Patients with Metastatic Colorectal Cancer, Sci. Rep.-Uk, 6 (2016), 22112. doi: 10.1038/srep22112
|
| [13] |
A. Pichorner, U. Sack, D. Kobelt, I. Kelch, F. Arlt, J. Smith, et al., In vivo imaging of colorectal cancer growth and metastasis by targeting MACC1 with shRNA in xenografted mice, Clin. Exp. Metastas., 29 (2012), 573-583. doi: 10.1007/s10585-012-9472-6
|
| [14] | Z. Wu, R. Zhou, Y. Su, S. Li, Y. Liao, W. Liao, Prognostic Value of MACC1 in Digestive System Neoplasms: A Systematic Review and Meta-Analysis., BioMed. Res. Int., 2015 (2015), 252043. |
| [15] |
G. Wang, Z. Fu, D. Li, MACC1 overexpression and survival in solid tumors: a meta-analysis, Tumour. Biol., 36 (2015), 1055-1065. doi: 10.1007/s13277-014-2736-9
|
| [16] |
Y. Jin, K. Zhou, W. Zhao, R. Han, X. Huo, F. Yang, et al., Clinicopathological and prognostic significance of metastasis-associated in colon cancer-1 in gastric cancer: A meta-analysis, Int. J. Biol. Markers, 34 (2019), 27-32. doi: 10.1177/1724600818813634
|
| [17] |
M. Uhlen, L. Fagerberg, B. M. Hallstrom, C. Lindskog, P. Oksvold, A. Mardinoglu, et al., Proteomics., Tissue-based map of the human proteome, Science, 347 (2015), 1260419. doi: 10.1126/science.1260419
|
| [18] | T. Li, J. Fu, Z. Zeng, D. Cohen, J. Li, Q. Chen, et al., TIMER2.0 for analysis of tumor-infiltrating immune cells, Nucleic Acids Res., 48 (2020), W509-W514. |
| [19] |
D. S. Chandrashekar, B. Bashel, S. A. Balasubramanya, C. J. Creighton, I. P. Rodrigues, B. V. Chakravarthi, et al., UALCAN: A Portal for Facilitating Tumor Subgroup Gene Expression and Survival Analyses, Neoplasia, 19 (2017), 649-658. doi: 10.1016/j.neo.2017.05.002
|
| [20] |
Z. Tang, B. Kang, C. Li, T. Chen, Z. Zhang, GEPIA2: an enhanced web server for large-scale expression profiling and interactive analysis, Nucleic Acids Res., 47 (2019), W556-W560. doi: 10.1093/nar/gkz430
|
| [21] |
M. Yarchoan, A. Hopkins, E. M. Jaffee, Tumor Mutational Burden and Response Rate to PD-1 Inhibition, N Eng. J. Med., 377 (2017), 2500-2501. doi: 10.1056/NEJMc1713444
|
| [22] | T. Krieger, I. Pearson, J. Bell, J. Doherty, P. Robbins, Targeted literature review on use of tumor mutational burden status and programmed cell death ligand 1 expression to predict outcomes of checkpoint inhibitor treatment, Diagn. Pathol., 15 (2010), 6. |
| [23] | T. W. Li, J. Y. Fan, B. B. Wang, N. Traugh, Q. M. Chen, J. S. Liu, et al., TIMER: A Web Server for Comprehensive Analysis of Tumor-Infiltrating Immune Cells, Cancer Res., 77 (2019), E108-E110. |
| [24] |
E. Cerami, J. Gao, U. Dogrusoz, B. E. Gross, S. O. Sumer, B. A. Aksoy, et al., The cBio cancer genomics portal: an open platform for exploring multidimensional cancer genomics data, Cancer Discov., 2 (2012), 401-404. doi: 10.1158/2159-8290.CD-12-0095
|
| [25] |
J. Budczies, K. Kluck, W. Walther, Decoding and targeting the molecular basis of MACC1-driven metastatic spread: Lessons from big data mining and clinical-experimental approaches, Semin. Cancer Biol., 60 (2020), 365-379. doi: 10.1016/j.semcancer.2019.08.010
|
| [26] | D. W. Sun, Y. Y. Zhang, Y. Qi, G. Q. Liu, Y. G. Chen, J. Ma, et al., Prognostic and clinicopathological significance of MACC1 expression in hepatocellular carcinoma patients: a meta-analysis, Int. J. Clin. Exp. Med., 8 (2015), 4769-4777. |
| [27] |
Y. Zhao, C. Dai, M. Wang, H. F. Kang, S. Lin, P. T. Yang, et al., Clinicopathological and prognostic significance of metastasis-associated in colon cancer-1 (MACC1) overexpression in colorectal cancer: a meta-analysis, Oncotarget, 7 (2016), 62966-62975. doi: 10.18632/oncotarget.11287
|
| [28] |
F. X. Schaub, V. Dhankani, A. C. Berger, M. Trivedi, A. B. Richardson, R. Shaw, et al., Pan-cancer Alterations of the MYC Oncogene and Its Proximal Network across the Cancer Genome Atlas, Cell Syst., 6 (2018), 282. doi: 10.1016/j.cels.2018.03.003
|
| [29] | L. J. Wang, L. Y. Fan, H. Y. Xu, H. Y. Jiang, Prognostic significance of the expression of metastasis-associated in colon cancer-1 in gynecologic cancers and breast cancer A protocol for systematic review and meta-analysis, Medicine, 100 (2021). |
| [30] | A. Shirahata, K. Shinmura, Y. Kitamura, K. Sakuraba, K. Yokomizo, T. Goto, et al., MACC1 as a Marker for Advanced Colorectal Carcinoma, Anticancer Res., 30(2010), 2689-2692. |
| [31] |
A. Stewart, E. A. Coker, S. Palsterl, A. Georgiou, A. R. Minchom, S. Carreira, et al., Differences in Signaling Patterns on PI3K Inhibition Reveal Context Specificity in KRAS-Mutant Cancers, Mol. Cancer Ther., 18 (2019), 1396-1404. doi: 10.1158/1535-7163.MCT-18-0727
|
| [32] |
P. B. Chapman, A. Hauschild, C. Robert, J. B. Haanen, P. Ascierto, J. Larkin, et al., Improved Survival with Vemurafenib in Melanoma with BRAF V600E Mutation., New Eng. J. Med., 364 (2011), 2507-2516. doi: 10.1056/NEJMoa1103782
|
| [33] | U. J. M. Mey, C. Renner, R. von Moos, Vemurafenib in combination with cobimetinib in relapsed and refractory extramedullary multiple myeloma harboring the BRAF V600E mutation, Hematol. Oncol., 35 (2017), 890-893. |
| [34] | D. Subramaniam, R. Thombre, A. Dhar, S. Anant, DNA methyltransferases: a novel target for prevention and therapy, Front. Oncol., 4 (2014), 80. |
| [35] |
H. Heyn, M. Esteller, DNA methylation profiling in the clinic: applications and challenges, Nat. Rev. Genet., 13 (2012), 679-692. doi: 10.1038/nrg3270
|
| [36] |
M. R. Hassler, W. Pulverer, R. Lakshminarasimhan, E. Redl, J. Hacker, G. D. Garland, et al., Insights into the Pathogenesis of Anaplastic Large-Cell Lymphoma through Genome-wide DNA Methylation Profiling, Cell Rep., 17 (2016), 596-608. doi: 10.1016/j.celrep.2016.09.018
|
| [37] |
T. Hinoue, D. J. Weisenberger, C. P. E. Lange, H. Shen, H. M. Byun, D. V. D. Berg, et al., Genome-scale analysis of aberrant DNA methylation in colorectal cancer, Genome Res., 22 (2012), 271-282. doi: 10.1101/gr.117523.110
|
| [38] |
N. Bethge, R. A. Lothe, H. Honne, K. Andresen, G. Troen, M. Eknaes, et al., Colorectal cancer DNA methylation marker panel validated with high performance in non-hodgkin lymphoma, Epigenetics, 9 (2014), 428-436. doi: 10.4161/epi.27554
|
| [39] |
D. Hanahan, R. A. Weinberg, Hallmarks of Cancer: The Next Generation, Cell, 144 (2011), 646-674. doi: 10.1016/j.cell.2011.02.013
|
| [40] |
U. P. Rohr, P. Herrmann, K. Ilm, H. Zhang, S. Lohmann, A. Reiser, et al., Prognostic value of MACC1 and proficient mismatch repair status for recurrence risk prediction in stage II colon cancer patients: the BIOGRID studies, Ann. Oncol., 28 (2017), 1869-1875. doi: 10.1093/annonc/mdx207
|
| [41] |
Z. Wang, K. Song, W. X. Zhao, Z. M. Zhao, Dendritic cells in tumor microenvironment promoted the neuropathic pain via paracrine inflammatory and growth factors, Bioengineered, 11 (2020), 661-678. doi: 10.1080/21655979.2020.1771068
|
| [42] |
S. Ostrand-Rosenberg, Immune surveillance: a balance between protumor and antitumor immunity, Curr. Opin. Genet. Dev., 18 (2008), 11-18. doi: 10.1016/j.gde.2007.12.007
|
| [43] |
C. Murdoch, M. Muthana, S. B. Coffelt, C. E. Lewis, The role of myeloid cells in the promotion of tumour angiogenesis, Nat. Rev. Cancer, 8 (2008), 618-631. doi: 10.1038/nrc2444
|
| [44] |
P. Sharma, S. Hu-Lieskovan, J. A. Wargo, A. Ribas, Primary, Adaptive, and Acquired Resistance to Cancer Immunotherapy, Cell, 168 (2017), 707-723. doi: 10.1016/j.cell.2017.01.017
|
| [45] | B. V. Kumar, T. J. Connors, D. L. Farber, Human T Cell Development, Localization, and Function throughout Life, Immunity, 48 (2018), 202-213. |
| [46] |
G. Tong, B. Cheng, J. Li, X. Wu, Q. Nong, L. He, et al., MACC1 regulates PDL1 expression and tumor immunity through the c-Met/AKT/mTOR pathway in gastric cancer cells, Cancer Med., 8 (2019), 7044-7054. doi: 10.1002/cam4.2542
|
| [47] |
J. Wang, J. W. Sun, L. N. Liu, D. B. Flies, X. X. Nie, M. Toki, et al., Siglec-15 as an immune suppressor and potential target for normalization cancer immunotherapy, Nat. Med., 25 (2019), 656. doi: 10.1038/s41591-019-0374-x
|
 mbe-18-06-413 - Supplementary.pdf mbe-18-06-413 - Supplementary.pdf |
 |
Figures(7) / Tables(2)

Ye Hu, Meiling Wang, Kainan Wang, Jiyue Gao, Jiaci Tong, Zuowei Zhao, Man Li. A potential role for metastasis-associated in colon cancer 1 (MACC1) as a pan-cancer prognostic and immunological biomarker[J]. Mathematical Biosciences and Engineering, 2021, 18(6): 8331-8353. doi: 10.3934/mbe.2021413


 DownLoad: