The development of new drugs is a time-consuming and labor-intensive process. Therefore, researchers use computational methods to explore other therapeutic effects of existing drugs, and drug-disease association prediction is an important branch of it. The existing drug-disease association prediction method ignored the prior knowledge contained in the drug-disease association data, which provided a strong basis for the research. Moreover, the previous methods only paid attention to the high-level features in the network when extracting features, and directly fused or connected them in series, resulting in the loss of information. Therefore, we propose a novel deep learning model for drug-disease association prediction, called DCNN. The model introduces the Gaussian interaction profile kernel similarity for drugs and diseases, and combines them with the structural similarity of drugs and the semantic similarity of diseases to construct the feature space jointly. Then dense convolutional neural network (DenseCNN) is used to capture the feature information of drugs and diseases, and introduces a convolutional block attention module (CBAM) to weight features from the channel and space levels to achieve adaptive optimization of features. The ten-fold cross-validation results of the model DCNN and the experimental results of the case study show that it is superior to the existing drug-disease association predictors and effectively predicts the drug-disease associations.
Citation: Huiqing Wang, Sen Zhao, Jing Zhao, Zhipeng Feng. A model for predicting drug-disease associations based on dense convolutional attention network[J]. Mathematical Biosciences and Engineering, 2021, 18(6): 7419-7439. doi: 10.3934/mbe.2021367
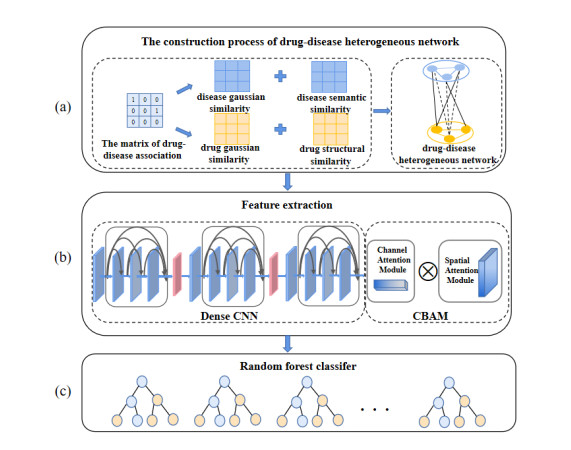
The development of new drugs is a time-consuming and labor-intensive process. Therefore, researchers use computational methods to explore other therapeutic effects of existing drugs, and drug-disease association prediction is an important branch of it. The existing drug-disease association prediction method ignored the prior knowledge contained in the drug-disease association data, which provided a strong basis for the research. Moreover, the previous methods only paid attention to the high-level features in the network when extracting features, and directly fused or connected them in series, resulting in the loss of information. Therefore, we propose a novel deep learning model for drug-disease association prediction, called DCNN. The model introduces the Gaussian interaction profile kernel similarity for drugs and diseases, and combines them with the structural similarity of drugs and the semantic similarity of diseases to construct the feature space jointly. Then dense convolutional neural network (DenseCNN) is used to capture the feature information of drugs and diseases, and introduces a convolutional block attention module (CBAM) to weight features from the channel and space levels to achieve adaptive optimization of features. The ten-fold cross-validation results of the model DCNN and the experimental results of the case study show that it is superior to the existing drug-disease association predictors and effectively predicts the drug-disease associations.

| [1] | H. Luo, M. Li, M. Yang, F. Wu, Y. Li, J. Wang, Biomedical data and computational models for drug repositioning: a comprehensive review, Brief Bioinformatics, 22 (2020), 1604-1619. |
| [2] | L. S. Maryam, G. Nasser, M. S. Rasoul, V. Jaleh, J. R. Green, A review of network-based approaches to drug repositioning, Brief Bioinformatics, 19 (2017), 878-892. |
| [3] |
P. Xuan, L. Zhao, T. Zhang, Y. Ye, Y. Zhang, Inferring Drug-Related Diseases Based on Convolutional Neural Network and Gated Recurrent Unit, Molecules, 24 (2019), 2712. doi: 10.3390/molecules24152712

|
| [4] | Y. Wang, S. Chen, N. Deng, W. Yong, Drug Repositioning by Kernel-Based Integration of Molecular Structure, Molecular Activity, and Phenotype Data, Plos One, 8 (2013), e78518. |
| [5] |
A. Gottlieb, G. Y. Stein, E. Ruppin, R. Sharan, PREDICT: A method for inferring novel drug indications with application to personalized medicine, Mol. Syst. Biol., 7 (2011), 496. doi: 10.1038/msb.2011.26
|
| [6] |
X. Zeng, S. Zhu, X. Liu, Y. Zhou, F. Cheng, deepDR: a network-based deep learning approach to in silico drug repositioning, Bioinformatics, 35 (2019), 5191-5198. doi: 10.1093/bioinformatics/btz418
|
| [7] |
M. Yang, H. Luo, Y. Li, J. Wang, Drug repositioning based on bounded nuclear norm regularization, Bioinformatics, 35 (2019), i455-i463. doi: 10.1093/bioinformatics/btz331
|
| [8] | W. Dai, X. Liu, Y. Gao, L. Chen, J. Song, D. Chen, et al., Matrix Factorization-Based Prediction of Novel Drug Indications by Integrating Genomic Space, Comput. Math. Method M., 2015 (2015), 275045. |
| [9] |
Z. You, Z. Huang, Z. Zhu, G. Yan, X. Chen, PBMDA: A novel and effective path-based computational model for miRNA-disease association prediction, PLoS Comput. Biol., 13 (2017), e1005455. doi: 10.1371/journal.pcbi.1005455
|
| [10] |
V. L. Twan, S. B. Nabuurs, M. Elena, Gaussian Interaction Profile kernels for predicting drug-target interaction, Bioinformatics, 27 (2011), 3036-3043. doi: 10.1093/bioinformatics/btr500
|
| [11] |
C.Yan, G. Duan, Y. Pan, F. Wu, J. Wang, DDIGIP: predicting drug-drug interactions based on Gaussian Interaction Profile kernels, BMC Bioinform., 20 (2019), 538. doi: 10.1186/s12859-019-3093-x
|
| [12] | W. Lan, L. Min, K. Zhao, J. Liu, F. Wu, Y. Pan, et al., LDAP: a web server for lncRNA-disease association prediction, Bioinformatics, 33 (2017), 458-460. |
| [13] |
L. Hui, Y. Song, J. Guan, L. Luo, Z. Zhuang, Inferring new indications for approved drugs via random walk on drug-disease heterogenous networks, BMC Bioinform., 17 (2016), 539. doi: 10.1186/s12859-016-1336-7
|
| [14] |
M. Yang, H. Luo, Y. Li, F. Wu, J. Wang, Overlap matrix completion for predicting drug-associated indications, PLoS. Comput. Biol., 15 (2019), e1007541. doi: 10.1371/journal.pcbi.1007541
|
| [15] | Y. Lecun, Y. Bengio, G. Hinton, Deep learning, Nature, 521 (2015), 436-444. |
| [16] | Q. Zhao, T. Sheng, Y. Wang, Z. Tang, Y. Chen, L. Cai, et al., M2Det: A Single-Shot Object Detector based on Multi-Level Feature Pyramid Network, In Proceedings of AAAI Conference on Artificial Intelligence, Honolulu, HI, USA, 2019. |
| [17] | G. Huang, Z. Liu, V. Laurens, K. Q. Weinberger, Densely Connected Convolutional Networks, In Proceedings of the IEEE Conference on Computer Vision and Pattern Recognition, Honolulu, HI, USA, 2017. |
| [18] |
D. Wang, S. Zeng, C. Xu, W. Qiu, Y. Liang, T. Joshi, et al., MusiteDeep: a deep-learning framework for general and kinase-specific phosphorylation site prediction, Bioinformatics, 33 (2017), 3909-3916. doi: 10.1093/bioinformatics/btx496
|
| [19] |
H. Wang, J. Wang, C. Dong, Y. Lian, Z. Yan, A Novel Approach for Drug-Target Interactions Prediction Based on Multimodal Deep Autoencoder, Front. Pharmacol., 10 (2020), 1592. doi: 10.3389/fphar.2019.01592
|
| [20] | R. Hu, J. Andreas, M. Rohrbach, T. Darrell, K. Saenko, In Learning to Reason: End-to-End Module Networks for Visual Question Answering, In Proceedings of the IEEE International Conference on Computer Vision, Venice, Italy, 2017. |
| [21] | L. Yu, Z. Lin, X. Shen, J. Yang, X. Lu, M. Bansal, et al., MAttNet: Modular Attention Network for Referring Expression Comprehension, In Proceedings of the IEEE Conference on Computer Vision and Pattern Recognition, Salt Lake City, UT, USA, 2018. |
| [22] |
H. Liu, W. Zhang, Y. Song, L. Deng, S. Zhou, HNet-DNN: inferring new drug-disease associations with deep neural network based on heterogeneous network features, J. Chem. Inf. Model., 60 (2020), 2367-2376. doi: 10.1021/acs.jcim.9b01008
|
| [23] |
Y. Wang, G. Deng, N. Zeng, X. Song, Y. Zhuang, Drug-Disease Association Prediction Based on Neighborhood Information Aggregation in Neural Networks, IEEE Access, 7 (2019), 50581-50587. doi: 10.1109/ACCESS.2019.2907522
|
| [24] |
J. Han, Y. Huang, Z. You, SAEROF: an ensemble approach for large-scale drug-disease association prediction by incorporating rotation forest and sparse autoencoder deep neural network, Sci. Rep., 10 (2020), 4972. doi: 10.1038/s41598-020-61616-9
|
| [25] | J. Han, Y. Huang, Z. You, Predicting Drug-Disease Associations via Using Gaussian Interaction Profile and Kernel-Based Autoencoder, BioMed. Res. Int., 2019 (2019), 1-11. |
| [26] | S. Woo, J. Park, J. Y. Lee, I. S. Kweon, In CBAM: Convolutional Block Attention Module, In Proceedings of the European Conference on Computer Vision, Munich, Germany, 2018. |
| [27] | H. Jie, S. Li, S. Gang, In Squeeze-and-Excitation Networks, In Proceedings of the IEEE Conference on Computer Vision and Pattern Recognition, Salt Lake City, UT, USA, 2018. |
| [28] | D. S. Wishart, K. Craig, A. C. Guo, S. Savita, H. Murtaza, S. Paul, et al., DrugBank: a comprehensive resource for in silico drug discovery and exploration, Nucleic Acids Res., 34 (2006), D668-672. |
| [29] | H. Ada, A. F. Scott, A. Joanna, B. Carol, V. David, V. A. Mckusick, Online Mendelian Inheritance in Man (OMIM), a knowledgebase of human genes and genetic disorders, Nucleic Acids Res., 30 (2005), 514. |
| [30] |
A. P. Davis, C. J. Grondin, R. J. Johnson, D. Sciaky, C. J. Mattingly, The Comparative Toxicogenomics Database: update 2019, Nucleic Acids Res., 47 (2019), D948-D954. doi: 10.1093/nar/gky868
|
| [31] |
C. Steinbeck, Y. Han, S. Kuhn, O. Horlacher, E. Luttmann, E. L. Willighagen, The chemistry development kit (CDK): An open-source Java library for chemo- and bioinformatics, J. Chem. Inf. Comput. Sci., 43 (2003), 493-500. doi: 10.1021/ci025584y
|
| [32] | D. Weininger, SMILES, a chemical language and information system Introduction to methodology and encoding rules, J. Chem. Inf. Comput. Sci., 28, (1988) 31-36. |
| [33] |
M. A. Van Driel, J. Bruggeman, G. Vriend, H. G. Brunner, and J. A. M. Leunissen, A text-mining analysis of the human phenome, Eur. J. Hum. Genet., 14 (2006), 535-542. doi: 10.1038/sj.ejhg.5201585
|
| [34] |
A. Hamosh, A. F. Scott, J. S. Amberger, D. Valle, and V. A. Mckusick, Online mendelian inheritance in man (OMIM), Hum. Mutation., 15 (2000), 57-61. doi: 10.1002/(SICI)1098-1004(200001)15:1<57::AID-HUMU12>3.0.CO;2-G
|
| [35] | X. Glorot, A. Bordes, Y. Bengio, In Deep Sparse Rectifier Neural Networks, In Proceedings of International Conference on Artificial Intelligence and Statistics, Fort Lauderdale, FL, USA, 2011. |
| [36] | K. He, X. Zhang, S. Ren, S. Jian, Identity Mappings in Deep Residual Networks, In Proceedings of European Conference on Computer Vision, Fort Lauderdale, Amsterdam, Netherlands, 2016. |
| [37] | S. Ioffe, C. Szegedy, Batch Normalization: Accelerating Deep Network Training by Reducing Internal Covariate Shift, In Proceedings of International Conference on Machine Learning, Lille, France, 2015. |
| [38] | H. Wang, J. Wang, C. Dong, Y. Lian, D. Liu, Z. Yan, A Novel Approach for Drug-Target Interactions Prediction Based on Multimodal Deep Autoencoder, Frontiers in Pharmacology, 10 (2020). |
| [39] | X. R. Tang, J. W. Luo, C. Shen, Z. H. Lai, Multi-view Multichannel Attention Graph Convolutional Network for miRNA-disease association prediction, Brief. Bioinform., 2021 (7006), 1-12. |
| [40] | X. X. Yang, L. Zamit, Y. Liu, J. Y. He, Additional Neural Matrix Factorization model for computational drug repositioning, BMC Bioinform., 2019 (20), 423. |
 mbe-18-06-367-Supplementary.pdf mbe-18-06-367-Supplementary.pdf |
 |


Figures(9) / Tables(7)

Huiqing Wang, Sen Zhao, Jing Zhao, Zhipeng Feng. A model for predicting drug-disease associations based on dense convolutional attention network[J]. Mathematical Biosciences and Engineering, 2021, 18(6): 7419-7439. doi: 10.3934/mbe.2021367


 DownLoad: