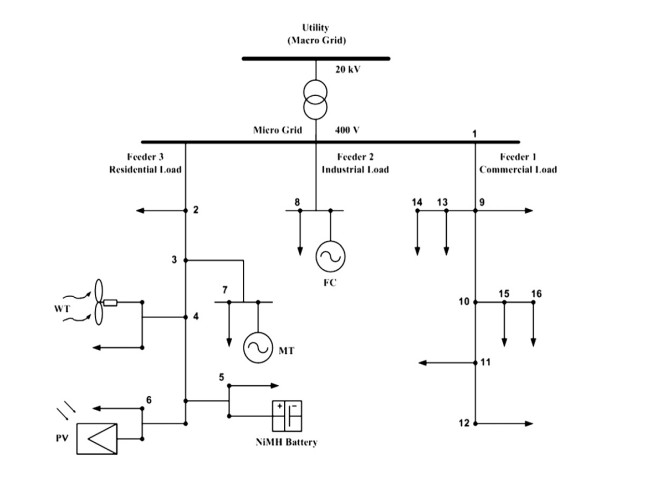
The use of renewable energy sources in energy distribution networks as distributed generation sources for dispersed and low consumption loads in remote areas such as remote villages and islands with low population can be a proper solution for reducing economic costs, reducing environmental pollutions and increasing energy efficiency. The purpose of this paper is optimal operation management of micro-grids by considering the existing capacities in the electricity market. In fact the microgrid operator, which is responsible for the safe operation of the network, should consider a process for planning in the network that takes into account all benefits of micro-grid's components. In other words, enough reliability for generation resources in these networks should be created in order to reduce costs and environmental pollution from energy production. In this paper, the artificial bee colony (ABC) algorithm has been used to minimize the costs and environmental pollutions by providing the optimal production power of distributed generation.
Citation: Mehrdad Ahmadi Kamarposhti, Ilhami Colak, Kei Eguchi. Optimal energy management of distributed generation in micro-grids using artificial bee colony algorithm[J]. Mathematical Biosciences and Engineering, 2021, 18(6): 7402-7418. doi: 10.3934/mbe.2021366
The use of renewable energy sources in energy distribution networks as distributed generation sources for dispersed and low consumption loads in remote areas such as remote villages and islands with low population can be a proper solution for reducing economic costs, reducing environmental pollutions and increasing energy efficiency. The purpose of this paper is optimal operation management of micro-grids by considering the existing capacities in the electricity market. In fact the microgrid operator, which is responsible for the safe operation of the network, should consider a process for planning in the network that takes into account all benefits of micro-grid's components. In other words, enough reliability for generation resources in these networks should be created in order to reduce costs and environmental pollution from energy production. In this paper, the artificial bee colony (ABC) algorithm has been used to minimize the costs and environmental pollutions by providing the optimal production power of distributed generation.

| [1] | N. W. A Lidula, A. D. Rajapakse, Micro grids research, A review of experimental micro grids and test systems, Renew. Sust. Energ. Rev., 15 (2011), 186-202. |
| [2] | S. Chowdhury, S. P. Chowdhury, P. Crossley, Micro grids and active distribution networks, IET Renew. Energy, 6 (2009). |
| [3] | C. Marnay, H. Asano, S. Papathanassiou, G. Strbac, Policy making for micro grids, power and energy magazine, IEEE, 6 (2008), 66-77. |
| [4] | A. G. Tsikalakis, N. D, Hatziargyriou, Centralized control for optimizing Micro grids operation, IEEE Trans. Energy Convers., 4 (2008), 241-248. |
| [5] |
F. Katiraei, R. Itavani, N. Hatziargyriou, A. Dimeas, Micro grid management, IEEE Power Electron. Mag., 6 (2008), 54-65. doi: 10.1109/MPE.2008.918702

|
| [6] | J. A. Pecas Lopes, A. Madureira, Advanced architectures and control concepts for more microgrids, work pacage D-DDl, INESC porto, 2007. |
| [7] |
W. Gu, Z. Wu, R. Bo, Modeling, planning and optimal energy management of combined cooling, heating and power microgrid: A review, Int. J. Electr. Power Energy Syst., 54 (2014), 26-37. doi: 10.1016/j.ijepes.2013.06.028
|
| [8] |
I. Prodan, E. Zio, A model predictive control framework for reliable microgrid energy management, Int. J. Electr. Power Energy Syst., 61 (2014), 399-409. doi: 10.1016/j.ijepes.2014.03.017
|
| [9] |
A. Parisio, E. Rikos, G. Tzamalis, L. Glielmo, Use of model predictive control for experimental microgrid optimization, Appl. Energy, 115 (2014), 37-46. doi: 10.1016/j.apenergy.2013.10.027
|
| [10] | A. L. Dimeas, N. D. Hatziargyriou, Operation of a multiage system for micro grid control, IEEE Trans. Power Syst., 20 (2005), 1447-1455. |
| [11] | T. Funabashi, T.Tanabe, T. Nagata, R. Yokoyama, An autonomous agent for reliable operation of power Market and Systems including Micro grids, IEEE Electric Utility Deregul. Restruc. Power Technol., 23 (2008), 173-177. |
| [12] | D. Rui, G. Deconinck, Market mechanism of smart grids: Multi-agent model and interoperability, IEEE conference Networking, sensing and control (ICNSC), 3 (2001), 8-13. |
| [13] | R. B. Swari, S. K Srivastava, C. S. Edrington, D. A. Cartes, S. Subramanian, Intelligent agent based auction by economic geberation scheduling for Microgrid Opration, Innov. Smart Grid Technol. (ISGT), 14 (2010), 106-117. |
| [14] | T. Logenthiran, D. Srinivasan, A. M. Khambadkone, Multi-agent system for energy resource scheduling of integrated micro grids in a distributed System, Electr. Power Syst. Res., 81 (2012), 138-148. |
| [15] | B. Ren, C. Jiang, A review on the economic dispatch and risk management considering wind power in the power market, J. Renew. Sust. Energy Rev., 13 (2013), 751-767. |
| [16] | C. A. Hernandez, T. C. Green, N. Mugniot, Fuel consumption minimization of a micro grid, IEEE Trans. Ind. Appl., 41 (2008), 673-681. |
| [17] | F. A. Mohamed, H. N. Koivo, System modeling and alone optimal management of micro grid using multi objective optimization, IEEE conf. Clean Electr. Power, 1 (2007), 148-153. |
| [18] | N. D. Hatziargyriou, A. J. Anastasiadis, J. Vasiljevska, A. G. Tsikalakis, Quantification of economic, environmental and operational benefits of micro grids, IEEE Power. Tech., 23 (2013), 1-8. |
| [19] | F. A. Mohamed, H. N. Koivo, System Modeling and alone optimal management of micro grid with battery storage, Int. Conf. Renew. Energ. Power Qual., 1 (2011), 23-37. |
| [20] |
M. Mazidi, A. Zakariazadeh, S. Jadid, P. Siano, Integrated scheduling of renewable generation and demand response programs in a microgrid, Energy Convers. Manag., 86 (2014), 1118-1127. doi: 10.1016/j.enconman.2014.06.078
|
| [21] | W. El-Khattam, M. M. A. Salama, Distributed generation technologies, definitions and benefits, Electric Power Syst. Res., 6 (2004), 119-128. |
| [22] | T. Adefarati, R. C. Bansal, M. Bettayeb, R. Naidoo, Optimal energy management of a PV-WTG-BSS-DG microgrid system, Energy, 217 (2021). |
| [23] | W. M. Lin, C. S. Tu, M. T. Tsai, Energy management strategy for microgrids by using enhanced bee colony optimization, Energies, 9 (2016). |
| [24] | E. Shahrabi, S. M. Hakimi, A. Hasankhani, G. Derakhshan, B. Abdi, Developing optimal energy management of energy hub in the presence of stochastic renewable energy resources, Sustain. Energy Grids Netw., 26 (2021). |
| [25] | H. Wu, H. Li, X. Gu, Optimal energy management for microgrids considering uncertainties in renewable energy generation and load demand, Processes, 8 (2020). |
| [26] |
M. Kumar, B. Tyagi, Optimal energy management and sizing of a community smart microgrid using demand side management with load uncertainty, ECTI-CIT, 15 (2021), 186-197. doi: 10.37936/ecti-cit.2021152.240491
|
| [27] | E. Eslami, M. A. Kamarposhti, Optimal design of solar-wind hybrid system-connected to the network with cost-saving approach and improved network reliability index, SN Appl. Sci., 1 (2019), 1-12. |
| [28] |
V. V. S. N. Murty, A. Kumar, Multi-objective energy management in microgrids with hybrid energy sources and battery energy storage systems, Prot. Control Mod. Power Syst., 5 (2020), 1-20. doi: 10.1186/s41601-019-0145-1
|
| [29] | T. Adefarati, G. D. Obikoya, Evaluation of wind resources potential and economic analysis of wind power generation in South Africa, Int. J. Eng. Res. Afr., 46 (2019), 146-167. |
| [30] |
Y. Li, P. Wang, H. B. Gooi, J. Ye, L. Wu, Multi-objective optimal dispatch of microgrid under uncertainties via interval optimisation, IEEE Trans. Smart Grid., 10 (2019), 2046-2058. doi: 10.1109/TSG.2017.2787790
|
| [31] | M. Elsied, A. Oukaour, H. Gualous, O. A. Lo Brutto, Optimal economic and environment operation of micro-grid power systems, Energy Convers. Manag., 122 (2019), 182-194. |
| [32] |
A. A. Moghaddam, A. Seifi, T. Niknam, M. R. A. Pahlavani, Multi-objective operation management of a renewable MG with back-up micro-turbine/fuel cell/battery hybrid power source, Energy, 36 (2011), 6490-6507. doi: 10.1016/j.energy.2011.09.017
|


Figures(3) / Tables(10)

Mehrdad Ahmadi Kamarposhti, Ilhami Colak, Kei Eguchi. Optimal energy management of distributed generation in micro-grids using artificial bee colony algorithm[J]. Mathematical Biosciences and Engineering, 2021, 18(6): 7402-7418. doi: 10.3934/mbe.2021366


 DownLoad: