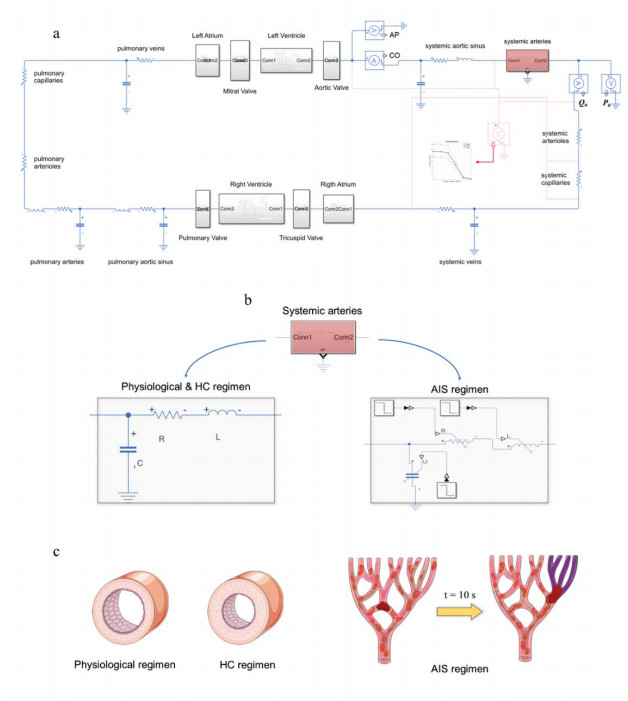
Acute Ischemic Stroke (AIS) is defined as the acute condition of occlusion of a cerebral artery and is often caused by a Hypertensive Condition (HC). Due to its sudden occurrence, AIS is not observable the right moment it occurs, thus information about instantaneous changes in hemodynamics is limited. This study aimed to propose an integrated Lumped Parameter (LP) model of the cardiovascular system to simulate an AIS and describe instantaneous changes in hemodynamics. In the integrated LP model of the cardiovascular system, heart chambers have been modelled with elastance systems with controlled pressure inputs; heart valves have been modelled with static open/closed pressure-controlled valves; eventually, the vasculature has been modelled with resistor-inductor-capacitor (RLC) direct circuits and have been linked to the rest of the system through a series connection. After simulating physiological conditions, HC has been simulated by changing pressure inputs and constant RLC parameters. Then, AIS occurring in arteries of different sizes have been simulated by considering time-dependent RLC parameters due to the elimination from the model of the occluding artery; instantaneous changes in hemodynamics have been evaluated by Systemic Arteriolar Flow (Qa) and Systemic Arteriolar Pressure (Pa) drop with respect to those measured in HC. Occlusion of arteries of different sizes leaded to an average Qa drop of 0.38 ml/s per cardiac cycle (with minimum and maximum values of 0.04 ml/s and 1.93 ml/s) and average Pa drop of 0.39 mmHg, (with minimum and maximum values of 0.04 mmHg and 1.98 mmHg). In conclusion, hemodynamic variations due to AIS are very small with respect to HC. A direct relation between the inverse of the length of the artery in which the occlusion occurs and the hemodynamic variations has been highlighted; this may allow to link the severity of AIS to the length of the interested artery.
Citation: Lorenzo Civilla, Agnese Sbrollini, Laura Burattini, Micaela Morettini. An integrated lumped-parameter model of the cardiovascular system for the simulation of acute ischemic stroke: description of instantaneous changes in hemodynamics[J]. Mathematical Biosciences and Engineering, 2021, 18(4): 3993-4010. doi: 10.3934/mbe.2021200
Acute Ischemic Stroke (AIS) is defined as the acute condition of occlusion of a cerebral artery and is often caused by a Hypertensive Condition (HC). Due to its sudden occurrence, AIS is not observable the right moment it occurs, thus information about instantaneous changes in hemodynamics is limited. This study aimed to propose an integrated Lumped Parameter (LP) model of the cardiovascular system to simulate an AIS and describe instantaneous changes in hemodynamics. In the integrated LP model of the cardiovascular system, heart chambers have been modelled with elastance systems with controlled pressure inputs; heart valves have been modelled with static open/closed pressure-controlled valves; eventually, the vasculature has been modelled with resistor-inductor-capacitor (RLC) direct circuits and have been linked to the rest of the system through a series connection. After simulating physiological conditions, HC has been simulated by changing pressure inputs and constant RLC parameters. Then, AIS occurring in arteries of different sizes have been simulated by considering time-dependent RLC parameters due to the elimination from the model of the occluding artery; instantaneous changes in hemodynamics have been evaluated by Systemic Arteriolar Flow (Qa) and Systemic Arteriolar Pressure (Pa) drop with respect to those measured in HC. Occlusion of arteries of different sizes leaded to an average Qa drop of 0.38 ml/s per cardiac cycle (with minimum and maximum values of 0.04 ml/s and 1.93 ml/s) and average Pa drop of 0.39 mmHg, (with minimum and maximum values of 0.04 mmHg and 1.98 mmHg). In conclusion, hemodynamic variations due to AIS are very small with respect to HC. A direct relation between the inverse of the length of the artery in which the occlusion occurs and the hemodynamic variations has been highlighted; this may allow to link the severity of AIS to the length of the interested artery.

| [1] |
A. I. Qureshi, M. A. Ezzeddine, A. Nasar, M. F. K. Suri, J. F. Kirmani, H. M. Hussein, et al., Prevalence of elevated blood pressure in 563704 adult patients with stroke presenting to the ED in the United States, Am. J. Emerg. Med., 25 (2007), 32-38. doi: 10.1016/j.ajem.2006.07.008

|
| [2] | P. K. Whelton, R. M. Carey, W. S. Aronow, D. E. Casey, K. J. Collins, C. D. Himmelfarb, et al., 2017 ACC/AHA/AAPA/ABC/ACPM/AGS/APhA/ASH/ASPC/NMA/PCNA Guideline for the prevention, detection, evaluation, and management of high blood pressure in adults: a report of the American College of Cardiology/American Heart Association Task Force on Clinical Practice Guidelines, Hypertension, 71 (2018), E13-E115. |
| [3] | M. Rafieian-Kopaei, M. Setorki, M. Doudi, A. Baradaran, H. Nasri, Atherosclerosis: process, indicators, risk factors and new hopes, Int. J. Prev. Med., 5 (2014), 927-946. |
| [4] |
D. Pickham, A. Valdez, J. Demeestere, R. Lemmens, L. Diaz, S. Hopper, et al., Prognostic Value of BEFAST vs. FAST to identify stroke in a prehospital setting, Prehosp. Emerg. Care, 23 (2019), 195-200. doi: 10.1080/10903127.2018.1490837
|
| [5] |
E. M. de Lucas, E. Sánchez, A. Gutiérrez, A. González Mandly, E. Ruiz, A. Fernández Flórez, et al., CT protocol for acute stroke: Tips and tricks for general radiologists, Radiographics, 28 (2008), 1673-1687. doi: 10.1148/rg.286085502
|
| [6] |
C. E. Baker, C. Corsini, D. Cosentino, G. Dubini, G. Pennati, F. Migliavacca, et al., Effects of pulmonary artery banding and retrograde aortic arch obstruction on the hybrid palliation of hypoplastic left heart syndrome, J. Thorac. Cardiovasc. Surg., 146 (2013), 1341-1348. doi: 10.1016/j.jtcvs.2013.01.038
|
| [7] |
S. Bozkurt, Mathematical modeling of cardiac function to evaluate clinical cases in adults and children, PLoS One, 14 (2019), e0224663. doi: 10.1371/journal.pone.0219915
|
| [8] |
B. Casas, J. Lantz, F. Viola, G. Cedersund, A. F. Bolger, C. J. Carlhäll, et al., Bridging the gap between measurements and modelling: a cardiovascular functional avatar, Sci. Rep., 7 (2017), 1-15. doi: 10.1038/s41598-017-18338-2
|
| [9] | J. R. Gohean, A closed-loop multi-scale model of the cardiovascular system for evaluation of ventricular assist devices, Master's Thesis, University of Texas, Austin, 2007. Available from: https://repositories.lib.utexas.edu/handle/2152/45625. |
| [10] |
T. Korakianitis, Y. Shi, Numerical simulation of cardiovascular dynamics with healthy and diseased heart valves, J. Biomech., 39 (2006), 1964-1982. doi: 10.1016/j.jbiomech.2005.06.016
|
| [11] |
J. M. J. Huttunen, L. Kärkkäinen, H. Lindholm, Pulse transit time estimation of aortic pulse wave velocity and blood pressure using machine learning and simulated training data, PLOS Comput. Biol., 15 (2019), e1007259. doi: 10.1371/journal.pcbi.1007259
|
| [12] | J. P. Mynard, M. R. Davidson, D. J. Penny, J. J. Smolich, A simple, versatile valve model for use in lumped parameter and one-dimensional cardiovascular models, Int. J. Numer. Meth. Biomed. Eng., 28 (2011), 626-641. |
| [13] | L. Formaggia, A. Veneziani, Reduced and multiscale models for the human cardiovascular system. From notes on 7 th VKI Lecture Series on "Biological fluid dynamics" held at the Von Karman Institute, Belgium, 2003. Available from: doi: 10.13140/RG.2.1.3668.8088. |
| [14] |
H. Suga, K. Sagawa, A. A. Shoukas, Load independence of the instantaneous pressure-volume ratio of the canine left ventricle and effects of epinephrine and heart rate on the ratio, Circ. Res., 32 (1973), 314-322. doi: 10.1161/01.RES.32.3.314
|
| [15] |
S. S. Simakov, Modern methods of mathematical modeling of blood flow using reduced order methods, Comput. Res. Model., 10 (2018), 581-604. doi: 10.20537/2076-7633-2018-10-5-581-604
|
| [16] | S. G. Shroff, J. S. Janicki, K. T. Weber, Evidence and quantitation of left ventricular systolic resistance, Am. J. Physiol., 249 (1985), H358-H370. |
| [17] |
I. Kokalari, T. Karaja, M. Guerrisi, Review on lumped parameter method for modeling the blood flow in systemic arteries, J. Biomed. Sci. Eng., 6 (2013), 92-99. doi: 10.4236/jbise.2013.61012
|
| [18] |
S. Shimizu, D. Une, T. Kawada, Y. Hayama, A. Kamiya, T. Shishido, et al., Lumped parameter model for hemodynamic simulation of congenital heart diseases, J. Physiol. Sci., 68 (2018), 103-111. doi: 10.1007/s12576-017-0585-1
|
| [19] | Y. Sun, B. J. Sjoberg, P. Ask, D. Loyd, B. Wranne, Mathematical model that characterizes transmitral and pulmonary venous flow velocity patterns, Am. J. Physiol., 268 (1995), H476-H489. |
| [20] |
J. Alastruey, K. H. Parker, J. Peiró, S. M. Byrd, S. J. Sherwin, Modelling the circle of Willis to assess the effects of anatomical variations and occlusions on cerebral flows, J. Biomech., 40 (2007), 1794-1805. doi: 10.1016/j.jbiomech.2006.07.008
|
| [21] |
Z. Duanmu, M. Yin, X. Fan, X. Yang, X. Luo, A patient-specific lumped-parameter model of coronary circulation, Sci. Rep., 8 (2018), 874. doi: 10.1038/s41598-018-19164-w
|
| [22] | M. Abdi, A. Karimi, M. Navidbakhsh, M. A. Rahmati, K. Hassani, A. Razmkon, Modeling the circle of Willis using electrical analogy method under both normal and pathological circumstances, J. Biomed. Phys. Eng., 3 (2013), 45-56. |
| [23] |
G. L. Baumbach, D. D. Heistad, Cerebral circulation in chronic arterial hypertension, Hypertension, 12 (1988), 89-95. doi: 10.1161/01.HYP.12.2.89
|
| [24] |
A. R. Pries, B. Reglin, T. W. Secomb, Remodeling of blood vessels: Responses of diameter and wall thickness to hemodynamic and metabolic stimuli, Hypertension, 46 (2005), 725-731. doi: 10.1161/01.HYP.0000184428.16429.be
|
| [25] | S. Lammers, D. Scott, K. Hunter, W. Tan, R. Shandas, K. R. Stenmark, Mechanics and function of the pulmonary vasculature: Implications for pulmonary vascular disease and right ventricular function, Compr. Physiol., 2 (2012), 295-319. |
| [26] | N. Stergiopulos, B. E. Westerhof, N. Westerhof, Total arterial inertance as the fourth element of the windkessel model, Am. J. Physiol., 276 (1999), H81-H88. |
| [27] |
S. Cavalcanti, E. Belardinelli, Modeling of cardiovascular variability using a differential delay equation, IEEE Trans. Biomed. Eng., 43 (1996), 982-989. doi: 10.1109/10.536899
|
| [28] |
C. Lerma, A. Minzoni, O. Infante, M. V. Josè, A mathematical analysis for the cardiovascular control adaptations in chronic renal failure, Artif. Organs, 28 (2004), 398-409. doi: 10.1111/j.1525-1594.2004.47162.x
|
| [29] |
C. Borst, J. M. Karemaker, Time delays in the human baroreceptor reflex, J. Auton. Nerv. Syst., 9 (1983), 399-409. doi: 10.1016/0165-1838(83)90004-8
|
| [30] |
J. M. Karemaker, R. W. DeBoer, Vagal baroreflex latency in circulatory control, J. Physiol., 595 (2017), 2197-2198. doi: 10.1113/JP273766
|
| [31] |
C. Keyl, A. Schneider, M. Dambacher, L. Bernardi, Time delay of vagally mediated cardiac baroreflex response varies with autonomic cardiovascular control, J. Appl. Physiol., 91 (2001), 283-289. doi: 10.1152/jappl.2001.91.1.283
|
| [32] |
J. D. Bristow, A. J. Honour, G. W. Pickering, P. Sleight, H. S. Smyth, Diminished baroreflex sensitivity in high blood pressure, Circulation, 39 (1969), 48-54. doi: 10.1161/01.CIR.39.1.48
|
| [33] |
S. V. Philbois, T. P. Facioli, A. C. Gastaldi, J. A. L. Rodrigues, J. Tank, T. H. Fares, et al., Important differences between hypertensive middle-aged women and men in cardiovascular autonomic control-a critical appraisal, Biol. Sex Differ., 12 (2021), 11. doi: 10.1186/s13293-020-00355-y
|
| [34] | E. Toschi-Dias, I. C. Trombetta, V. J. D. da Silva, C. Maki-Nunes, F. X. Cepeda, M. N. N. Alves, et al., Time delay of baroreflex control and oscillatory pattern of sympathetic activity in patients with metabolic syndrome and obstructive sleep apnea, Am. J. Physiol., 304 (2013), H1038-H1044. |
| [35] |
R. E. Jepson, J. Elliott, D. Brodbelt, H. M. Syme, Effect of control of systolic blood pressure on survival in cats with systemic hypertension, J. Vet. Intern. Med., 21 (2007), 402-409. doi: 10.1111/j.1939-1676.2007.tb02982.x
|
| [36] |
D. R. Hose, P. V. Lawford, W. Huberts, L. R. Hellevik, S. W. Omholt, F. N. van e Vosse, Cardiovascular models for personalised medicine: Where now and where next?, Med. Eng. Phys., 72 (2019), 38-48. doi: 10.1016/j.medengphy.2019.08.007
|
| [37] |
K. Hassani, M. Navidbakhsh, M. Rostami, Simulation of the cardiovascular system using equivalent electronic system, Biomed. Pap. Med. Fac. Univ. Palacky Olomouc Czech Repub., 150 (2006), 105-112. doi: 10.5507/bp.2006.015
|
| [38] | B. Li, W. Wang, B. Mao, Y. Lin, A method to personalize the lumped parameter model of coronary artery, Int. J. Comput. Methods, 15 (2018), 1842004. |
| [39] |
R. T. Cole, C. L. Lucas, W. E. Cascio, T. A. Johnson, A LabVIEWTM model incorporating an open-loop arterial impedance and a closed-loop circulatory system, Ann. Biomed. Eng., 33 (2005), 1555-1573. doi: 10.1007/s10439-005-7785-1
|
Figures(6) / Tables(4)

Lorenzo Civilla, Agnese Sbrollini, Laura Burattini, Micaela Morettini. An integrated lumped-parameter model of the cardiovascular system for the simulation of acute ischemic stroke: description of instantaneous changes in hemodynamics[J]. Mathematical Biosciences and Engineering, 2021, 18(4): 3993-4010. doi: 10.3934/mbe.2021200


 DownLoad: