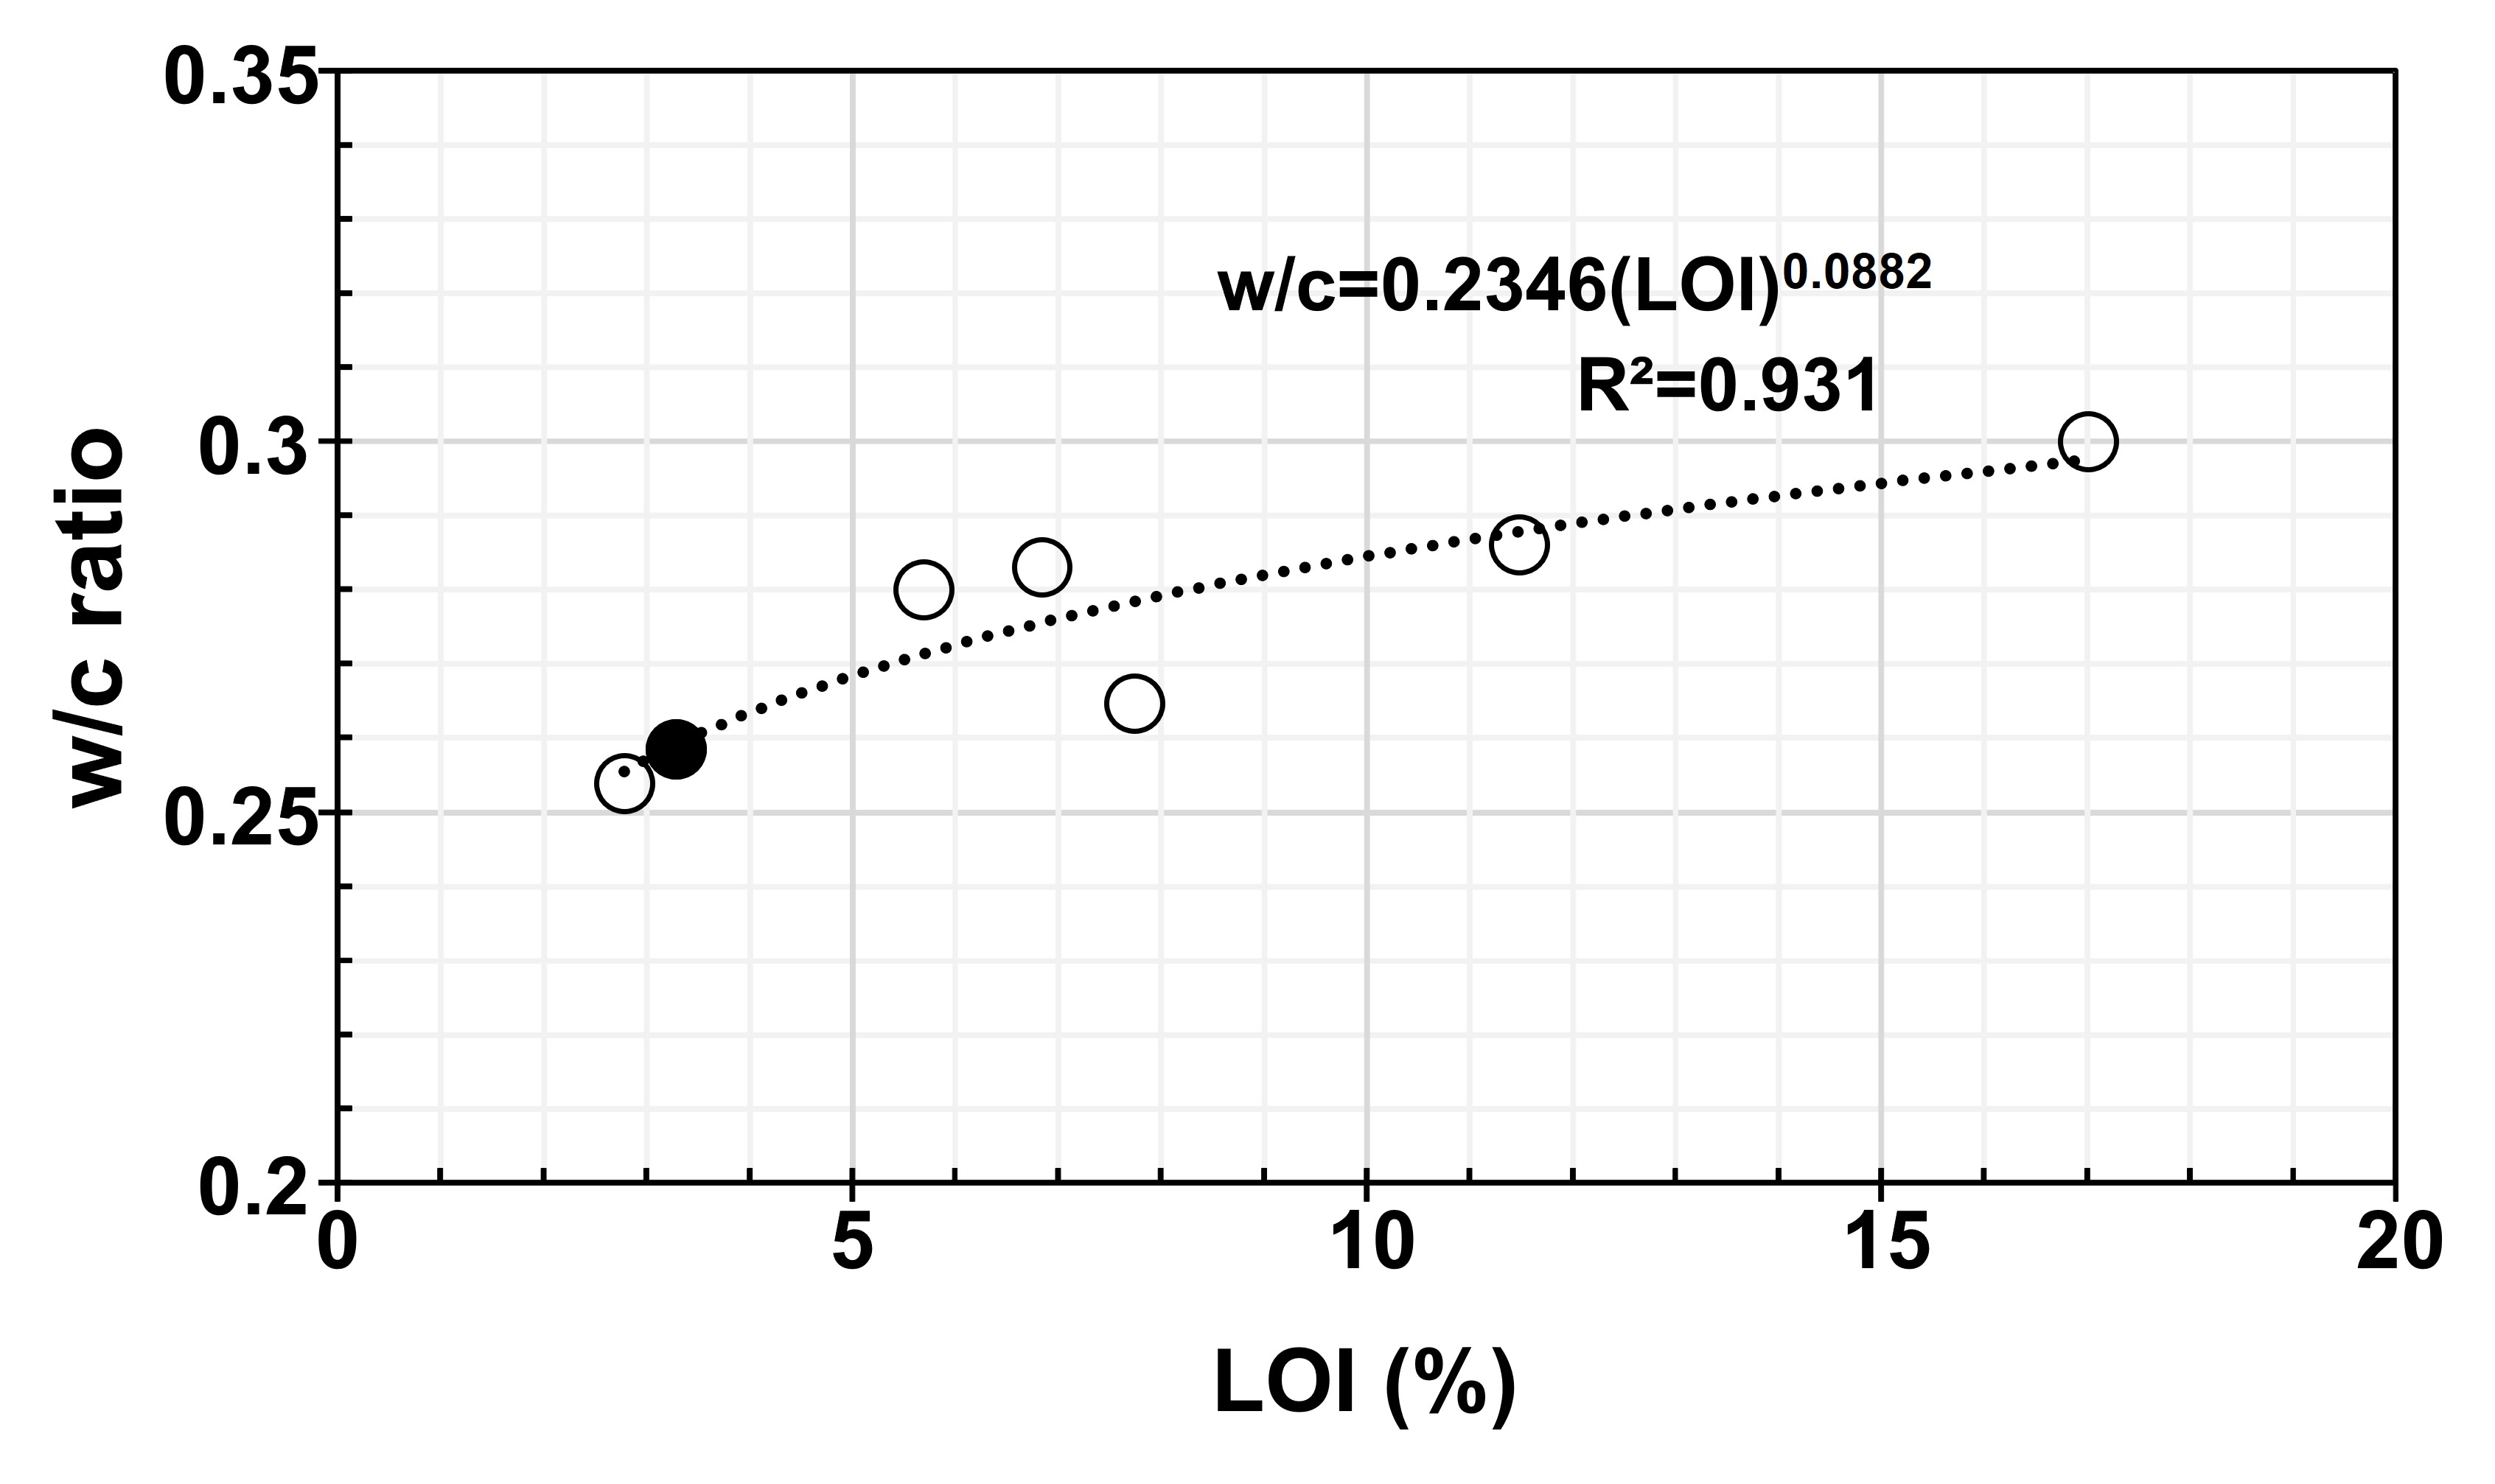
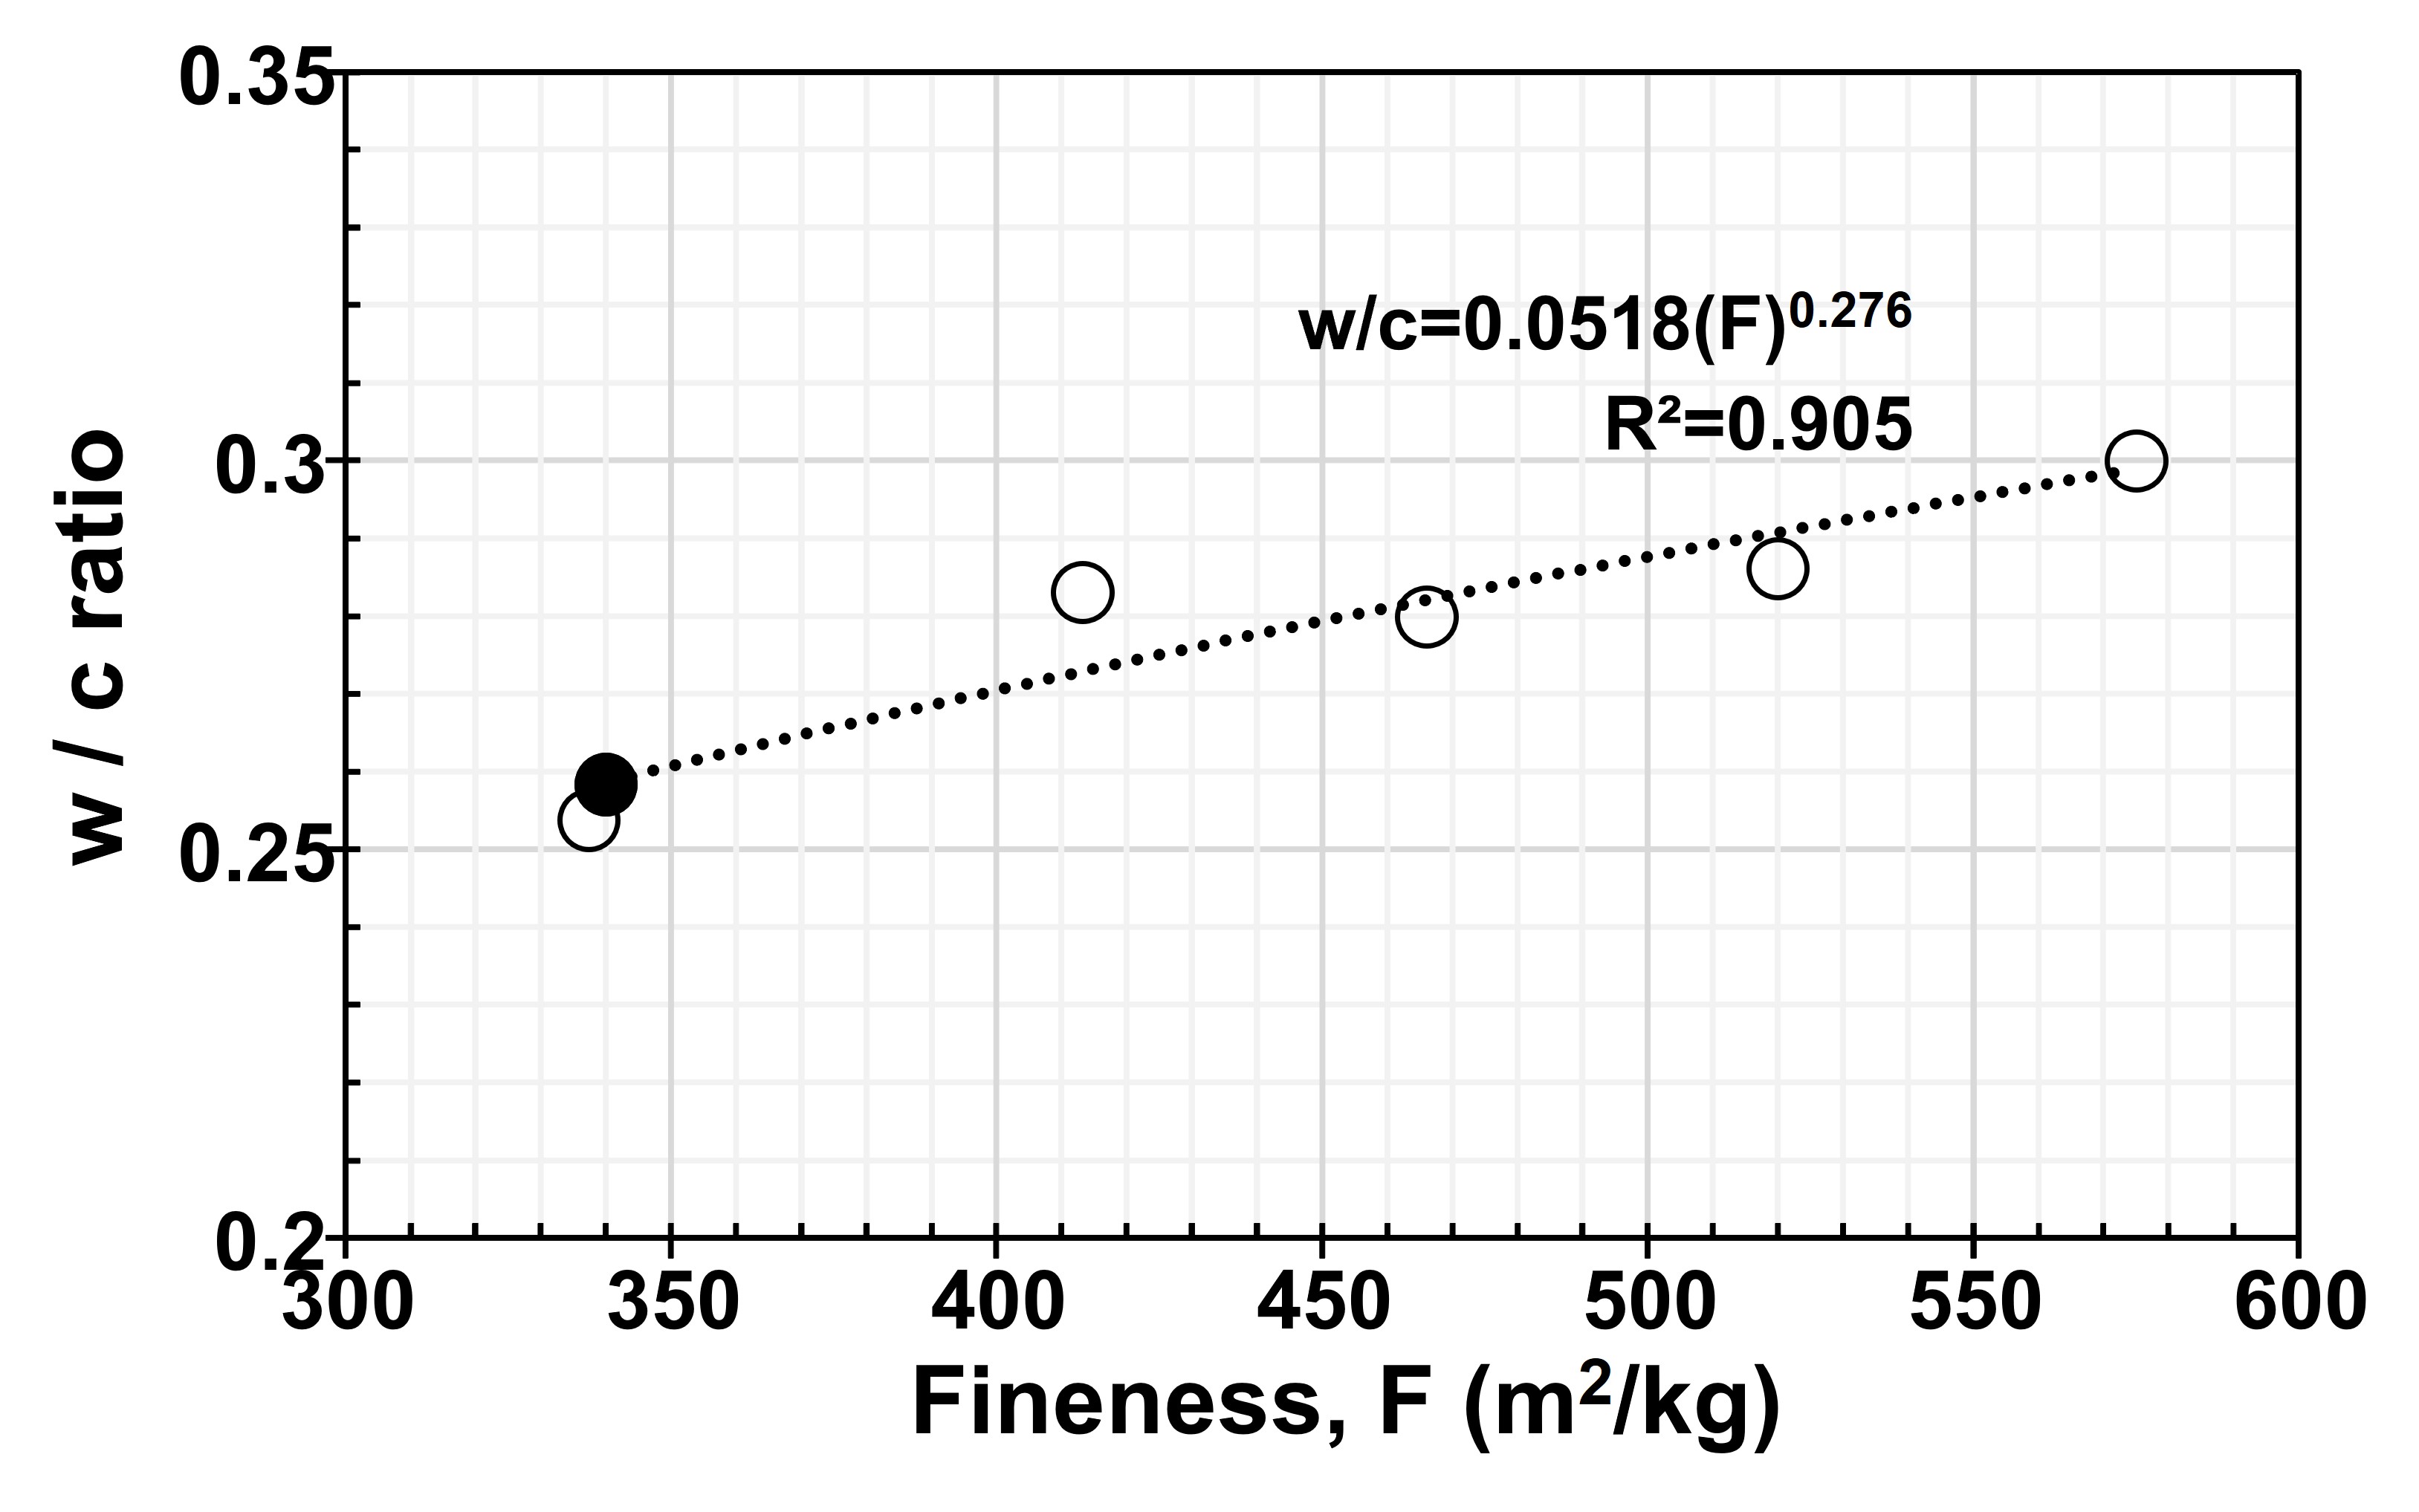
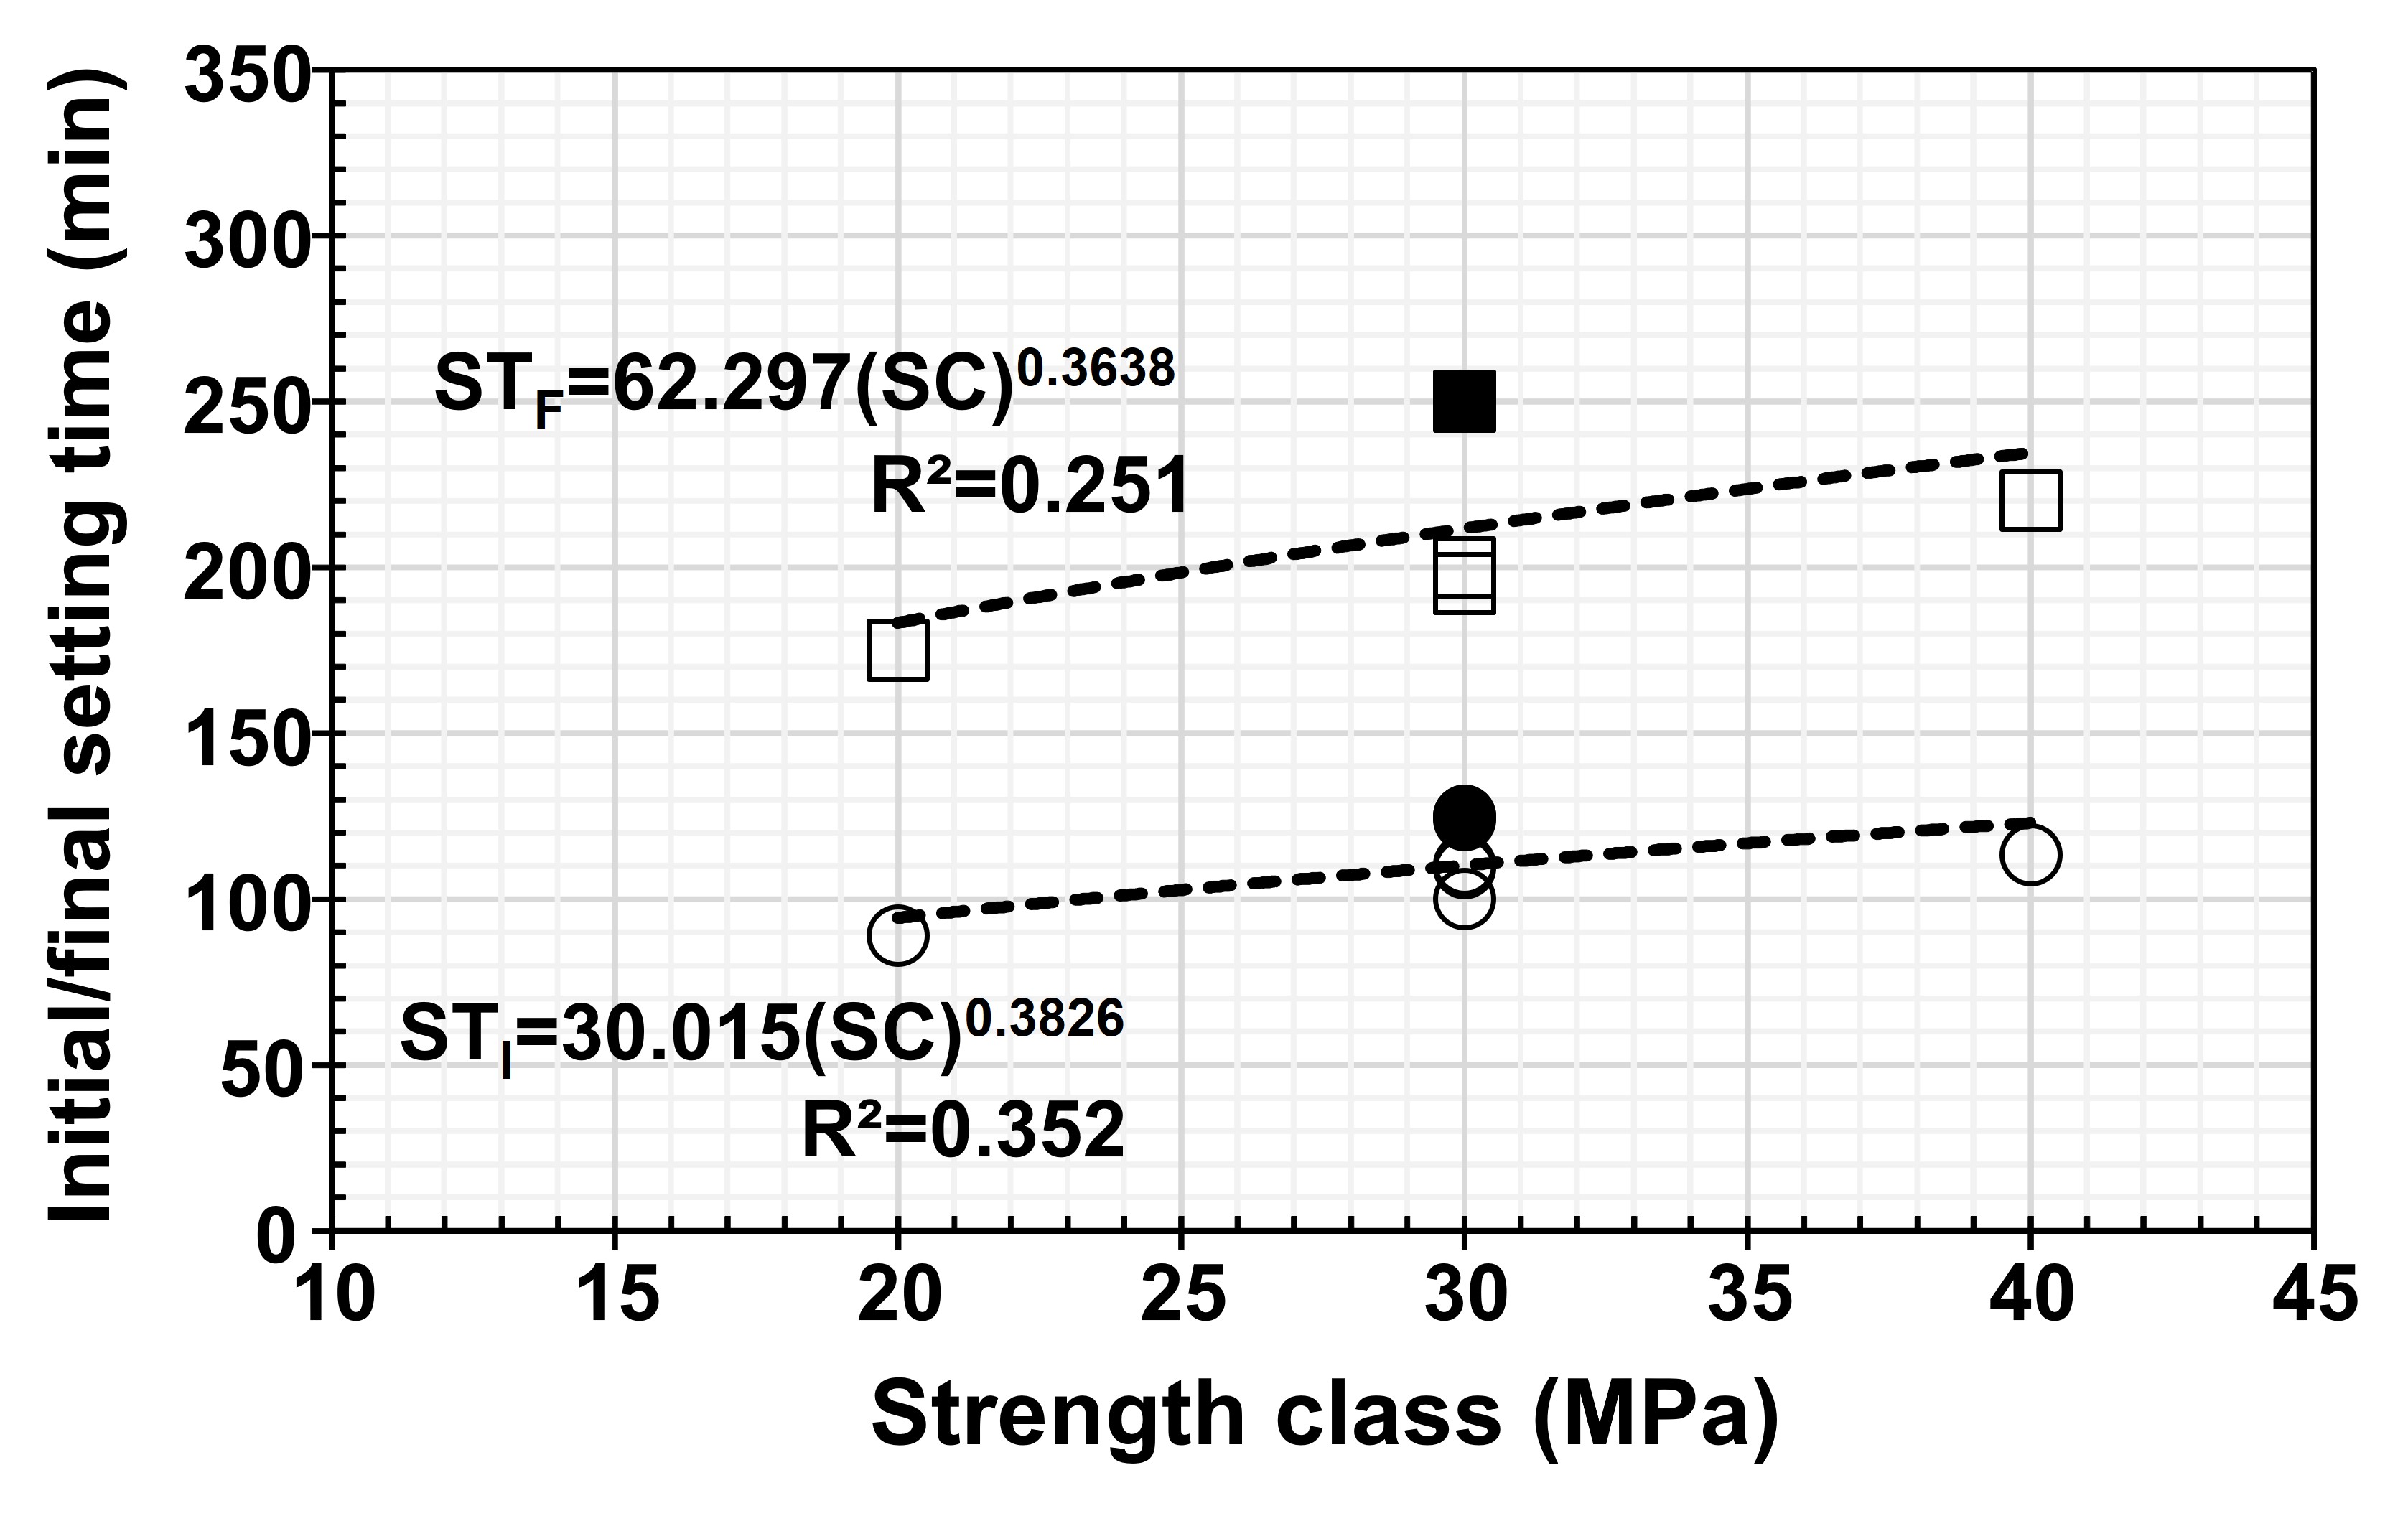
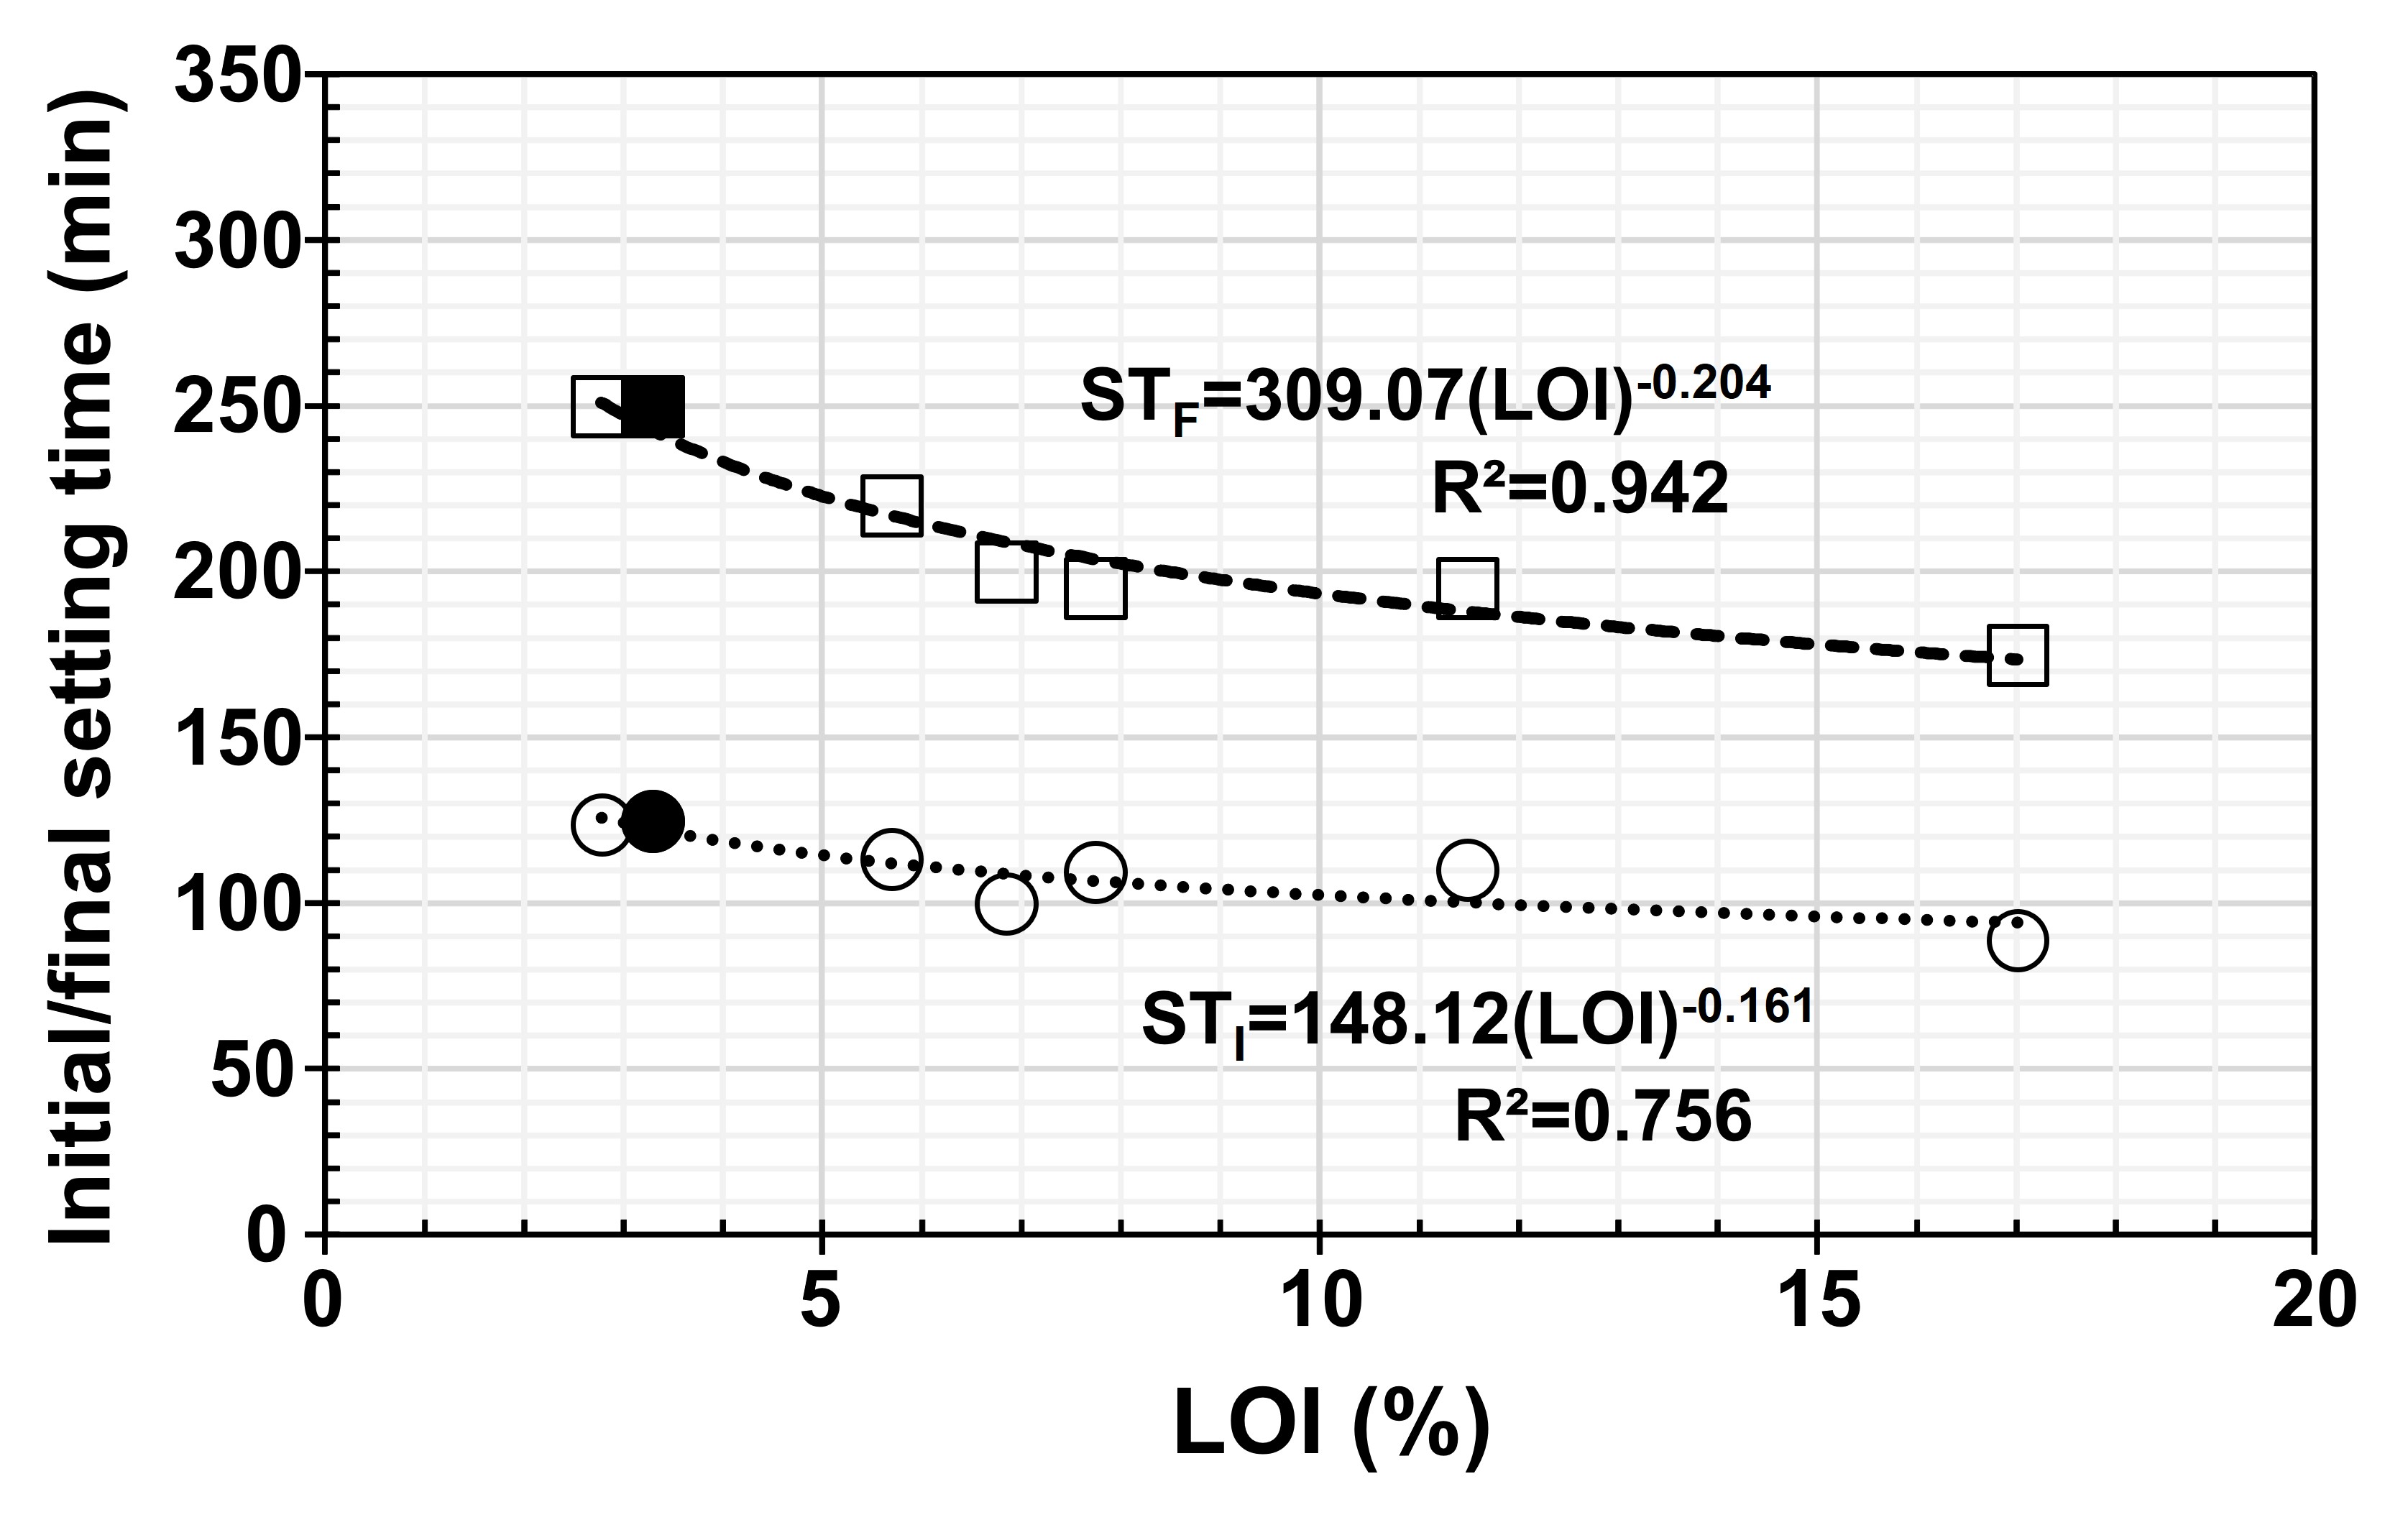
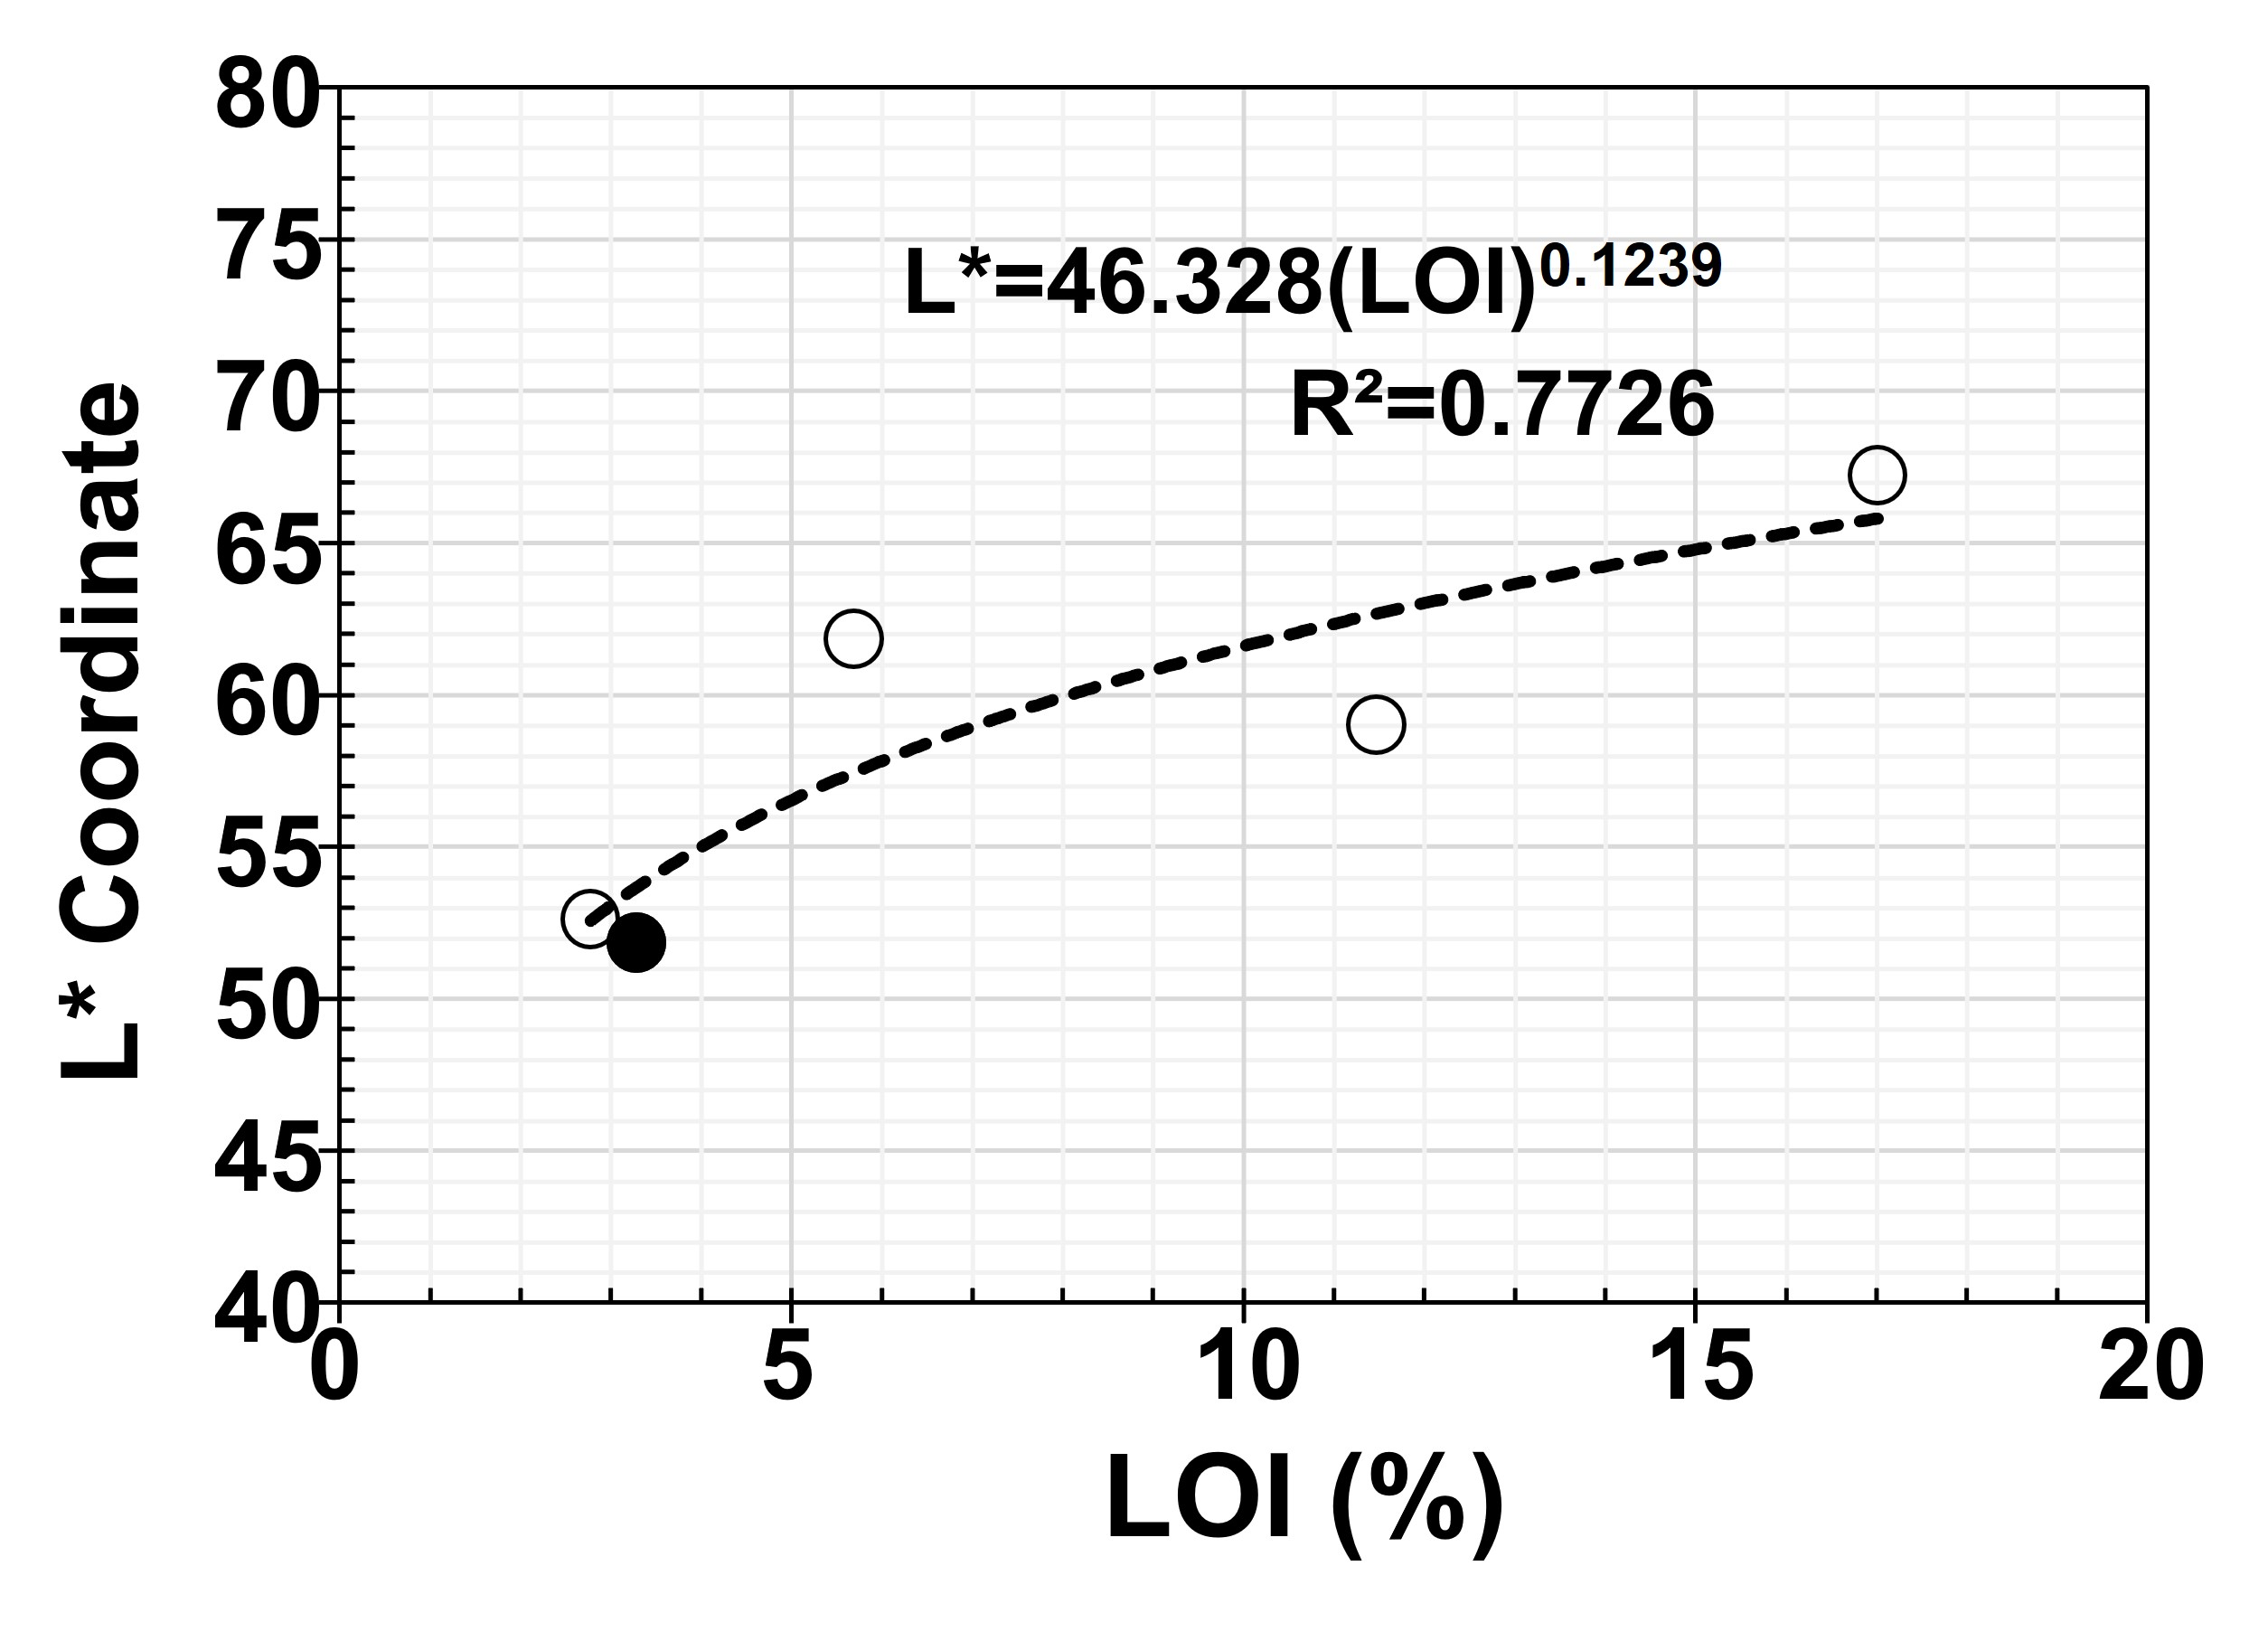
Marginal information is available in the literature regarding the performance of Portland cement–based pastes when reducing clinker content with inert limestone fillers (ILSF) when the replacement is > 15%. In this research, six different blended Portland cements (BPCs) from two different brands were evaluated, all with loss of ignition (LOI) values ranging between 2% and 18%, estimating ILSF contents between 5% and 35%. The characterization of these BPCs was conducted through laboratory tests aimed at performance forecasting in the absence of their component proportions due to trademark secrecy. These tests included determining BPCs' fineness (or Blaine number, F), density (ρ), and LOI. Then, paste characterization was performed, including water content for paste normal consistency, initial and final setting times, determination of the luminosity coordinate *L from hardened paste specimens, and mortar compressive strength at 28 days. It was concluded that one way to overcome the misinformation about the composition of BPCs (clinker, pozzolans, or ILSF contents) is to obtain the LOI parameter, as it will help forecast the performance of new BPC formulations.
Citation: Andrés A. Torres-Acosta, Rafael A. Méndez-Páramo, Celene Arista-Perrusquía, Eduardo S. Herrera-Sosa, Samantha Reyes-Rodríguez. Portland cement paste performance when inert limestone filler is added as clinker replacement[J]. AIMS Materials Science, 2025, 12(2): 224-244. doi: 10.3934/matersci.2025012
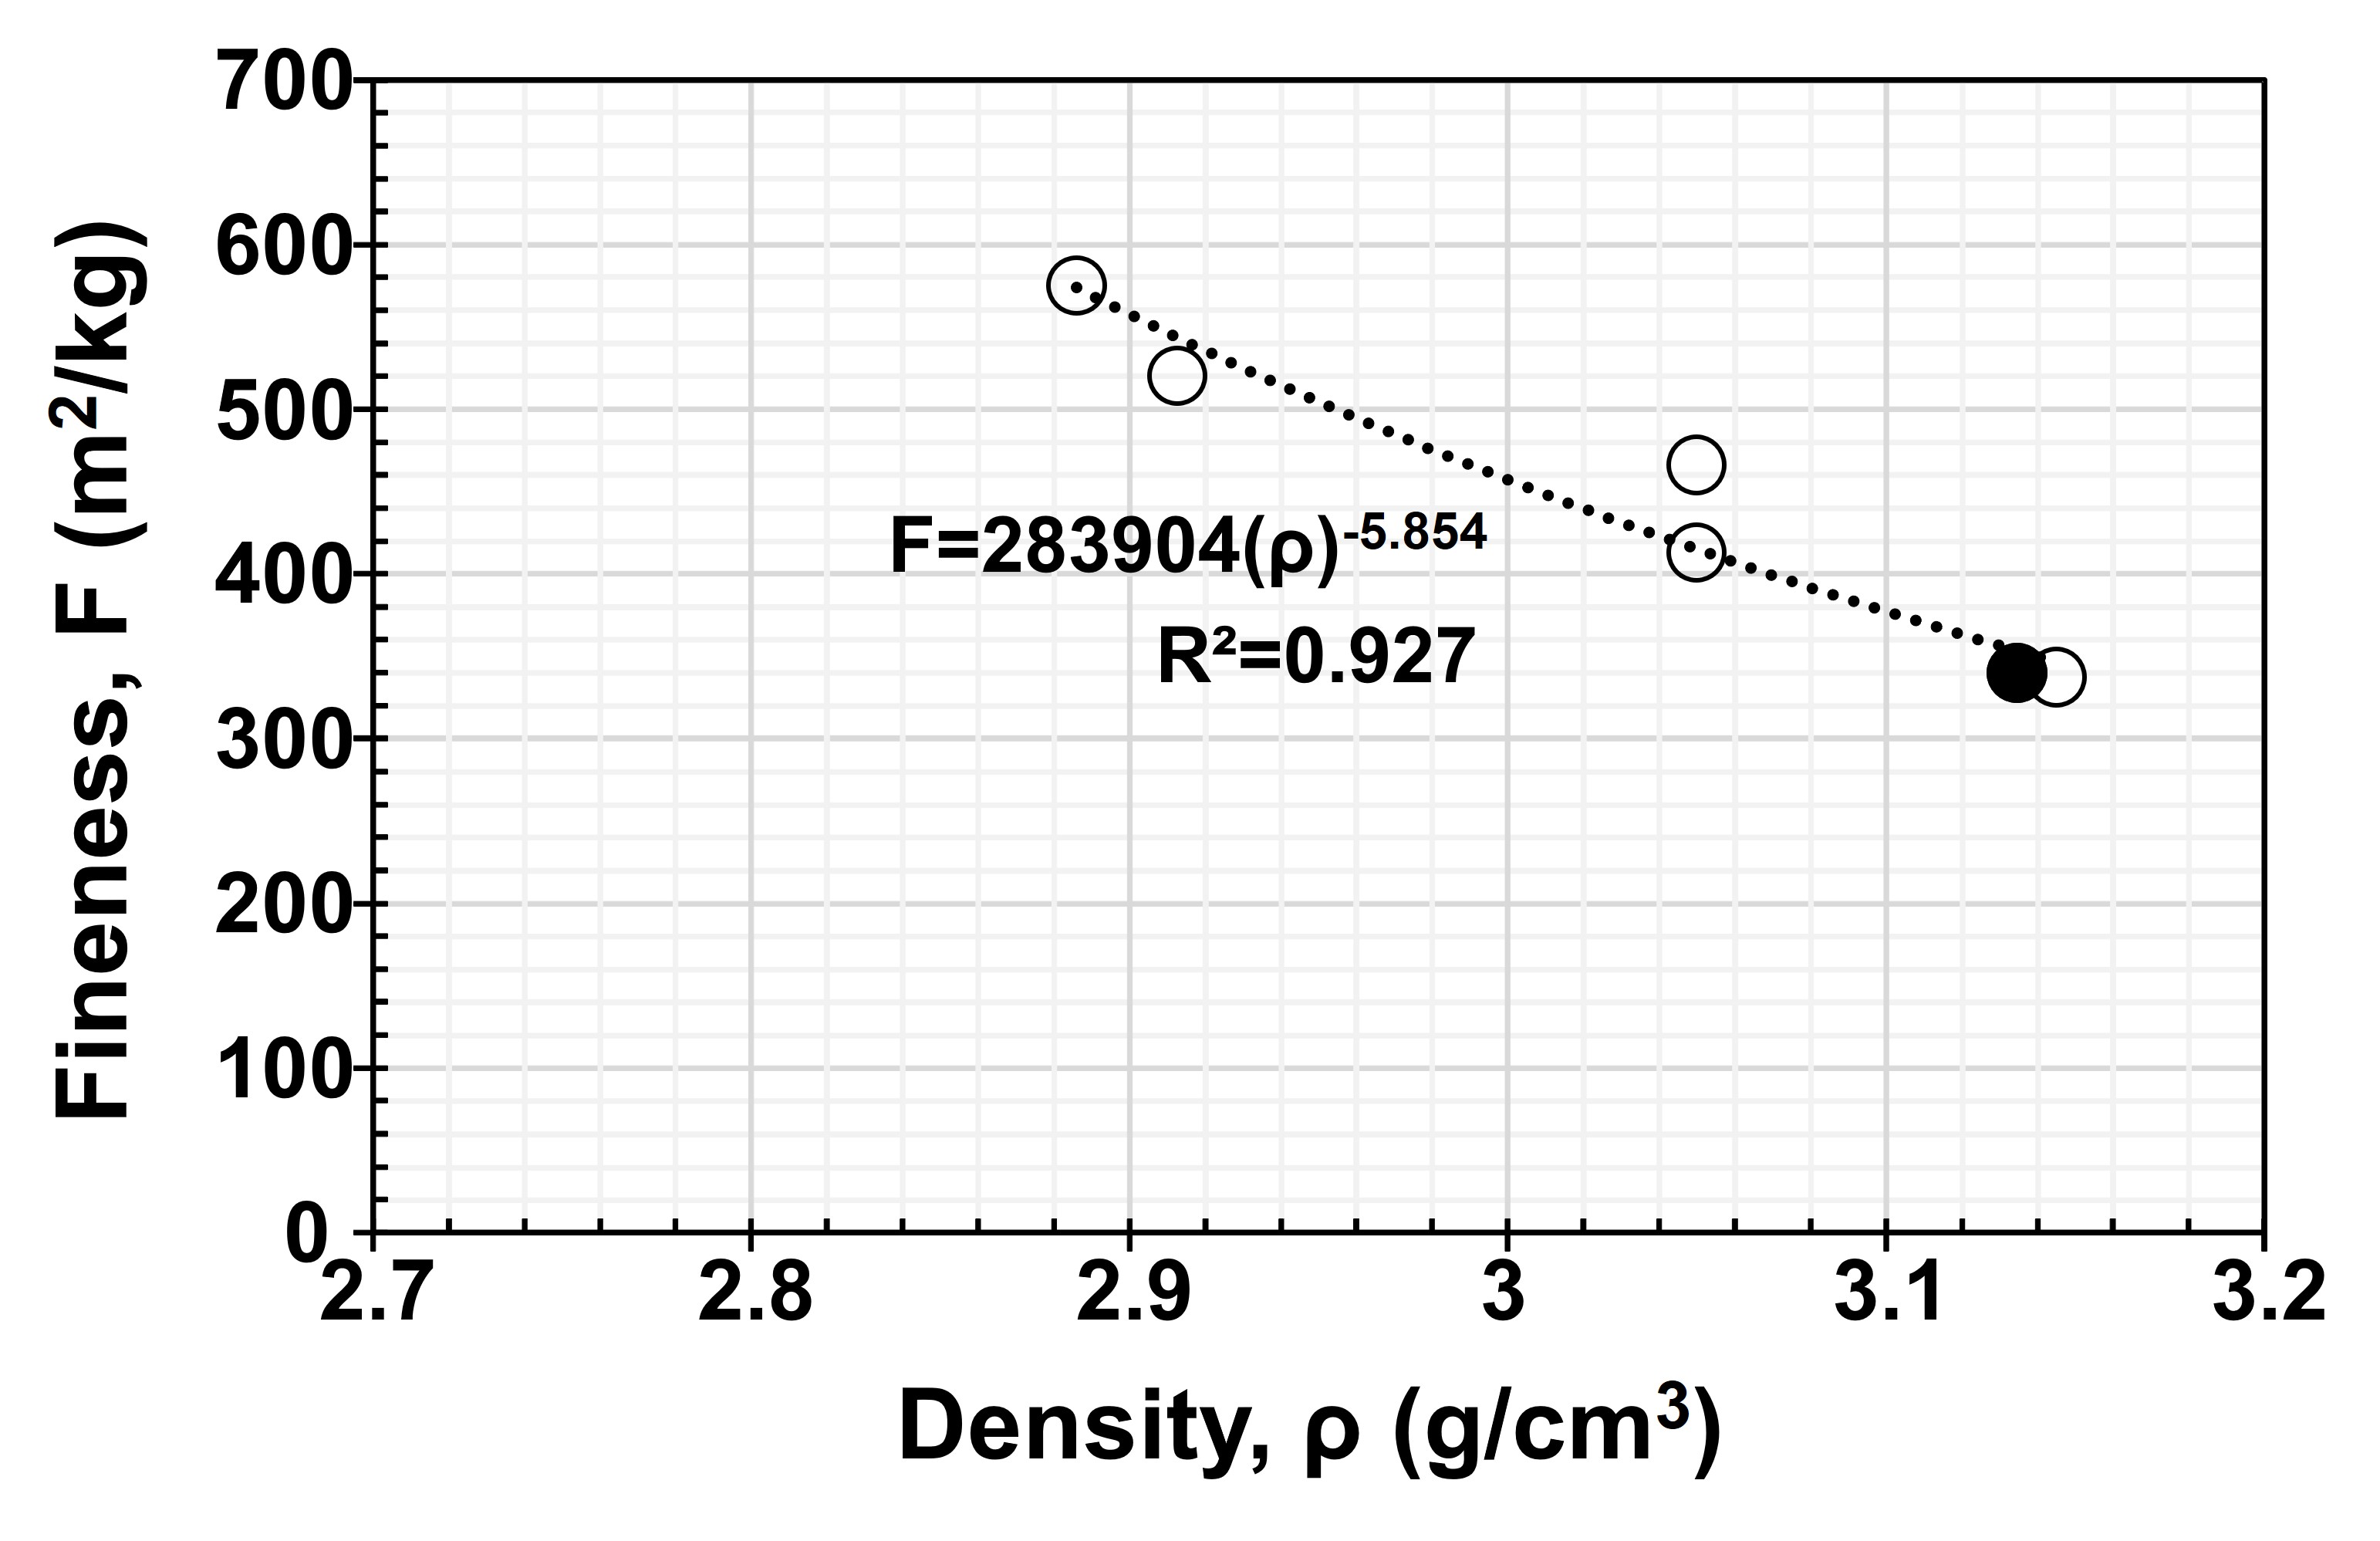
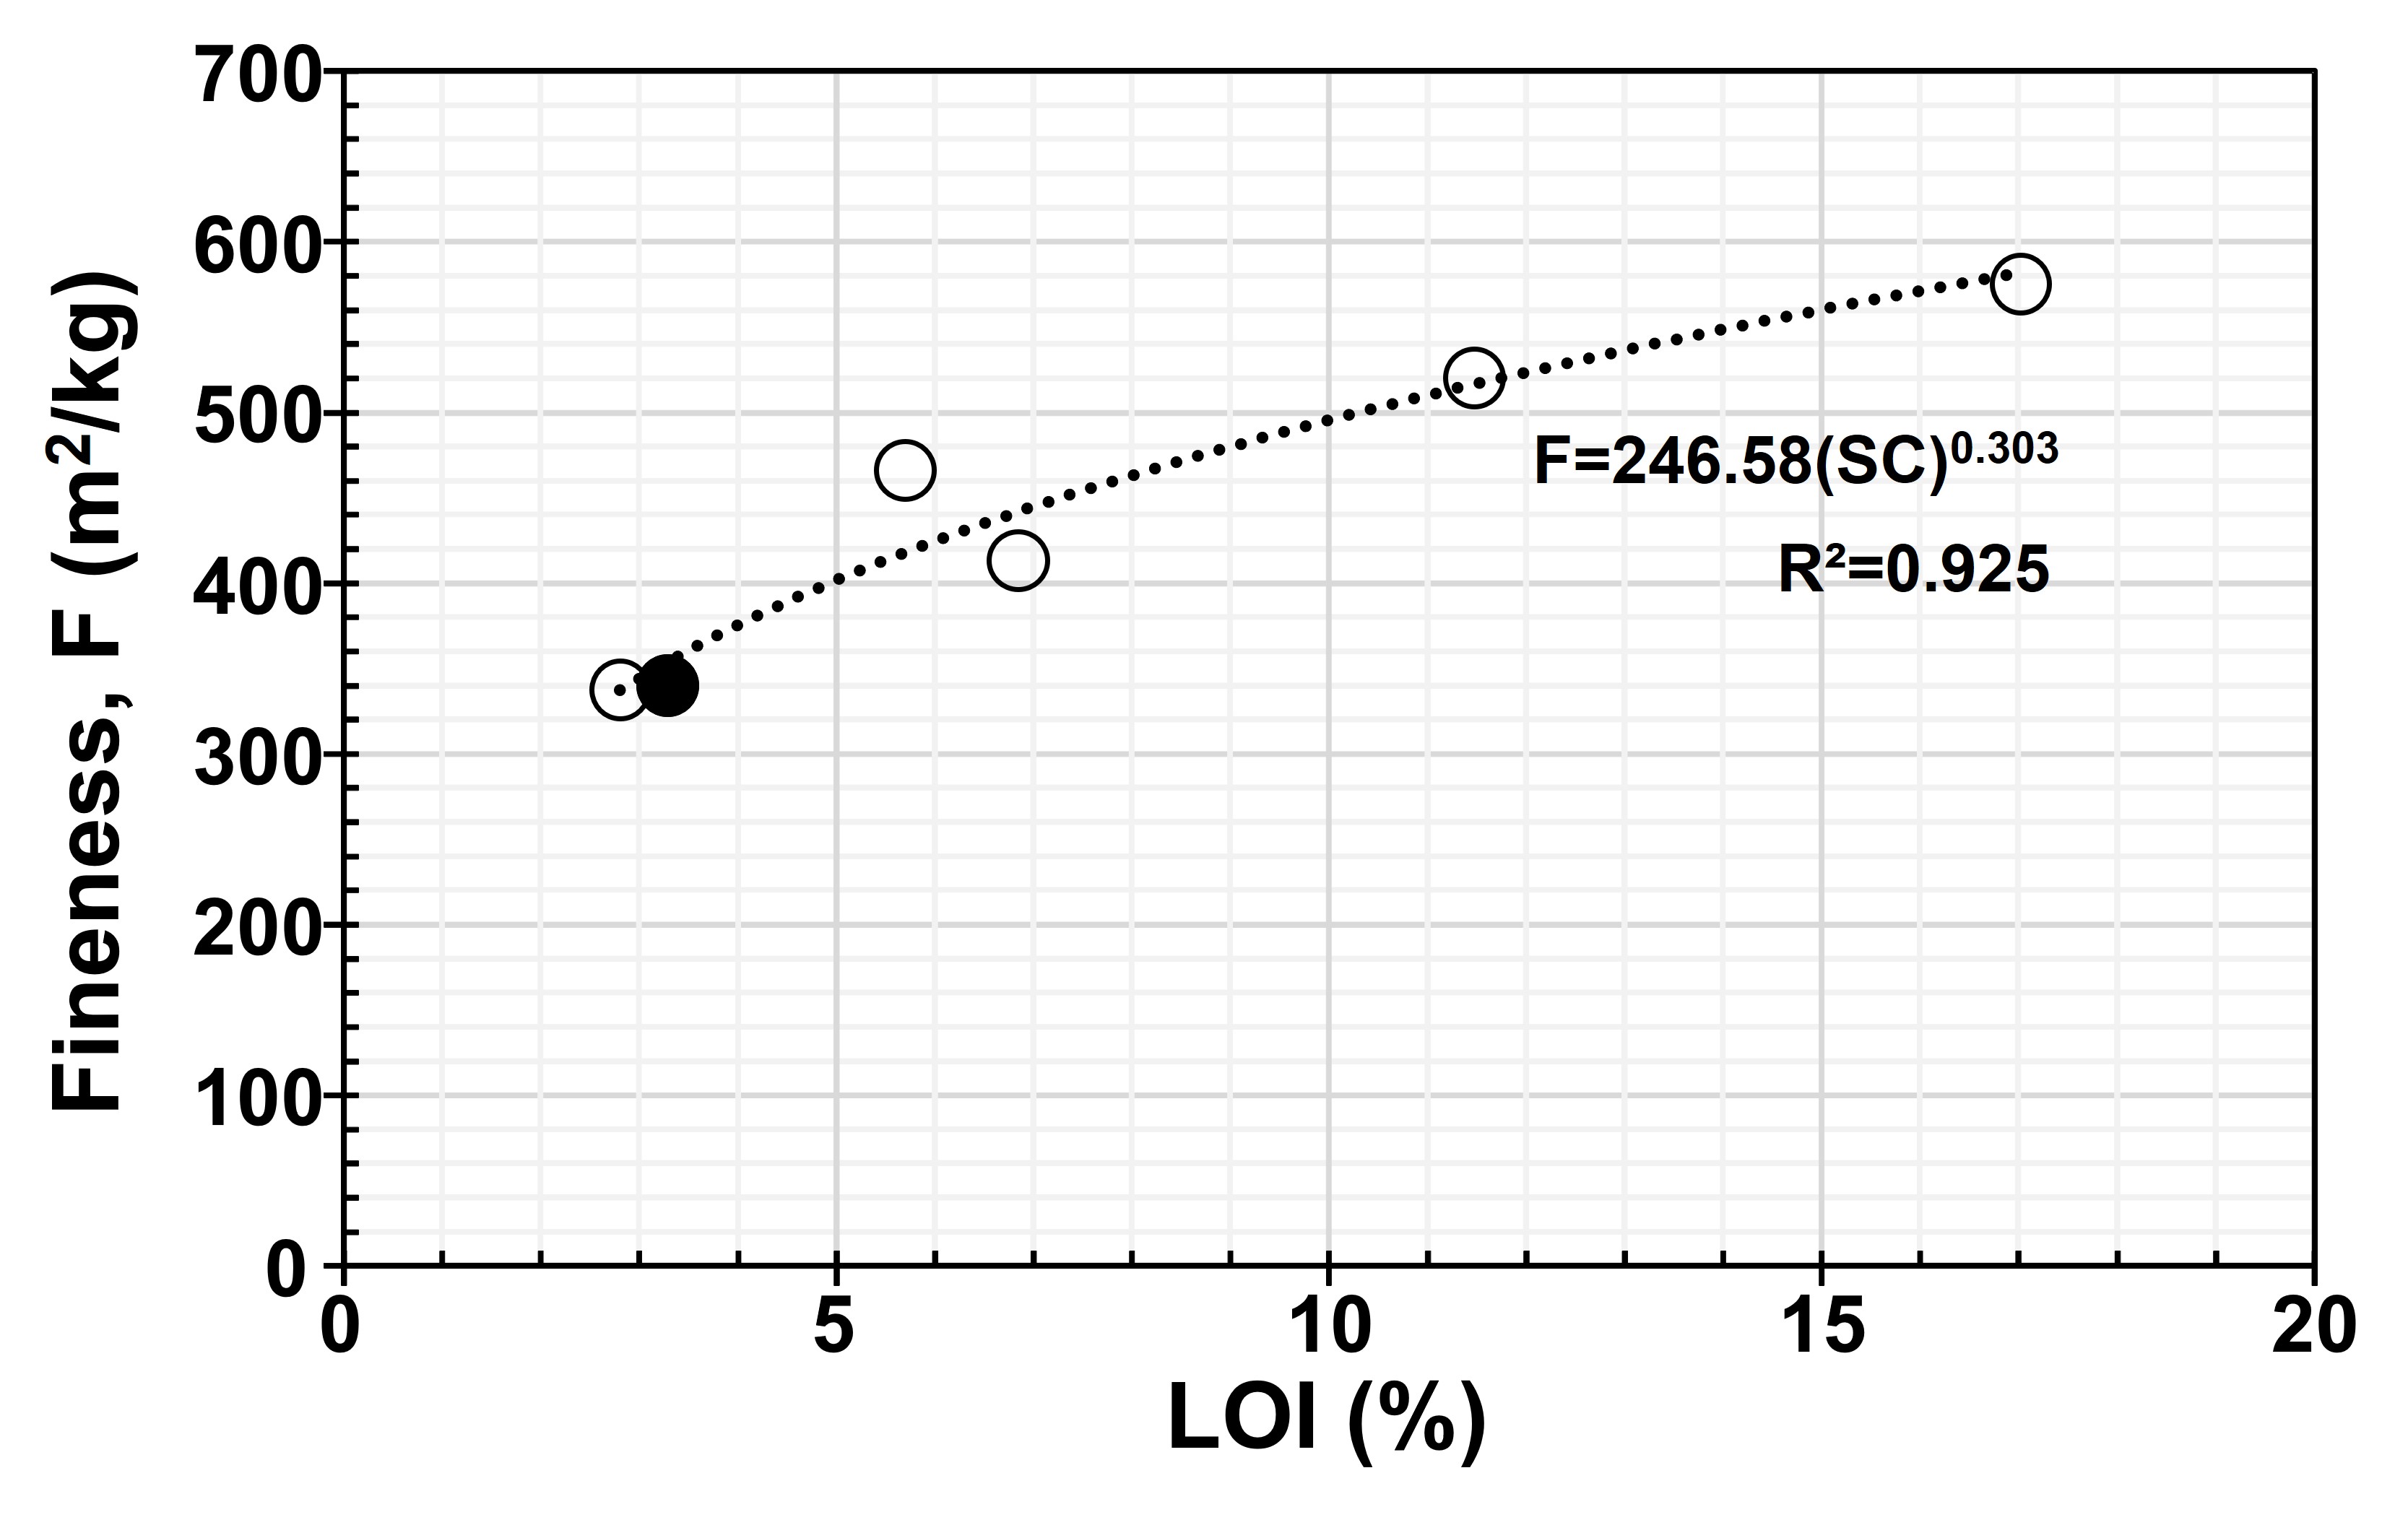
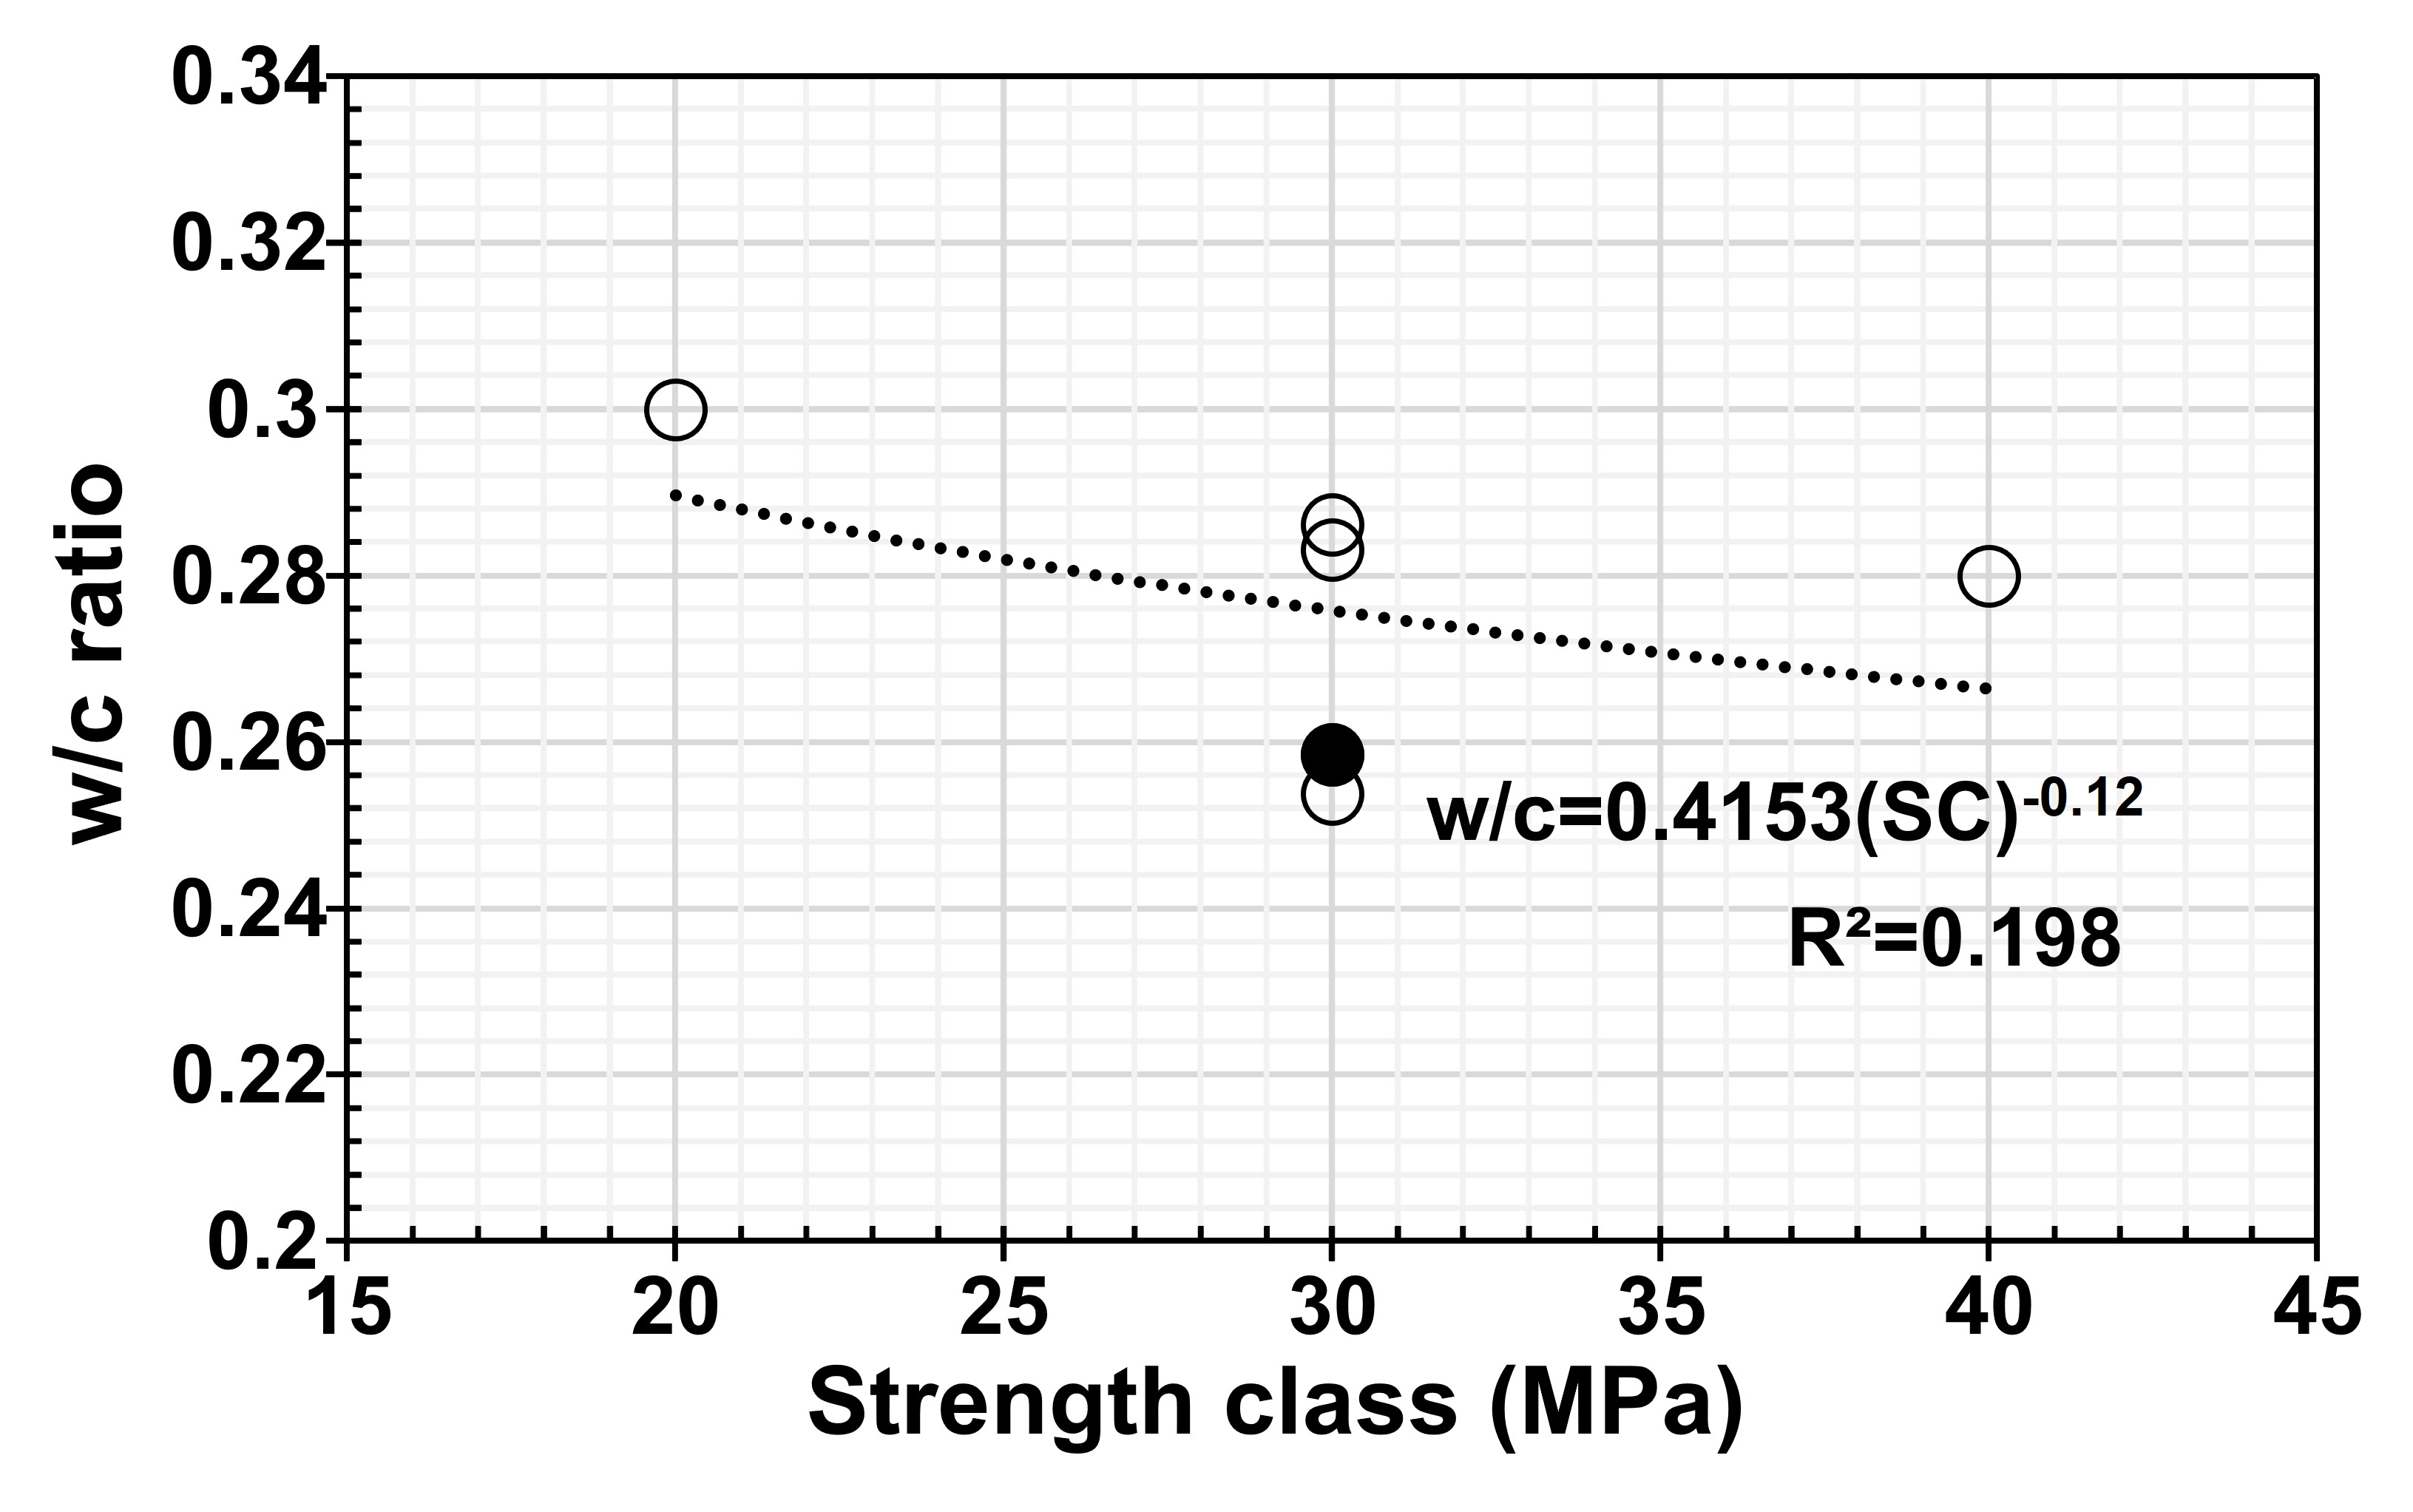
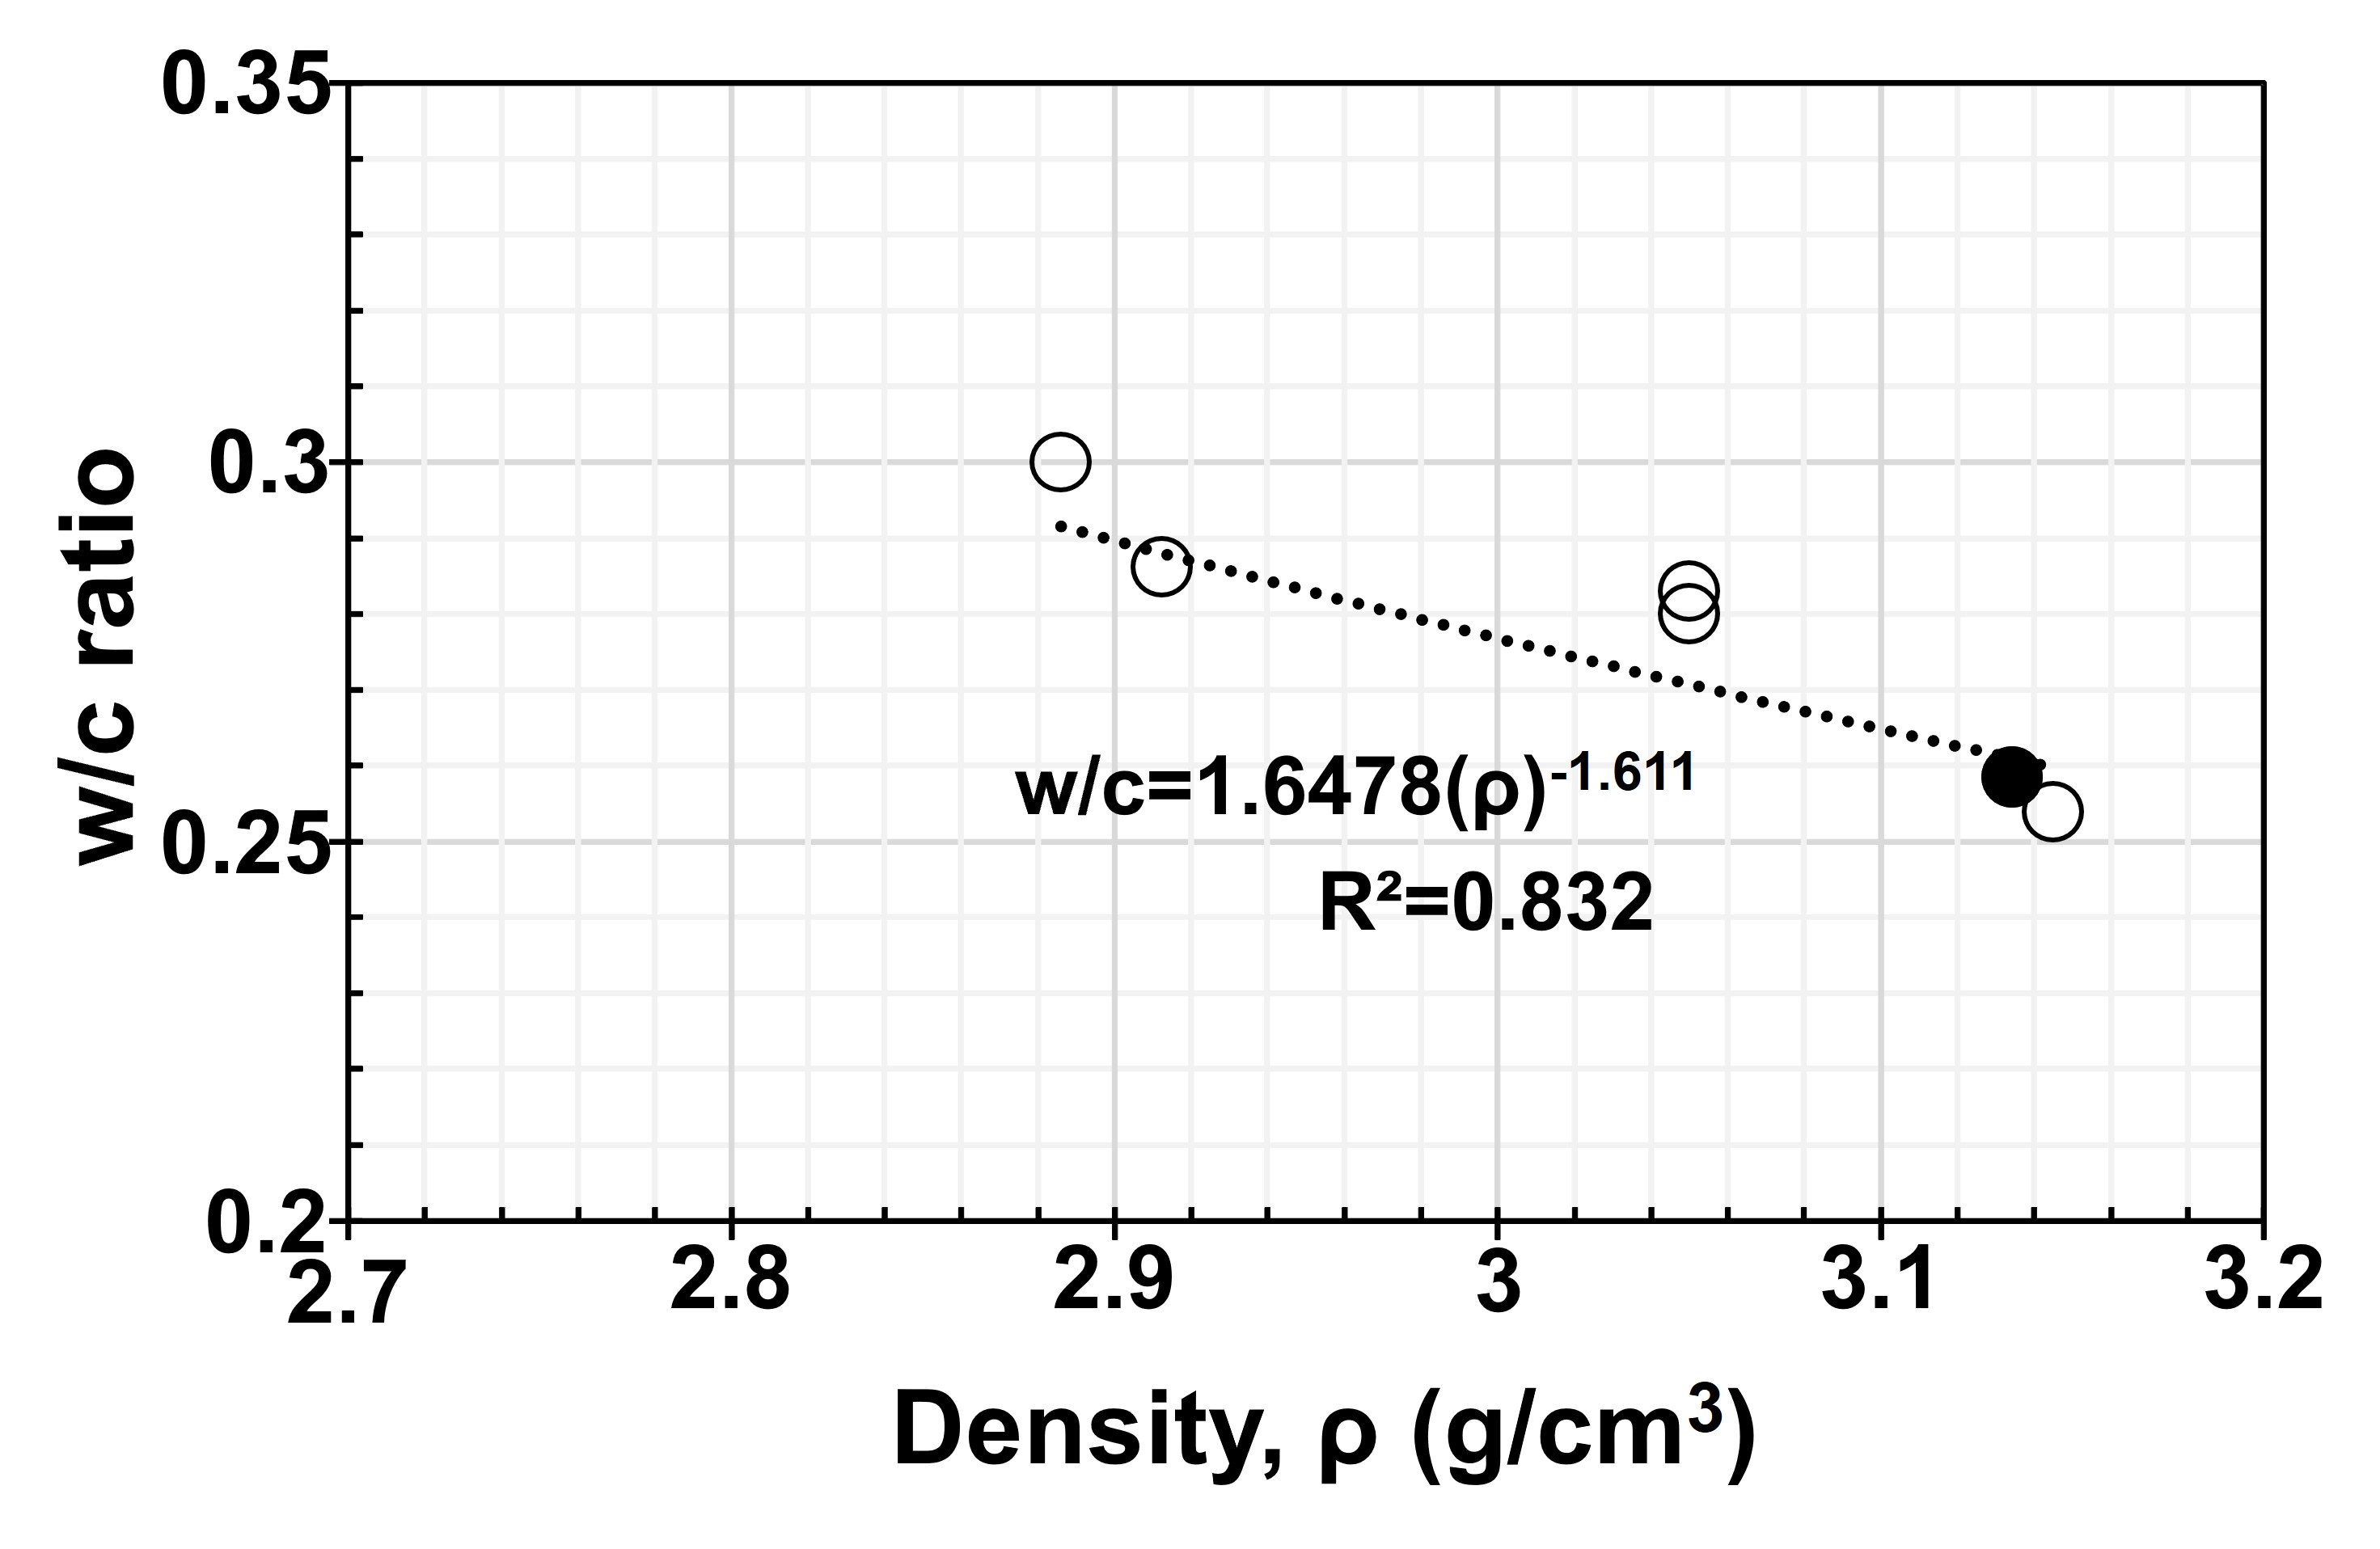
Marginal information is available in the literature regarding the performance of Portland cement–based pastes when reducing clinker content with inert limestone fillers (ILSF) when the replacement is > 15%. In this research, six different blended Portland cements (BPCs) from two different brands were evaluated, all with loss of ignition (LOI) values ranging between 2% and 18%, estimating ILSF contents between 5% and 35%. The characterization of these BPCs was conducted through laboratory tests aimed at performance forecasting in the absence of their component proportions due to trademark secrecy. These tests included determining BPCs' fineness (or Blaine number, F), density (ρ), and LOI. Then, paste characterization was performed, including water content for paste normal consistency, initial and final setting times, determination of the luminosity coordinate *L from hardened paste specimens, and mortar compressive strength at 28 days. It was concluded that one way to overcome the misinformation about the composition of BPCs (clinker, pozzolans, or ILSF contents) is to obtain the LOI parameter, as it will help forecast the performance of new BPC formulations.

| [1] | Torres-Acosta A (2022) Why concrete road infrastructure in the country suffers damage in few years? AMIVTAC, 23-31 (in Spanish). |
| [2] | Torres-Acosta A (2024) Evidence of damage to recently inaugurated concrete infrastructure. What decisions do we continue making that prevent us from avoiding these damages? AMIVTAC, 30-37 (in Spanish). |
| [3] |
Villagrán-Zaccardi Y, Pareja R, Rojas L, et al. (2022) Overview of cement and concrete production in Latin America and the Caribbean with a focus on the goals of reaching carbon neutrality. RILEM Tech Lett 7: 30-46. https://doi.org/10.21809/rilemtechlett.2022.155 doi: 10.21809/rilemtechlett.2022.155

|
| [4] | NMX-C-414-ONNCCE-2017 (2017) Building industry-hydraulic cements-specifications and testing methods, ONNCCE, Mexico City, Mexico. Available from: https://onncce.org.mx/tienda?view=item&mc=65&mi=258. |
| [5] | ASTM International (2022) Standard specification for Portland cement. ASTM C-150. |
| [6] | Tennis PD, Thomas MDA, Weiss WJ, et al. (2011) State-of-the-Art Report on Use of Limestone in Cements at Levels of up to 15%, Skokie, Illinois, USA: Portland Cement Association. Available from: https://www.cement.org/wp-content/uploads/2024/06/2024-SN3148.03.pdf. |
| [7] | ASTM International (2021) Standard test method for compressive strength of hydraulic cement mortars. ASTM C-109. |
| [8] |
Ammar N, Zeghichi L (2017) The effect of limestone fineness on ternary cement fresh-state and early-age properties. Min Sci 24: 195-208. https://doi.org/10.5277/msc172412 doi: 10.5277/msc172412
|
| [9] | ASTM International (2023) Standard test method for density of hydraulic cement. ASTM C-188. |
| [10] | ASTM International (2023) Standard test method for fineness of hydraulic cement by air-permeability apparatus. ASTM C-204. |
| [11] | NMX-C-056-ONNCCE-2019 (2019) Building Industry-hydraulic cements-determination of fineness of hydraulic cements (air permeability method), ONNCCE, Mexico City, Mexico. Available from: https://onncce.org.mx/venta-de-normas/normas-onncce?view=item&mc=65&mi=953. |
| [12] | ASTM International (2023) Standard test methods for chemical analysis of hydraulic cement. ASTM C-114. |
| [13] | ASTM International (2020) Standard practice for mechanical mixing of hydraulic cement pastes and mortars of plastic consistency. ASTM C-305. |
| [14] | ASTM International (2021) Standard test methods for time of setting of hydraulic cement by Vicat needle. ASTM C-191. |
| [15] | ASTM International (2020) Standard practice for calculating yellowness and whiteness indices from instrumentally measured color coordinates. ASTM E-313. |
| [16] | Mindess S, Young JF, Darwin D (2003) Concrete, 2nd Eds, USA: American Concrete Institute. Available from: https://www.concrete.org/publications/internationalconcreteabstractsportal/m/details/id/18872 |
Figures(17) / Tables(6)

Andrés A. Torres-Acosta, Rafael A. Méndez-Páramo, Celene Arista-Perrusquía, Eduardo S. Herrera-Sosa, Samantha Reyes-Rodríguez. Portland cement paste performance when inert limestone filler is added as clinker replacement[J]. AIMS Materials Science, 2025, 12(2): 224-244. doi: 10.3934/matersci.2025012


 DownLoad: