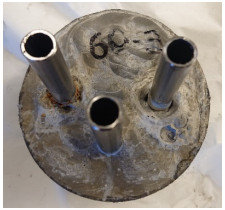
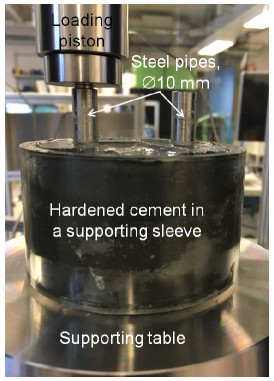
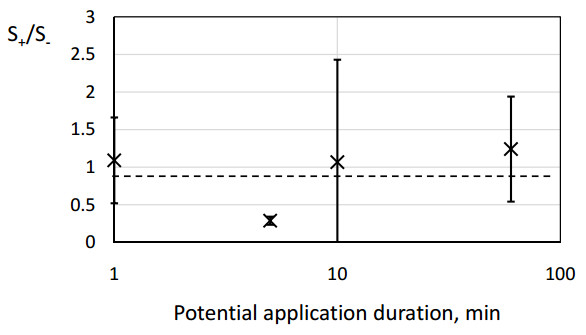
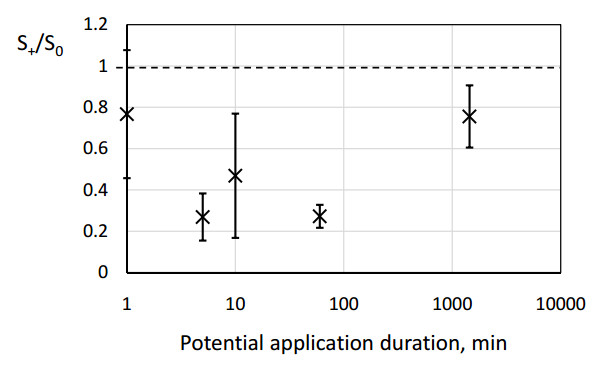
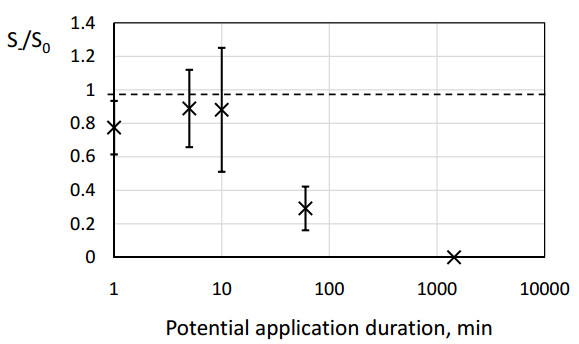
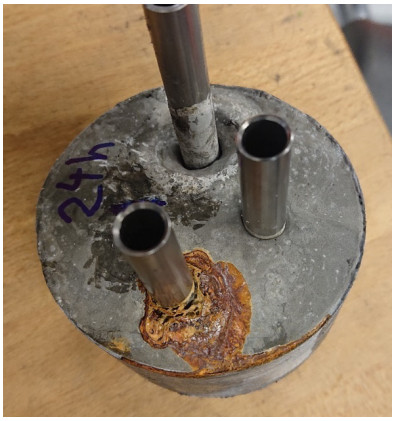
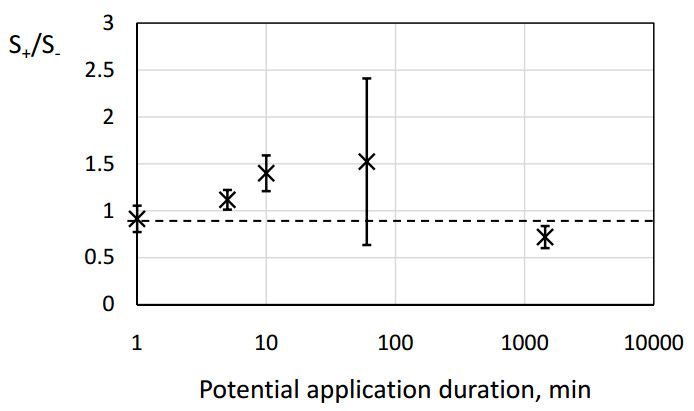
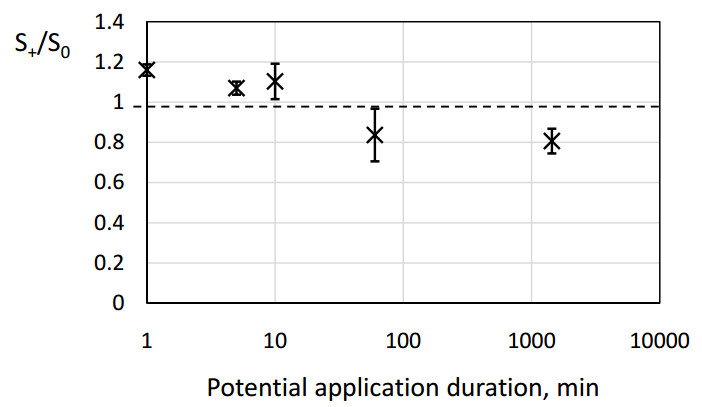
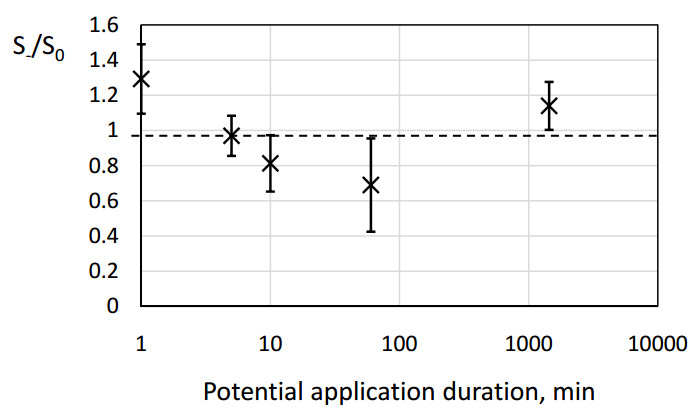
Cement-steel interfacial strength is an important measure for estimating the robustness and hydraulic sealing ability of wells. In this paper, laboratory experiments were performed in which small steel pipes (10 mm in diameter) were cemented in place within a Portland cement slurry under application of constant electrical potential difference between the pipes. The objective was to investigate whether there might be an observable difference between push-out strengths obtained with the pipes of different polarity (anode vs. cathode vs. reference nonpolarized pipe). The duration of the potential application and the magnitude of the potential difference were varied between the tests. The experiments demonstrated that at the higher potential difference (4 V), the duration of potential application had a noticeable effect on interfacial bonding. Application of 4 V for 24 h resulted in loss of bonding at cement-cathode interface, which could be attributed to massive water transportation to the cathode region by small radii cations. At the lower applied potential difference (1 V), there is an improvement in push-out strength at anode at short duration of potential application. This could be due to pore filling by precipitation of expansive minerals in pores and cement particles migration toward anode. The effect of potential on push-out strength in a hardened cement suggests that low potential difference applied for a short period of time might improve cement-steel interfacial strength.
Citation: Alexandre Lavrov, Benjamin Werner, Anna Stroisz, Thomas Monge Øia, Kamila Gawel, Malin Torsæter, Narjes Jafariesfad. Effect of electric field on push-out strength of cemented steel pipes[J]. AIMS Materials Science, 2021, 8(3): 373-389. doi: 10.3934/matersci.2021024
Cement-steel interfacial strength is an important measure for estimating the robustness and hydraulic sealing ability of wells. In this paper, laboratory experiments were performed in which small steel pipes (10 mm in diameter) were cemented in place within a Portland cement slurry under application of constant electrical potential difference between the pipes. The objective was to investigate whether there might be an observable difference between push-out strengths obtained with the pipes of different polarity (anode vs. cathode vs. reference nonpolarized pipe). The duration of the potential application and the magnitude of the potential difference were varied between the tests. The experiments demonstrated that at the higher potential difference (4 V), the duration of potential application had a noticeable effect on interfacial bonding. Application of 4 V for 24 h resulted in loss of bonding at cement-cathode interface, which could be attributed to massive water transportation to the cathode region by small radii cations. At the lower applied potential difference (1 V), there is an improvement in push-out strength at anode at short duration of potential application. This could be due to pore filling by precipitation of expansive minerals in pores and cement particles migration toward anode. The effect of potential on push-out strength in a hardened cement suggests that low potential difference applied for a short period of time might improve cement-steel interfacial strength.

| [1] | Nelson EB, Guillot D (2006) Well Cementing, 2nd Eds., Schlumberger. |
| [2] | Lavrov A, Torsæter M (2016) Physics and Mechanics of Primary Well Cementing, Springer. |
| [3] |
Bois AP, Garnier A, Rodot F, et al. (2011) How to prevent loss of zonal isolation through a comprehensive analysis of microannulus formation. SPE Drill Completion 26: 13-31. doi: 10.2118/124719-PA

|
| [4] |
Aursand P, Hammer M, Lavrov A, et al. (2017) Well integrity for CO2 injection from ships: Simulation of the effect of flow and material parameters on thermal stresses. Int J Greenh Gas Con 62: 130-141. doi: 10.1016/j.ijggc.2017.04.007
|
| [5] |
Lavrov A, Torsæter M (2018) All microannuli are not created equal: Role of uncertainty and stochastic properties in well leakage prediction. Int J Greenh Gas Con 79: 323-328. doi: 10.1016/j.ijggc.2018.09.001
|
| [6] | Carpenter RB, Brady JL, Blount CG (1992) The effects of temperature and cement admixes on bond strength. J Petrol Technol 44: 880-886. |
| [7] |
Carter LG, Evans GW (1964) A study of cement-pipe bonding. J Petrol Technol 16: 157-160. doi: 10.2118/764-PA
|
| [8] | Kakumoto M, Yoneda J, Tenma N, et al. (2012) Frictional strength between casing and cement under confining pressure. The 22nd International Offshore and Polar Engineering Conference, 77-82. |
| [9] |
Sanz B, Planas J, Sancho JM (2018) Study of the loss of bond in reinforced concrete specimens with accelerated corrosion by means of push-out tests. Constr Build Mater 160: 598-609. doi: 10.1016/j.conbuildmat.2017.11.093
|
| [10] | Lavrov A, Bhuiyan M, Stroisz A (2019) Push-out test: Why bother? J Petrol Sci Eng 172: 297-302. |
| [11] |
Lavrov A, Gawel K, Stroisz A, et al. (2017) Failure modes in three-point bending tests of cement-steel, cement-cement and cement-sandstone bi-material beams. Constr Build Mater 152: 880-886. doi: 10.1016/j.conbuildmat.2017.07.017
|
| [12] |
Lavrov A, Gawel K, Torsæter M (2016) Manipulating cement-steel interface by means of electric field: Experiment and potential applications. AIMS Mater Sci 3: 1199-1207. doi: 10.3934/matersci.2016.3.1199
|
| [13] |
Nachbaur L, Nkinamubanzi PC, Nonat A, et al. (1998) Electrokinetic properties which control the coagulation of silicate cement suspensions during early age hydration. J Colloid Interf Sci 202: 261-268. doi: 10.1006/jcis.1998.5445
|
| [14] |
Hodne H, Saasen A (2000) The effect of the cement zeta potential and slurry conductivity on the consistency of oil-well cement slurries. Cement Concrete Res 30: 1767-1772. doi: 10.1016/S0008-8846(00)00417-8
|
| [15] |
Lavrov A, Panduro EAC, Gawel K, et al. (2018) Electrophoresis-induced structural changes at cement-steel interface. AIMS Mater Sci 5: 414-421. doi: 10.3934/matersci.2018.3.414
|
| [16] | Westermeier R (2016) Electrophoresis in Practice, 5 Eds., Wiley. |
| [17] | Jafariesfad N, Geiker MR, Sangesland S, et al. (2020) Electrokinetics application in concrete and well construction. ASME 2020 39th International Conference on Ocean, Offshore and Arctic Engineering (OMAE 2020). |
| [18] | Magnusdottir L, Jonsson MT (2018) Geothermal well casings used as electrodes in a resistivity study at Reykjanes reservoir in Iceland. MDPI Proc 2: 475-480. |
| [19] |
Roy S, Cooper GA (1993) Prevention of bit balling in shales—Preliminary results. SPE Drill Compl 8: 195-200. doi: 10.2118/23870-PA
|
| [20] | Cooper GA, Roy S (1994) Prevention of bit balling by electro-osmosis. SPE Western Regional Meeting, 23-25. |
| [21] | Smith L, Mody FK, Hale A, et al. (1996) Successful field application of an electro-negative "coating" to reduce bit balling tendencies in water based mud. SPE/IADC Drilling Conference. |
| [22] |
Goudjil N, Djelal C, Vanhove Y, et al. (2014) Impact of temperature on the demoulding of concrete elements with a polarization process. Constr Build Mater 54: 402-412. doi: 10.1016/j.conbuildmat.2013.12.034
|
| [23] |
Goudjil N, Vanhove Y, Djelal C, et al. (2012) Electro-osmosis applied for formwork removal of concrete. J Adv Concr Technol 10: 301-312. doi: 10.3151/jact.10.301
|
| [24] |
Ihekwaba NM, Hope BB, Hansson CM (1996) Pull-out and bond degradation of steel rebars in ECE concrete. Cement Concrete Res 26: 267-282. doi: 10.1016/0008-8846(95)00210-3
|
| [25] | Atkins P, De Paula J (2013) Elements of Physical Chemistry, USA: Oxford University Press. |
| [26] |
Buenfeld NR, Glass GK, Hassanein AM, et al. (1998) Chloride transport in concrete subjected to electric field. J Mater Civil Eng 10: 220-228. doi: 10.1061/(ASCE)0899-1561(1998)10:4(220)
|
| [27] | Aligizaki KK (2012) Mechanisms of ion transport in cement-based materials during the application of corrosion mitigating electrical techniques. CORROSION 2012. |
| [28] |
Di Franco F, Zaffora A, Megna B, et al. (2021) Heterogeneous crystallization of zinc hydroxystannate on galvanized steel for enhancing the bond strength at the rebar/concrete interface. Chem Eng J 405: 126943. doi: 10.1016/j.cej.2020.126943
|
| [29] |
Li W, Fall M (2016) Sulphate effect on the early age strength and self-desiccation of cemented paste backfill. Constr Build Mater 106: 296-304. doi: 10.1016/j.conbuildmat.2015.12.124
|
| [30] |
Pokharel M, Fall M (2013) Combined influence of sulphate and temperature on the saturated hydraulic conductivity of hardened cemented paste backfill. Cement Concrete Comp 38: 21-28. doi: 10.1016/j.cemconcomp.2013.03.015
|
| [31] |
Liu H, Bu Y, Nazari A, et al. (2016) Low elastic modulus and expansive well cement system: The application of gypsum microsphere. Constr Build Mater 106: 27-34. doi: 10.1016/j.conbuildmat.2015.12.105
|
Figures(11) / Tables(3)

Alexandre Lavrov, Benjamin Werner, Anna Stroisz, Thomas Monge Øia, Kamila Gawel, Malin Torsæter, Narjes Jafariesfad. Effect of electric field on push-out strength of cemented steel pipes[J]. AIMS Materials Science, 2021, 8(3): 373-389. doi: 10.3934/matersci.2021024


 DownLoad: