Human T-lymphotropic virus type 2 (HTLV-2) and human immunodeficiency virus type 1 (HIV-1) are two infectious retroviruses that infect immune cells, CD8+ T cells and CD4+ T cells, respectively. Multiple studies have revealed co-infected patients with HTLV-2 and HIV-1. In this paper, we formulated a new mathematical model for the co-infection of HTLV-2 and HIV-1 in vivo. The HIV-1-specific B-cell response is included. Six ordinary differential equations made up the model, which depicted the interactions between uninfected CD4+ T cells, HIV-1-infected CD4+ T cells, HIV-1 particles, uninfected CD8+ T cells, HTLV-2-infected CD8+ T cells, and HIV-1-specific B cells. We carried out a thorough study of the model, demonstrating the boundedness and nonnegativity of the solutions. Additionally, we determined the equilibrium points and demonstrated, under specific conditions, their global stability. The global asymptotic stability of all equilibria was established by constructing appropriate Lyapunov functions and applying the Lyapunov-LaSalle asymptotic stability theorem. We provide numerical simulations to corroborate the theoretical findings. We investigated how the B-cell response affects the dynamics of HIV-1 and HTLV-2 co-infection. The results suggested that the B-cell response regulates and inhibits the spread of HIV-1. We present a comparison between HTLV-2 or HIV-1 mono-infections and co-infections with HTLV-2 and HIV-1. Our findings support earlier research, suggesting that co-infection with HTLV-2 may be able to maintain the behavior dynamics of the CD4+ T cells, inhibit HIV-1 replication, and postpone the onset of AIDS. However, co-infected patients with HTLV-2 and HIV-1 may experience a greater occurrence of HTLV-2-related T-cell malignant diseases.
Citation: A. M. Elaiw, E. A. Almohaimeed, A. D. Hobiny. Modeling the co-infection of HTLV-2 and HIV-1 in vivo[J]. Electronic Research Archive, 2024, 32(11): 6032-6071. doi: 10.3934/era.2024280
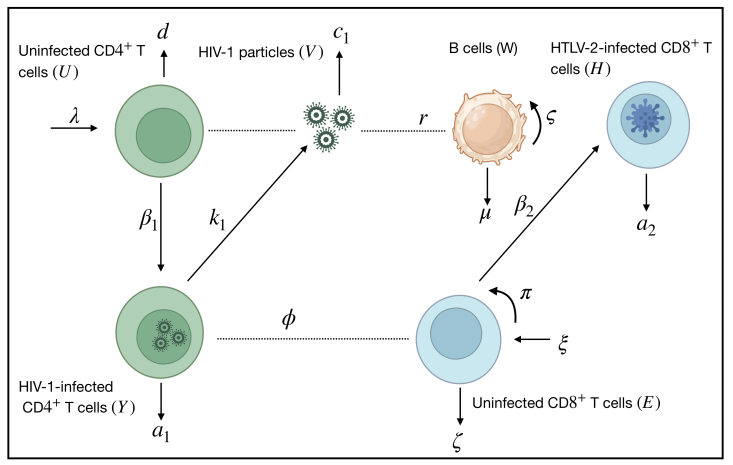
Human T-lymphotropic virus type 2 (HTLV-2) and human immunodeficiency virus type 1 (HIV-1) are two infectious retroviruses that infect immune cells, CD8+ T cells and CD4+ T cells, respectively. Multiple studies have revealed co-infected patients with HTLV-2 and HIV-1. In this paper, we formulated a new mathematical model for the co-infection of HTLV-2 and HIV-1 in vivo. The HIV-1-specific B-cell response is included. Six ordinary differential equations made up the model, which depicted the interactions between uninfected CD4+ T cells, HIV-1-infected CD4+ T cells, HIV-1 particles, uninfected CD8+ T cells, HTLV-2-infected CD8+ T cells, and HIV-1-specific B cells. We carried out a thorough study of the model, demonstrating the boundedness and nonnegativity of the solutions. Additionally, we determined the equilibrium points and demonstrated, under specific conditions, their global stability. The global asymptotic stability of all equilibria was established by constructing appropriate Lyapunov functions and applying the Lyapunov-LaSalle asymptotic stability theorem. We provide numerical simulations to corroborate the theoretical findings. We investigated how the B-cell response affects the dynamics of HIV-1 and HTLV-2 co-infection. The results suggested that the B-cell response regulates and inhibits the spread of HIV-1. We present a comparison between HTLV-2 or HIV-1 mono-infections and co-infections with HTLV-2 and HIV-1. Our findings support earlier research, suggesting that co-infection with HTLV-2 may be able to maintain the behavior dynamics of the CD4+ T cells, inhibit HIV-1 replication, and postpone the onset of AIDS. However, co-infected patients with HTLV-2 and HIV-1 may experience a greater occurrence of HTLV-2-related T-cell malignant diseases.

| [1] |
A. Araujo, N. Sheehy, H. Takahashi, W. W. Hall, Concomitant Infections with Human Immunodeficiency Virus Type 1 and Human T-Lymphotropic Virus Types 1 and 2, Polymicrobial Diseases, (2002), 75–97. https://doi.org/10.1128/9781555817947.ch5 doi: 10.1128/9781555817947.ch5

|
| [2] | UNAIDS: Global HIV & AIDS statistics-Fact sheet, 2024. Available from: https://www.unaids.org/sites/default/files/media_asset/UNAIDS_FactSheet_en.pdf. |
| [3] |
J. Esbjörnsson, M. Jansson, S. Jespersen, F. Månsson, B. L. Hønge, J. Lindman, et al., HIV-2 as a model to identify a functional HIV cure, AIDS Research and Therapy, 16 (2019), 24. https://doi.org/10.1186/s12981-019-0239-x doi: 10.1186/s12981-019-0239-x
|
| [4] | D. Wodarz, D. N. Levy, Human immunodeficiency virus evolution towards reduced replicative fitness in vivo and the development of AIDS, in Proceedings of the Royal Society B: Biological Sciences, 274 (2007), 2481–2491. https://doi.org/10.1098/rspb.2007.0413 |
| [5] |
M. T. Raza, S. Mizan, F. Yasmin, A. S. Akash, S. M. Shahik, Epitope-based universal vaccine for Human T-lymphotropic virus-1(HTLV-1), PLoS One, 16 (2021), e0248001. https://doi.org/10.1371/journal.pone.0248001 doi: 10.1371/journal.pone.0248001
|
| [6] |
A. Araujo, W. W. Hall, Human T-lymphotropic virus type Ⅱ and neurological disease, Ann. Neurol., 56 (2004), 10–19. https://doi.org/10.1002/ana.20126 doi: 10.1002/ana.20126
|
| [7] |
A. Gessain, O. Cassar, Epidemiological aspects and world distribution of HTLV-1 infection, Front. Microbiol., 3 (2012), 388. https://doi.org/10.3389/fmicb.2012.00388 doi: 10.3389/fmicb.2012.00388
|
| [8] |
E. L. Murphy, O. Cassar, A. Gessain, Estimating the number of HTLV-2 infected persons in the world, Retrovirology, 12 (2015), O5. https://doi.org/10.1186/1742-4690-12-S1-O5 doi: 10.1186/1742-4690-12-S1-O5
|
| [9] |
K. S. Jones, K. Fugo, C. Petrow-Sadowski, Y. Huang, D. C. Bertolette, I. Lisinski, et al., Human T-cell leukemia virus type 1 (HTLV-1) and HTLV-2 use different receptor complexes to enter T cells, J. Virol., 80 (2006), 8291–8302. https://doi.org/10.1128/jvi.00389-06 doi: 10.1128/jvi.00389-06
|
| [10] |
M. P. Martinez, J. Al-Saleem, P. L. Green, Comparative virology of HTLV-1 and HTLV-2, Retrovirology, 16 (2019), 1–12. https://doi.org/10.1186/s12977-019-0483-0 doi: 10.1186/s12977-019-0483-0
|
| [11] |
M. A. Beilke, Retroviral coinfections: HIV and HTLV: Taking stock of more than a quarter century of research, AIDS Res. Hum. Retroviruses, 28 (2012), 139–147. https://doi.org/10.1089/aid.2011.0342 doi: 10.1089/aid.2011.0342
|
| [12] |
D. Dhasmana, G. P. Taylor, Human T-lymphotropic virus/HIV co-infection: A clinical review, Curr. Opin. Infect. Dis., 27 (2014), 16–28. https://doi.org/10.1097/QCO.0000000000000027 doi: 10.1097/QCO.0000000000000027
|
| [13] |
C. C. Koech, R. M. Lwembe, E. O. Odari, N. L. M. Budambula, Prevalence and associated risk factors of HTLV/HIV co-infection among people who inject drugs (PWIDs): A review, J. Hum. Virol. Retrovirol., 6 (2018), 00188. https://doi.org/10.15406/jhvrv.2018.06.00188 doi: 10.15406/jhvrv.2018.06.00188
|
| [14] |
A. Caterino-de-Araujo, Sex, age, and risk group variations among individuals infected with HIV, HTLV-1, and HTLV-2: Review of data records (1983–2017) from a public health laboratory in São Paulo, Brazil, Sexes, 4 (2023), 638–655. https://doi.org/10.3390/sexes4040041 doi: 10.3390/sexes4040041
|
| [15] |
M. A. Nowak, C. R. M. Bangham, Population dynamics of immune responses to persistent viruses, Science, 272 (1996), 74–79. https://doi.org/10.1126/science.272.5258.74 doi: 10.1126/science.272.5258.74
|
| [16] |
D. Wodarz, R. M. May, M. A. Nowak, The role of antigen-independent persistence of memory cytotoxic T lymphocytes, Int. Immunol., 12 (2000), 467–477. https://doi.org/10.1093/intimm/12.4.467 doi: 10.1093/intimm/12.4.467
|
| [17] |
C. Jiang, H. Kong, G. Zhang, K. Wang, Global properties of a virus dynamics model with self-proliferation of CTLs, Math. Appl. Sci. Eng., 2 (2021), 123–133. https://doi.org/10.5206/mase/13822 doi: 10.5206/mase/13822
|
| [18] |
Y. Yang, R. Xu, Mathematical analysis of a delayed HIV infection model with saturated CTL immune response and immune impairment, J. Appl. Math. Comput., 68 (2022), 2365–2380. https://doi.org/10.1007/s12190-021-01621-x doi: 10.1007/s12190-021-01621-x
|
| [19] |
C. Chen, Y. Zhou, Dynamic analysis of HIV model with a general incidence, CTLs immune response and intracellular delays, Math. Comput. Simul., 212 (2023), 159–181. https://doi.org/10.1016/j.matcom.2023.04.029 doi: 10.1016/j.matcom.2023.04.029
|
| [20] |
C. Lv, L. Huang, Z. Yuan, Global stability for an HIV-1 infection model with Beddington-DeAngelis incidence rate and CTL immune response, Commun. Nonlinear Sci. Numer. Simul., 19 (2014), 121–127. https://doi.org/10.1016/j.cnsns.2013.06.025 doi: 10.1016/j.cnsns.2013.06.025
|
| [21] |
A. Murase, T. Sasaki, T. Kajiwara, Stability analysis of pathogen-immune interaction dynamics, J. Math. Biol., 51 (2005), 247–267. https://doi.org/10.1007/s00285-005-0321-y doi: 10.1007/s00285-005-0321-y
|
| [22] |
S. Wang, D. Zou, Global stability of in host viral models with humoral immunity and intracellular delays, Appl. Math. Modell., 36 (2012), 1313–1322. https://doi.org/10.1016/j.apm.2011.07.086 doi: 10.1016/j.apm.2011.07.086
|
| [23] |
T. Kajiwara, T. Sasaki, Y. Otani, Global stability for an age-structured multistrain virus dynamics model with humoral immunity, J. Appl. Math. Comput., 62 (2020), 239–279. https://doi.org/10.1007/s12190-019-01283-w doi: 10.1007/s12190-019-01283-w
|
| [24] |
M. Dhar, S. Samaddar, P. Bhattacharya, Modeling the effect of non-cytolytic immune response on viral infection dynamics in the presence of humoral immunity, Nonlinear Dyn., 98 (2019), 637–655. https://doi.org/10.1007/s11071-019-05219-8 doi: 10.1007/s11071-019-05219-8
|
| [25] |
J. Lin, R. Xu, X. Tian, Threshold dynamics of an HIV-1 virus model with both virus-to-cell and cell-to-cell transmissions, intracellular delay, and humoral immunity, Appl. Math. Comput., 315 (2017), 516–530. https://doi.org/10.1016/j.amc.2017.08.004 doi: 10.1016/j.amc.2017.08.004
|
| [26] |
Z. She, X. Jiang, Threshold dynamics of a general delayed within-host viral infection model with humoral immunity and two modes of virus transmission, Discrete Contin. Dyn. Syst.-Ser. B, 26 (2021), 3835–3861. https://doi.org/10.3934/dcdsb.2020259 doi: 10.3934/dcdsb.2020259
|
| [27] |
D. Wodarz, Hepatitis C virus dynamics and pathology: The role of CTL and antibody responses, J. Gen. Virol., 84 (2003), 1743–1750. https://doi.org/10.1099/vir.0.19118-0 doi: 10.1099/vir.0.19118-0
|
| [28] |
Z. Zhang, Y. Chen, X. Wang, L. Rong, Dynamic analysis of a latent HIV infection model with CTL immune and antibody responses, Int. J. Biomath., 17 (2024), 2350079. https://doi.org/10.1142/S1793524523500791 doi: 10.1142/S1793524523500791
|
| [29] |
J. Lin, R. Xu, X. Tian, Threshold dynamics of an HIV-1 model with both viral and cellular infections, cell-mediated and humoral immune responses, Math. Biosci. Eng., 16 (2018), 292–319. https://doi.org/10.3934/mbe.2019015 doi: 10.3934/mbe.2019015
|
| [30] |
T. Guo, Z. Qiu, L. Rong, Analysis of an HIV model with immune responses and cell-to-cell transmission, Bull. Malays. Math. Sci. Soc., 43 (2018), 581–607. https://doi.org/10.1007/s40840-018-0699-5 doi: 10.1007/s40840-018-0699-5
|
| [31] | M. A. Nowak, R. M. May, Virus Dynamics, Oxford University Press, New York, 2000. |
| [32] |
R. Arnaout, M. Nowak, D. Wodarz, HIV-1 dynamics revisited: Biphasic decay by cytotoxic lymphocyte killing?, Proc. R. Soc. London. Ser. B: Biol. Sci., 267 (1450), 1347–1354. https://doi.org/10.1098/rspb.2000.1149 doi: 10.1098/rspb.2000.1149
|
| [33] |
B. J. Nath, K. Sadri, H. K. Sarmah, K. Hosseini, An optimal combination of antiretroviral treatment and immunotherapy for controlling HIV infection, Math. Comput. Simul., 217 (2024), 226–243. https://doi.org/10.1016/j.matcom.2023.10.012 doi: 10.1016/j.matcom.2023.10.012
|
| [34] |
D. Adak, N. Bairagi, Bifurcation analysis of a multidelayed HIV model in presence of immune response and understanding of in-host viral dynamics, Math. Methods Appl. Sci., 42 (2019), 4256–4272. https://doi.org/10.1002/mma.5645 doi: 10.1002/mma.5645
|
| [35] |
M. Dhar, S. Samaddar, P. Bhattacharya, Modeling the cell-to-cell transmission dynamics of viral infection under the exposure of non-cytolytic cure, J. Appl. Math. Comput., 65 (2021), 885–911. https://doi.org/10.1007/s12190-020-01420-w doi: 10.1007/s12190-020-01420-w
|
| [36] |
H. Miao, Z. Teng, C. Kang, A. Muhammadhaji, Stability analysis of a virus infection model with humoral immunity response and two time delays, Math. Methods Appl. Sci., 39 (2016), 3434–3449. https://doi.org/10.1002/mma.3790 doi: 10.1002/mma.3790
|
| [37] |
P. Dubey, U. S. Dubey, B. Dubey, Modeling the role of acquired immune response and antiretroviral therapy in the dynamics of HIV infection, Math. Comput. Simul., 144 (2018), 120–137. https://doi.org/10.1016/j.matcom.2017.07.006 doi: 10.1016/j.matcom.2017.07.006
|
| [38] |
A.P. Wang, M. Y. Li, Viral dynamics of HIV-1 with CTL immune response, Discrete Contin. Dyn. Syst.-Ser. B, 26 (2021), 2257–2272. https://doi.org/10.3934/dcdsb.2020212 doi: 10.3934/dcdsb.2020212
|
| [39] |
Z. Hu, J. Yang, Q. Li, S. Liang, D. Fan, Mathematical analysis of stability and Hopf bifurcation in a delayed HIV infection model with saturated immune response, Math. Methods Appl. Sci., 47 (2024), 9834–9857. https://doi.org/10.1002/mma.10097 doi: 10.1002/mma.10097
|
| [40] |
M. Tan, G. Lan, C. Wei, Dynamic analysis of HIV infection model with CTL immune response and cell-to-cell transmission, Appl. Math. Lett., 156 (2024), 109140. https://doi.org/10.1016/j.aml.2024.109140 doi: 10.1016/j.aml.2024.109140
|
| [41] |
X. Duan, S. Yuan, Global dynamics of an age-structured virus model with saturation effects, Math. Methods Appl. Sci., 40 (2017), 1851–1864. https://doi.org/10.1002/mma.4102 doi: 10.1002/mma.4102
|
| [42] |
E. Avila-Vales, Á. G. Pérez, Global properties of an age-structured virus model with saturated antibody-immune response, multi-target cells, and general incidence rate, Bol. Soc. Mat. Mex., 27 (2021), 26. https://doi.org/10.1007/s40590-021-00315-5 doi: 10.1007/s40590-021-00315-5
|
| [43] |
S. Chowdhury, J. K. Ghosh, U. Ghosh, Co-infection dynamics between HIV-HTLV-I disease with the effects of Cytotoxic T-lymphocytes, saturated incidence rate and study of optimal control, Math. Comput. Simul., 223 (2024), 195–218. https://doi.org/10.1016/j.matcom.2024.04.015 doi: 10.1016/j.matcom.2024.04.015
|
| [44] |
G. Doitsh, N. Galloway, X. Geng, Z. Yang, K. M. Monroe, O. Zepeda, et al., Cell death by pyroptosis drives CD4 T-cell depletion in HIV-1 infection, Nature, 505 (2014), 509–514. http://doi.org/10.1038/nature12940 doi: 10.1038/nature12940
|
| [45] |
W. Wang, W. Ma, Z. Feng, Complex dynamics of a time periodic nonlocal and time-delayed model of reaction-diffusion equations for modeling CD4+ T cells decline, J. Comput. Appl. Math., 367 (2020), 112430. http://doi.org/10.1016/j.cam.2019.112430 doi: 10.1016/j.cam.2019.112430
|
| [46] |
S. Wang, P. Hottz, M. Schechter, L. Rong, Modeling the slow CD4+ T cell decline in HIV-infected individuals, PLoS Comput. Biol., 11 (2015), e1004665. https://doi.org/10.1371/journal.pcbi.1004665 doi: 10.1371/journal.pcbi.1004665
|
| [47] |
W. Wang, T. Zhang, Caspase-1-mediated pyroptosis of the predominance for driving CD4+ T cells death: a nonlocal spatial mathematical model, Bull. Math. Biol., 80 (2018), 540–582. https://doi.org/10.1007/s11538-017-0389-8 doi: 10.1007/s11538-017-0389-8
|
| [48] |
W. Wang, Z. Feng, Global dynamics of a diffusive viral infection model with spatial heterogeneity, Nonlinear Anal. Real World Appl., 72 (2023), 103763. https://doi.org/10.1016/j.nonrwa.2022.10376 doi: 10.1016/j.nonrwa.2022.10376
|
| [49] |
W. Wang, X. Ren, W. Ma, X. Lai, New insights into pharmacologic inhibition of pyroptotic cell death by necrosulfonamide: A PDE model, Nonlinear Anal. Real World Appl., 56 (2020), 103173. https://doi.org/10.1016/j.nonrwa.2020.103173 doi: 10.1016/j.nonrwa.2020.103173
|
| [50] |
W. Wang, X. Ren, X. Wang, Spatial-temporal dynamics of a novel PDE model: Applications to pharmacologic inhibition of pyroptosis by necrosulfonamide, Commun. Nonlinear Sci. Numer. Simul., 103 (2021), 106025. https://doi.org/10.1016/j.cnsns.2021.106025 doi: 10.1016/j.cnsns.2021.106025
|
| [51] |
A. M. Elaiw, N. H. AlShamrani, A. D. Hobiny, Mathematical modeling of HIV/HTLV co-infection with CTL-mediated immunity, AIMS Math., 6 (2021), 1634–1676. https://doi.org/10.3934/math.2021098 doi: 10.3934/math.2021098
|
| [52] |
A. M. Elaiw, N. H. AlShamrani, Analysis of a within-host HIV/HTLV-I co-infection model with immunity, Virus Res., 295 (2021), 198204. https://doi.org/10.1016/j.virusres.2020.198204 doi: 10.1016/j.virusres.2020.198204
|
| [53] |
H. Yang, X. Li, W. Zhang, A stochastic HIV/HTLV-I co-infection model incorporating the aids-related cancer cells, Discrete Contin. Dyn. Syst.-Ser. B, 29 (2024), 702–730. https://doi.org/10.3934/dcdsb.2023110 doi: 10.3934/dcdsb.2023110
|
| [54] |
A. S. Perelson, D. E. Kirschner, R. De Boer, Dynamics of HIV-1 infection of CD4+ T cells, Math. Biosci., 114 (1993), 81–125. https://doi.org/10.1016/0025-5564(93)90043-a doi: 10.1016/0025-5564(93)90043-a
|
| [55] |
R. V. Culshaw, S. Ruan, A delay-differential equation model of HIV infection of CD4+T-cells, Math. Biosci., 165 (2000), 27–39. https://doi.org/10.1016/S0025-5564(00)00006-7 doi: 10.1016/S0025-5564(00)00006-7
|
| [56] |
M. M. Hadjiandreou, R. Conejeros, V. S. Vassiliadis, Towards a long-term model construction for the dynamic simulation of HIV-1 infection, Math. Biosci. Eng., 4 (2007), 489–504. https://doi.org/10.3934/mbe.2007.4.489 doi: 10.3934/mbe.2007.4.489
|
| [57] |
E. A. Hernandez-Vargas, R. H. Middleton, Modeling the three stages in HIV infection, J. Theor. Biol., 320 (2013), 33–40. https://doi.org/10.1016/j.jtbi.2012.11.028 doi: 10.1016/j.jtbi.2012.11.028
|
| [58] |
B. E. L. Boukari, N. Yousfi, A delay differential equation model of HIV infection, with therapy and CTL response, Bull. Math. Sci. Appl., 9 (2014), 53–68. https://doi.org/10.18052/www.scipress.com/BMSA.9.53 doi: 10.18052/www.scipress.com/BMSA.9.53
|
| [59] |
P. Ngina, R. W. Mbogo, L. S. Luboobi, HIV drug resistance: insights from mathematical modelling, Appl. Math. Modell., 75 (2019), 141–161. https://doi.org/10.1016/j.apm.2019.04.040 doi: 10.1016/j.apm.2019.04.040
|
| [60] |
B. Szomolay, E. M. Lungu, A mathematical model for the treatment of AIDS-related Kaposi's sarcoma, J. Biol. Syst., 22 (2014), 495–522. https://doi.org/10.1142/S0218339014500247 doi: 10.1142/S0218339014500247
|
| [61] | H. L. Smith, P. Waltman, The Theory of the Chemostat: Dynamics of Microbial Competition, Cambridge University Press, 1995. http://doi.org/10.1017/CBO9780511530043 |
| [62] |
A. Korobeinikov, Global properties of basic virus dynamics models, Bull. Math. Biol., 66 (2004), 879–883. https://doi.org/10.1016/j.bulm.2004.02.001 doi: 10.1016/j.bulm.2004.02.001
|
| [63] | E. A. Barbashin, Introduction to the Theory of Stability, Wolters-Noordhoff, Groningen, 1970. https://doi.org/10.1007/978-1-4612-4046-4 |
| [64] | J. P. LaSalle, The Stability of Dynamical Systems, SIAM, Philadelphia, 1976. https://doi.org/10.1137/1.9781611970432 |
| [65] | A. M. Lyapunov, The General Problem of the Stability of Motion, Taylor & Francis, Ltd., London, 1992. https://doi.org/10.1080/00207179208934253 |
| [66] | J. K. Hale, S. M. V. Lunel, Introduction to Functional Differential Equations, Springer-Verlag, New York, 1993. https://doi.org/10.1007/978-1-4612-4342-7 |
| [67] |
C. Casoli, E. Vicenzi, A. Cimarelli, G. Magnani, P. Ciancianaini, E. Cattaneo, et al., HTLV-Ⅱ down-regulates HIV-1 replication in IL-2–stimulated primary PBMC of coinfected individuals through expression of MIP-1α, Blood, 95 (2000), 2760–2769. https://doi.org/10.1182/blood.V95.9.2760.009k04_2760_2769 doi: 10.1182/blood.V95.9.2760.009k04_2760_2769
|
| [68] |
A. Q. C. Araujo, Neurological aspects of HIV-1/HTLV-1 and HIV-1/HTLV-2 coinfection, Pathogens, 9 (2020), 250. https://doi.org/10.3390/pathogens9040250 doi: 10.3390/pathogens9040250
|
| [69] |
E. Pilotti, M. V. Bianchi, A. D. Maria, F. Bozzano, M. G. Romanelli, U. Bertazzoni, et al., HTLV-1/-2 and HIV-1 co-infections: retroviral interference on host immune status, Front. Microbiol., 4 (2013), 372. https://doi.org/10.3389/fmicb.2013.00372 doi: 10.3389/fmicb.2013.00372
|
| [70] |
M. Turci, E. Pilotti, P. Ronzi, G. Magnani, A. Boschini, S. G. Parisi, et al., Coinfection with HIV-1 and human T-Cell lymphotropic virus type Ⅱ in intravenous drug users is associated with delayed progression to AIDS, JAIDS J. Acquired Immune Defic. Syndr., 41 (2006), 100–106. https://doi.org/10.1097/01.qai.0000179426.04166.12 doi: 10.1097/01.qai.0000179426.04166.12
|
| [71] |
S. Bassani, M. López, C. Toro, V. Jimenez, J. M. Sempere, V. Soriano, et al., Influence of human T cell Lymphotropic virus type 2 coinfection on virological and immunological parameters in HIV type 1–infected patients, Clin. Infect. Dis., 44 (2007), 105–110. https://doi.org/10.1086/510076 doi: 10.1086/510076
|


Figures(10) / Tables(3)
A. M. Elaiw, E. A. Almohaimeed, A. D. Hobiny. Modeling the co-infection of HTLV-2 and HIV-1 in vivo[J]. Electronic Research Archive, 2024, 32(11): 6032-6071. doi: 10.3934/era.2024280


 DownLoad: