The pyramidal neuronal population (PY) in the cerebral cortex is closely related to epilepsy, while the excitability of PY is directly affected by the excitatory interneurons (EIN), the inhibitory interneurons (IN), and the thalamic relay nucleus (TC). Based on this, we use the thalamocortical neural field model to explore the dynamic mechanism of system transition by taking the synaptic connection strengths of the above three nuclei on PY as the main factor affecting seizures. The results show that the excitatory effects of EIN on PY induce transitions from 1-spike and wave discharges (SWDs) to 2-spike and wave discharges (2-SWDs), the inhibitory effects of IN on PY induce transitions from saturated state to tonic oscillation state, and the excitatory effects of TC on PY induce transitions from clonic oscillation state to saturated state. According to the single-parameter bifurcation analysis, it is found that Hopf and fold limit cycle bifurcations are the key factors leading to the state transition. In addition, the state analysis of the three pathways is carried out in pairs. The results show that the system produces more types of epileptic seizures with the combined action of EIN and TC on PY. According to the two-parameter bifurcation curve, we obtain the stable parameter areas of tonic-clonic oscillations, SWDs, 2-SWDs and saturated discharges, and clearly find the reasonable transition path between tonic-clonic seizures and absence seizures. This may provide some theoretical guidance for the transmission and evolution of seizures.
Citation: Zhihui Wang, Yanying Yang, Lixia Duan. Dynamic mechanism of epileptic seizures induced by excitatory pyramidal neuronal population[J]. Electronic Research Archive, 2023, 31(8): 4427-4442. doi: 10.3934/era.2023226
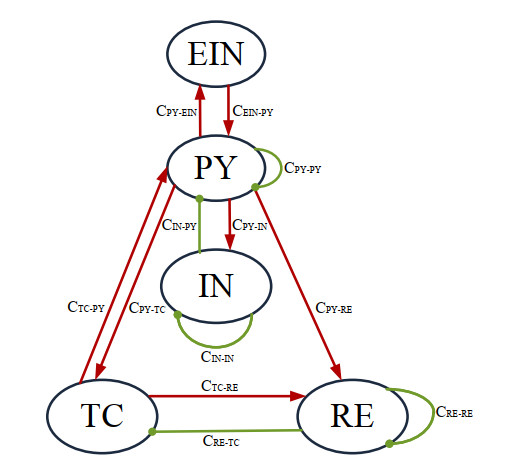
The pyramidal neuronal population (PY) in the cerebral cortex is closely related to epilepsy, while the excitability of PY is directly affected by the excitatory interneurons (EIN), the inhibitory interneurons (IN), and the thalamic relay nucleus (TC). Based on this, we use the thalamocortical neural field model to explore the dynamic mechanism of system transition by taking the synaptic connection strengths of the above three nuclei on PY as the main factor affecting seizures. The results show that the excitatory effects of EIN on PY induce transitions from 1-spike and wave discharges (SWDs) to 2-spike and wave discharges (2-SWDs), the inhibitory effects of IN on PY induce transitions from saturated state to tonic oscillation state, and the excitatory effects of TC on PY induce transitions from clonic oscillation state to saturated state. According to the single-parameter bifurcation analysis, it is found that Hopf and fold limit cycle bifurcations are the key factors leading to the state transition. In addition, the state analysis of the three pathways is carried out in pairs. The results show that the system produces more types of epileptic seizures with the combined action of EIN and TC on PY. According to the two-parameter bifurcation curve, we obtain the stable parameter areas of tonic-clonic oscillations, SWDs, 2-SWDs and saturated discharges, and clearly find the reasonable transition path between tonic-clonic seizures and absence seizures. This may provide some theoretical guidance for the transmission and evolution of seizures.

| [1] |
I. E. Scheffer, S. Berkovic, G. Capovilla, M. B. Connolly, J. French, L. Guilhoto, et al., ILAE classification of the epilepsies: position paper of the ILAE commission for classification and terminology, Epilepsia, 58 (2017), 512–521. https://doi.org/10.1111/epi.13709 doi: 10.1111/epi.13709

|
| [2] |
C. Mayville, T. Fakhoury, B. Abou-Khalil, Absence seizures with evolution into generalized Tonic-Clonic activity: clinical and EEG features, Epilepsia, 41 (2000), 391–394. https://doi.org/10.1111/j.1528-1157.2000.tb00178.x doi: 10.1111/j.1528-1157.2000.tb00178.x
|
| [3] |
C. P. Panayiotopoulos, Typical absence seizures and related epileptic syndromes: assessment of current state and directions for future research, Epilepsia, 49 (2008), 2131–2139. https://doi.org/10.1111/j.1528-1167.2008.01777.x doi: 10.1111/j.1528-1167.2008.01777.x
|
| [4] |
F. Marten, S. Rodrigues, O. Benjamin, M. P. Richardson, J. R. Terry, Onset of polyspike complexes in a mean-field model of human electroencephalography and its application to absence epilepsy, Phil. Trans. R. Soc. A, 367 (2009), 1145–1161. https://doi.org/10.1098/rsta.2008.0255 doi: 10.1098/rsta.2008.0255
|
| [5] |
P. Jain, Absence seizures in children: usual and the unusual, Indian J. Pediatr., 87 (2020), 1047–1056. https://doi.org/10.1007/s12098-020-03423-8 doi: 10.1007/s12098-020-03423-8
|
| [6] |
A. Depaulis, O. David, S. Charpier, The genetic absence epilepsy rat from strasbourg as a model to decipher the neuronal and network mechanisms of generalized idiopathic epilepsies, J. Neurosci. Methods, 260 (2016), 159–174. https://doi.org/10.1016/j.jneumeth.2015.05.022 doi: 10.1016/j.jneumeth.2015.05.022
|
| [7] |
A. B. Holt, T. I. Netoff, Computational modeling of epilepsy for an experimental neurologist, Exp. Neurol., 244 (2013), 75–86. https://doi.org/10.1016/j.expneurol.2012.05.003 doi: 10.1016/j.expneurol.2012.05.003
|
| [8] |
H. K. M. Meeren, J. P. M. Pijn, E. L. J. M. van Luijtelaar, A. M. L. Coenen, F. H. Lopes da Silva, Cortical focus drives widespread corticothalamic networks during spontaneous absence seizures in rats, J. Neurosci., 22 (2002), 1480–1495. https://doi.org/10.1523/JNEUROSCI.22-04-01480.2002 doi: 10.1523/JNEUROSCI.22-04-01480.2002
|
| [9] |
G. Avanzini, F. Panzica, M. De Curtis, The role of the thalamus in vigilance and epileptogenic mechanisms, Clin. Neurophysiol., 111 (2000), S19–S26. https://doi.org/10.1016/S1388-2457(00)00398-9 doi: 10.1016/S1388-2457(00)00398-9
|
| [10] |
M. V. Sysoeva, A. Lüttjohann, G. van Luijtelaar, I. V. Sysoev, Dynamics of directional coupling underlying spike-wave discharges, Neuroscience, 314 (2016), 75–89. https://doi.org/10.1016/j.neuroscience.2015.11.044 doi: 10.1016/j.neuroscience.2015.11.044
|
| [11] |
J. Zhao, Q. Wang, The dynamical role of electromagnetic induction in epileptic seizures: a double-edged sword, Nonlinear Dyn., 106 (2021), 975–988. https://doi.org/10.1007/s11071-021-06855-9 doi: 10.1007/s11071-021-06855-9
|
| [12] |
Z. Wang, L. Duan, The combined effects of the thalamic feed-forward inhibition and feed-back inhibition in controlling absence seizures, Nonlinear Dyn., 108 (2022), 191–205. https://doi.org/10.1007/s11071-021-07178-5 doi: 10.1007/s11071-021-07178-5
|
| [13] |
V. E. Okhotin, Cytophysiology of spiny stellate cells in the striate cortex and their role in the excitatory mechanisms of intracortical synaptic circulation, Neurosci. Behav. Physiol., 36 (2006), 825–836. https://doi.org/10.1007/s11055-006-0093-x doi: 10.1007/s11055-006-0093-x
|
| [14] |
M. Steriade, Interneuronal epileptic discharges related to spike-and-wave cortical seizures in behaving monkeys, Electroencephalogr. Clin. Neurophysiol., 37 (1974), 247–263. https://doi.org/10.1016/0013-4694(74)90028-5 doi: 10.1016/0013-4694(74)90028-5
|
| [15] |
M. Steriade, D. Contreras, Spike-wave complexes and fast components of cortically generated seizures. I. Role of neocortex and thalamus, J. Neurophysiol., 80 (1998), 1439–1455. https://doi.org/10.1152/jn.1998.80.3.1439 doi: 10.1152/jn.1998.80.3.1439
|
| [16] |
S. Tabatabaee, F. Bahrami, M. Janahmadi, The critical modulatory role of spiny stellate cells in seizure onset based on dynamic analysis of a neural mass model, Front. Neurosci., 15 (2021), 743720. https://doi.org/10.3389/fnins.2021.743720 doi: 10.3389/fnins.2021.743720
|
| [17] |
L. Yan, H. Zhang, Z. Sun, S. Liu, Y. Liu, P. Xiao, Optimization of stimulation waveforms for regulating spike-wave discharges in a thalamocortical model, Chaos, Solitons Fractals, 158 (2022), 112025. https://doi.org/10.1016/j.chaos.2022.112025 doi: 10.1016/j.chaos.2022.112025
|
| [18] |
A. L. Yan, B. H. Zhang, C. Z. Sun, D. Z. Cao, E. Z. Shen, F. Y. Zhao, Mechanism analysis for excitatory interneurons dominating poly-spike wave and optimization of electrical stimulation, Chaos, 32 (2022), 033110. https://doi.org/10.1063/5.0076439 doi: 10.1063/5.0076439
|
| [19] |
H. Zhang, Z. Shen, Q. Zhao, L. Yan, L. Du, Z. Deng, Dynamic transitions of epilepsy waveforms induced by astrocyte dysfunction and electrical stimulation, Neural Plast., 2020 (2020), 8867509. https://doi.org/10.1155/2020/8867509 doi: 10.1155/2020/8867509
|
| [20] |
Y. Xie, R. Zhu, X. Tan, Y. Chai, Inhibition of absence seizures in a reduced corticothalamic circuit via closed-loop control, Electron. Res. Arch., 31 (2023), 2651–2666. https://doi.org/10.3934/era.2023134 doi: 10.3934/era.2023134
|
| [21] |
H. R. Wilson, J. D. Cowan, Excitatory and inhibitory interactions in localized populations of model neurons, Biophys. J., 12 (1972), 1–24. https://doi.org/10.1016/S0006-3495(72)86068-5 doi: 10.1016/S0006-3495(72)86068-5
|
| [22] |
S. I. Amari, Dynamics of pattern formation in lateral-inhibition type neural fields, Biol. Cybern., 27 (1977), 77–87. https://doi.org/10.1007/BF00337259 doi: 10.1007/BF00337259
|
| [23] | P. N. Taylor, G. Baier, S. S. Cash, J. Dauwels, J. J. Slotine, Y. Wang, A model of stimulus induced epileptic spike-wave discharges, in 2013 IEEE Symposium on Computational Intelligence, Cognitive Algorithms, Mind, and Brain (CCMB), (2013), 53–59. https://doi.org/10.1109/CCMB.2013.6609165 |
| [24] |
D. Fan, L. Duan, Q. Wang, G. Luan, Combined effects of feedforward inhibition and excitation in thalamocortical circuit on the transitions of epileptic seizures, Front. Comput. Neurosci., 11 (2017), 59. https://doi.org/10.3389/fncom.2017.00059 doi: 10.3389/fncom.2017.00059
|
| [25] |
Y. Cao, X. He, Y. Hao, Q. Wang, Transition dynamics of epileptic seizures in the coupled thalamocortical network model, Int. J. Bifurcation Chaos, 28 (2018), 1850104. https://doi.org/10.1142/S0218127418501043 doi: 10.1142/S0218127418501043
|
| [26] |
Q. Zhu, M. Li, F. Han, Hopf bifurcation control of the ML neuron model with Hc bifurcation type, Electron. Res. Arch., 30 (2022), 615–632. https://doi.org/10.3934/era.2022032 doi: 10.3934/era.2022032
|
| [27] |
K. H. Yang, P. J. Franaszczuk, G. K. Bergey, The influence of synaptic connectivity on the pattern of bursting behavior in model pyramidal cells, Neurocomputing, 44–46 (2002), 233–242. https://doi.org/10.1016/S0925-2312(02)00439-3 doi: 10.1016/S0925-2312(02)00439-3
|
| [28] | M. Vergnes, C. Marescaux, Cortical and thalamic lesions in rats with genetic absence epilepsy, in Generalized Non-Convulsive Epilepsy: Focus on GABA-B Receptors, (1992), 71–83. https://doi.org/10.1007/978-3-7091-9206-1_5 |
| [29] |
G. van Luijtelaar, E. Sitnikova, A. Lüttjohann, On the origin and suddenness of absences in genetic absence models, Clin. EEG Neurosci., 42 (2011), 83–97. https://doi.org/10.1177/155005941104200209 doi: 10.1177/155005941104200209
|
| [30] |
Y. C. Yang, G. H. Wang, A. Y. Chuang, S. W. Hsueh, Perampanel reduces paroxysmal depolarizing shift and inhibitory synaptic input in excitatory neurons to inhibit epileptic network oscillations, Br. J. Pharmacol., 177 (2020), 5177–5194. https://doi.org/10.1111/bph.15253 doi: 10.1111/bph.15253
|
| [31] | Y. Yu, F. Han, Q. Wang, A hippocampal-entorhinal cortex neuronal network for dynamical mechanisms of epileptic seizure, in IEEE Transactions on Neural Systems and Rehabilitation Engineering, 31 (2023), 1986–1996. https://doi.org/10.1109/TNSRE.2023.3265581 |
| [32] |
P. N. Taylor, Y. Wang, M. Goodfellow, J. Dauwels, F. Moeller, U. Stephani, et al., A computational study of stimulus driven epileptic seizure abatement, PLoS One, 9 (2014), e114316. https://doi.org/10.1371/journal.pone.0114316 doi: 10.1371/journal.pone.0114316
|
| [33] |
D. Pinault, T. J. O'Brien, Cellular and network mechanisms of genetically determined absence seizures, Thalamus Relat. Syst., 3 (2005), 181–203. https://doi.org/10.1017/S1472928807000209 doi: 10.1017/S1472928807000209
|
| [34] |
N. C. Jones, M. R. Salzberg, G. Kumar, A. Couper, M. J. Morris, T. J. O'Brien, Elevated anxiety and depressive-like behavior in a rat model of genetic generalized epilepsy suggesting common causation, Exp. Neurol., 209 (2008), 254–260. https://doi.org/10.1016/j.expneurol.2007.09.026 doi: 10.1016/j.expneurol.2007.09.026
|
| [35] |
A. C. Errington, K. M. Gibson, V. Crunelli, D. W. Cope, Aberrant GABA receptor-mediated inhibition in cortico-thalamic networks of succinic semialdehyde dehydrogenase deficient mice, PLoS One, 6 (2011), e19021. https://doi.org/10.1371/journal.pone.0019021 doi: 10.1371/journal.pone.0019021
|


Figures(11) / Tables(1)
Zhihui Wang, Yanying Yang, Lixia Duan. Dynamic mechanism of epileptic seizures induced by excitatory pyramidal neuronal population[J]. Electronic Research Archive, 2023, 31(8): 4427-4442. doi: 10.3934/era.2023226


 DownLoad: