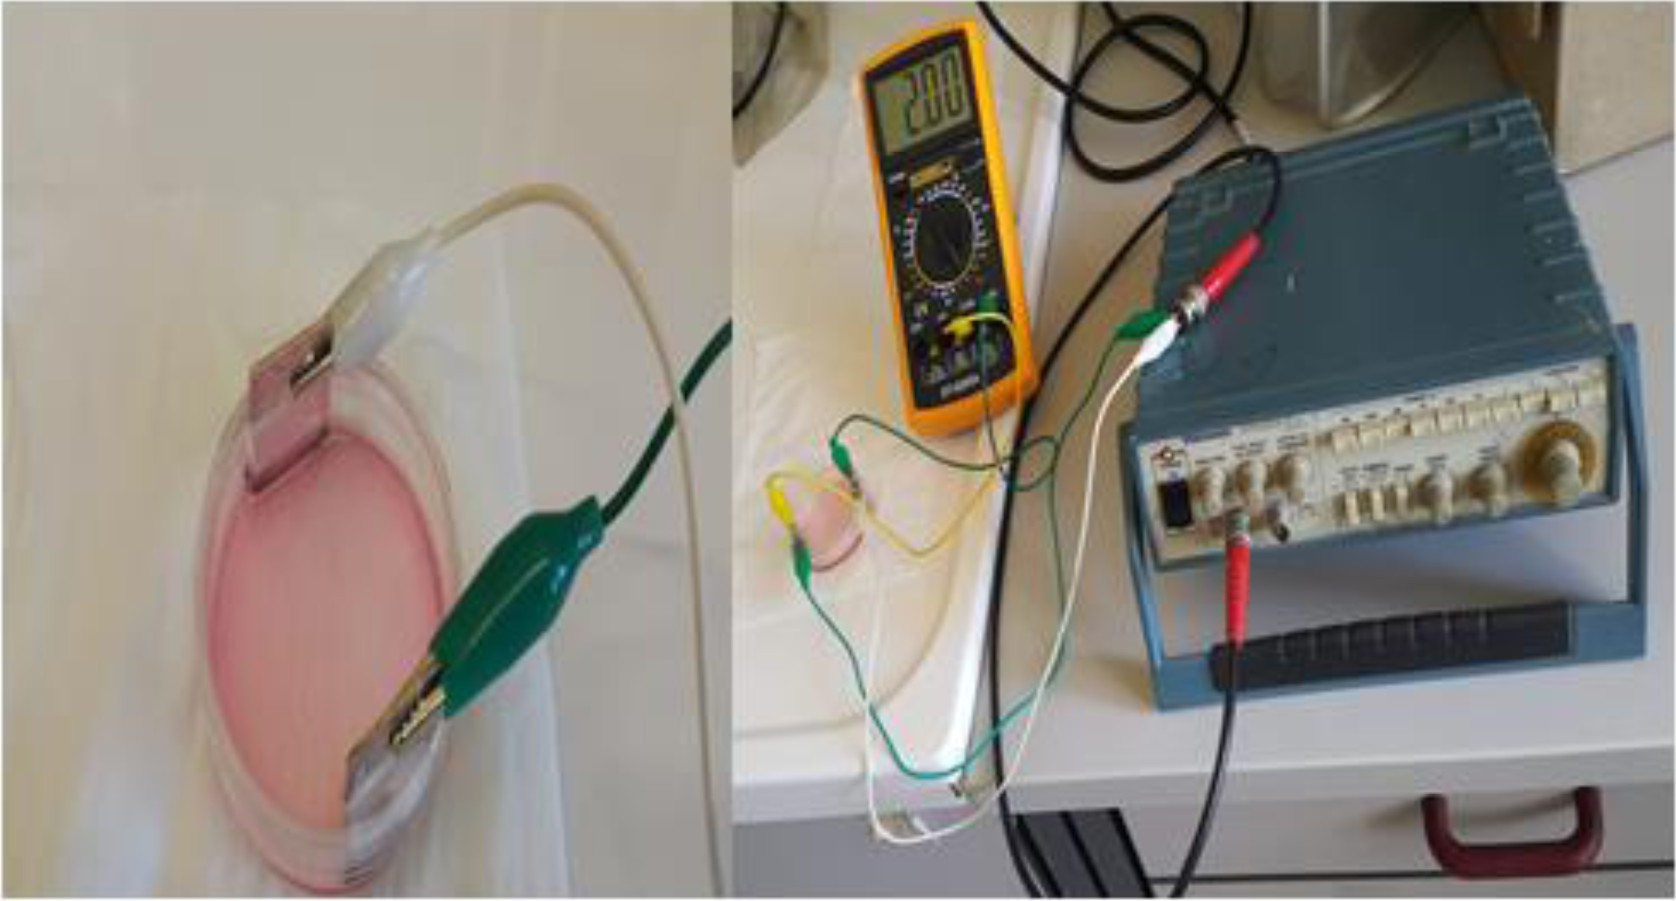
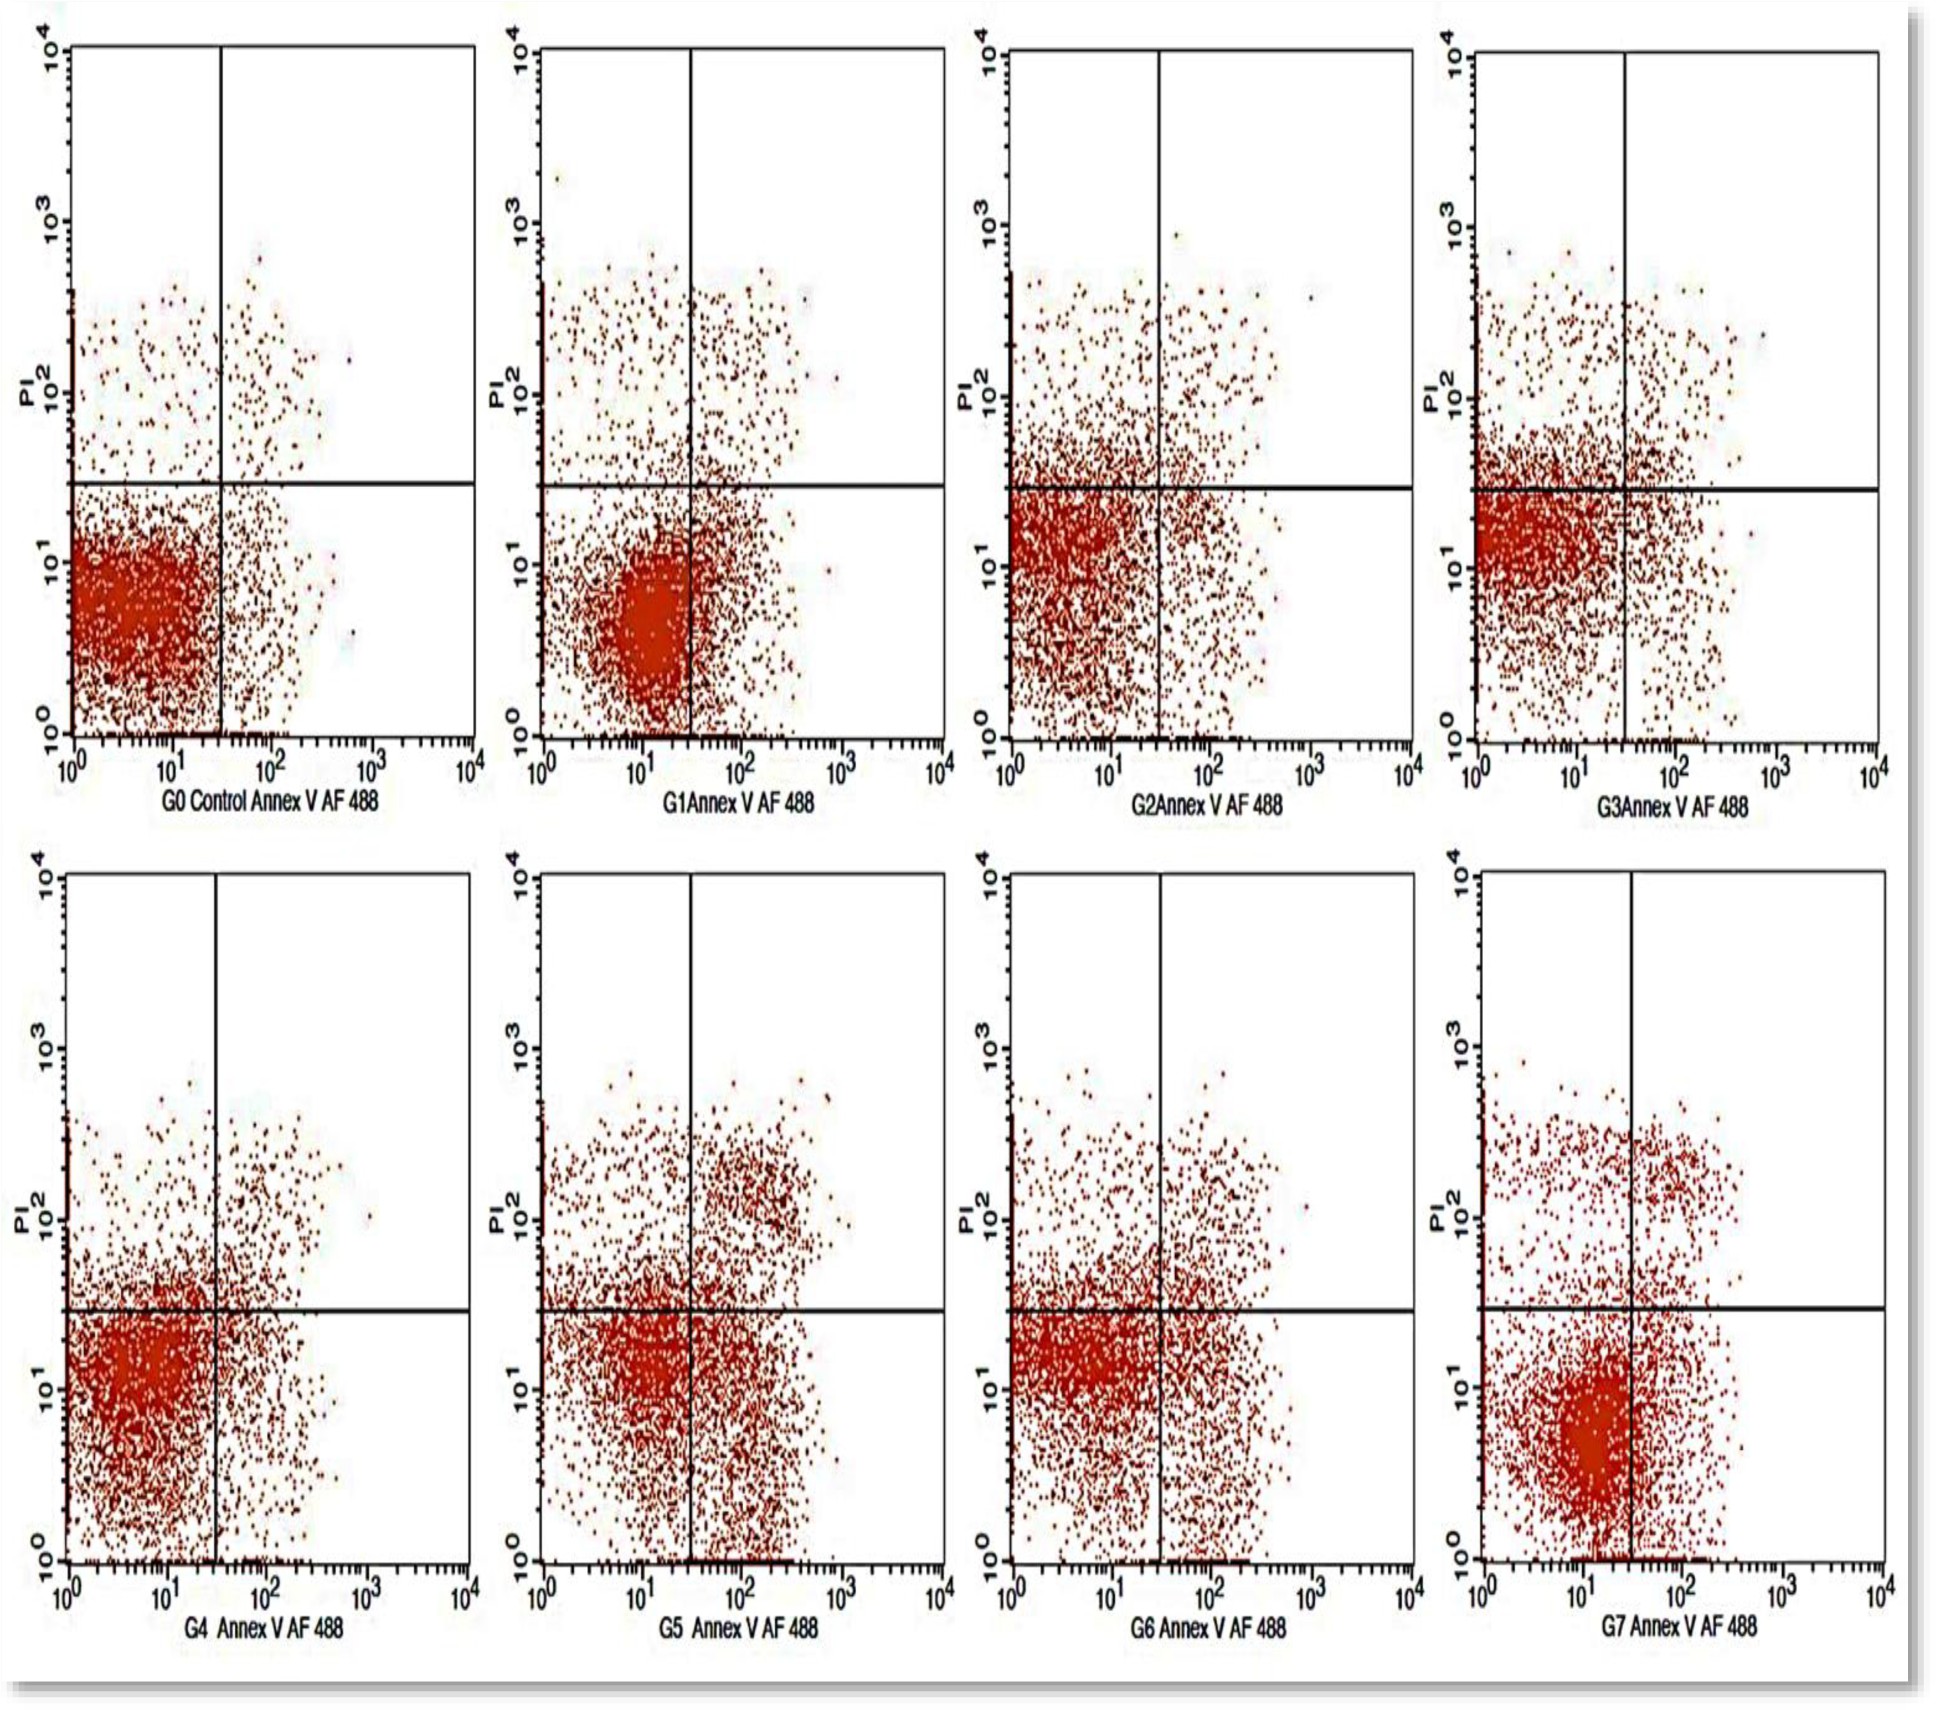
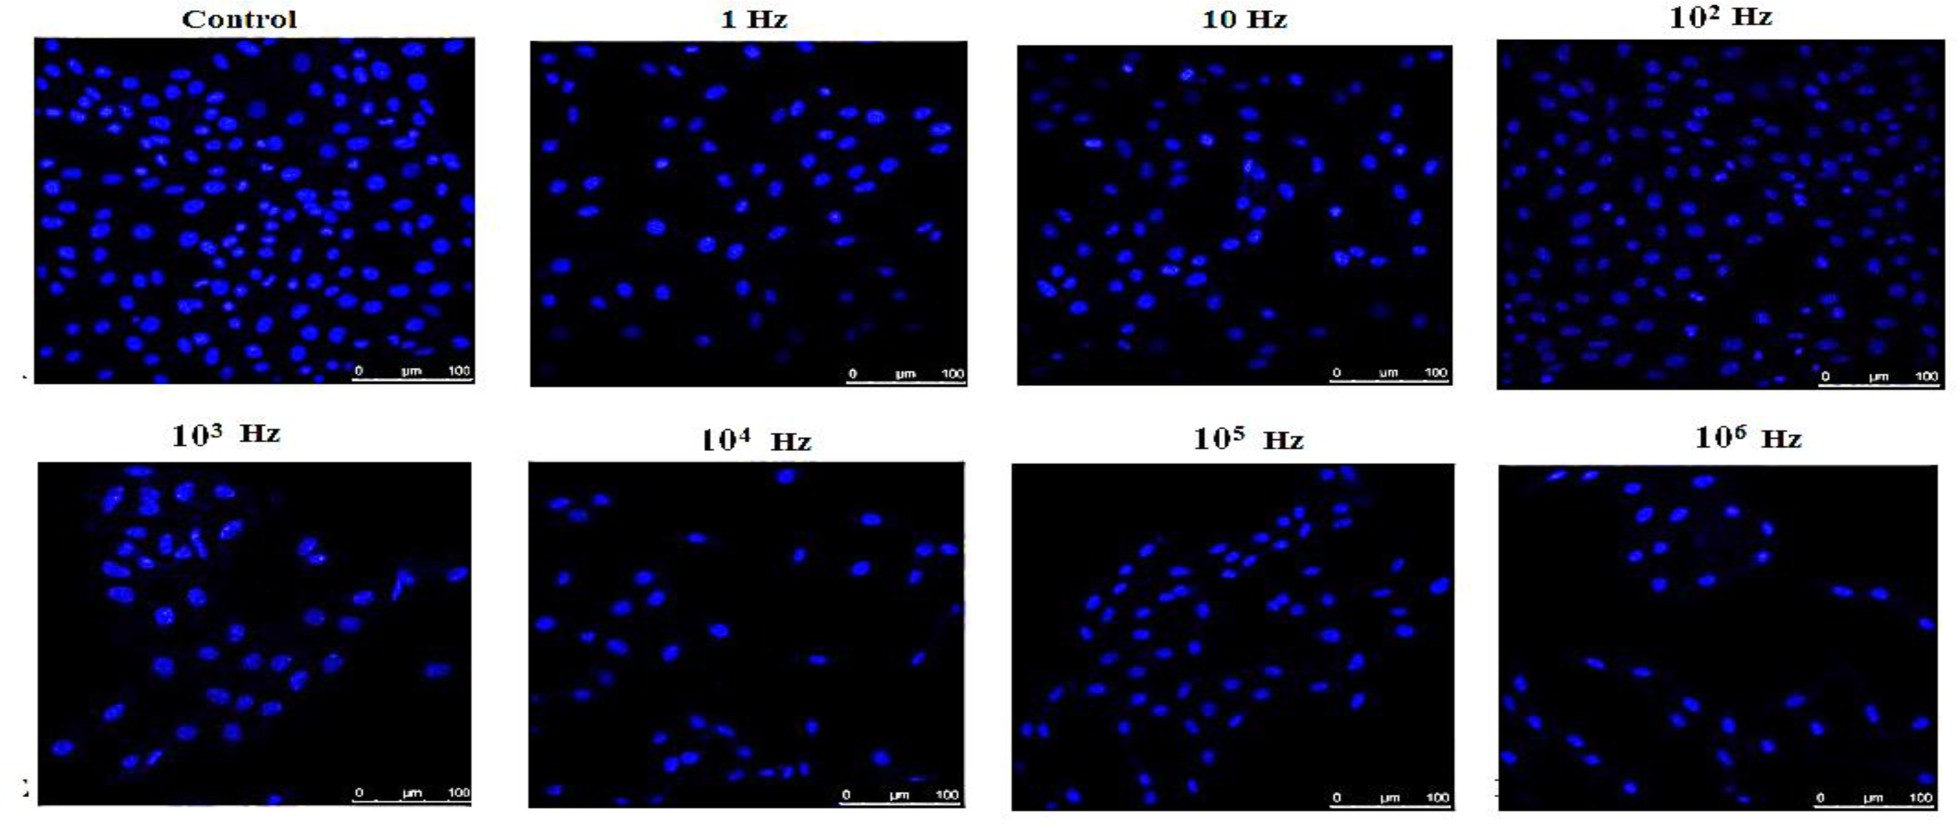
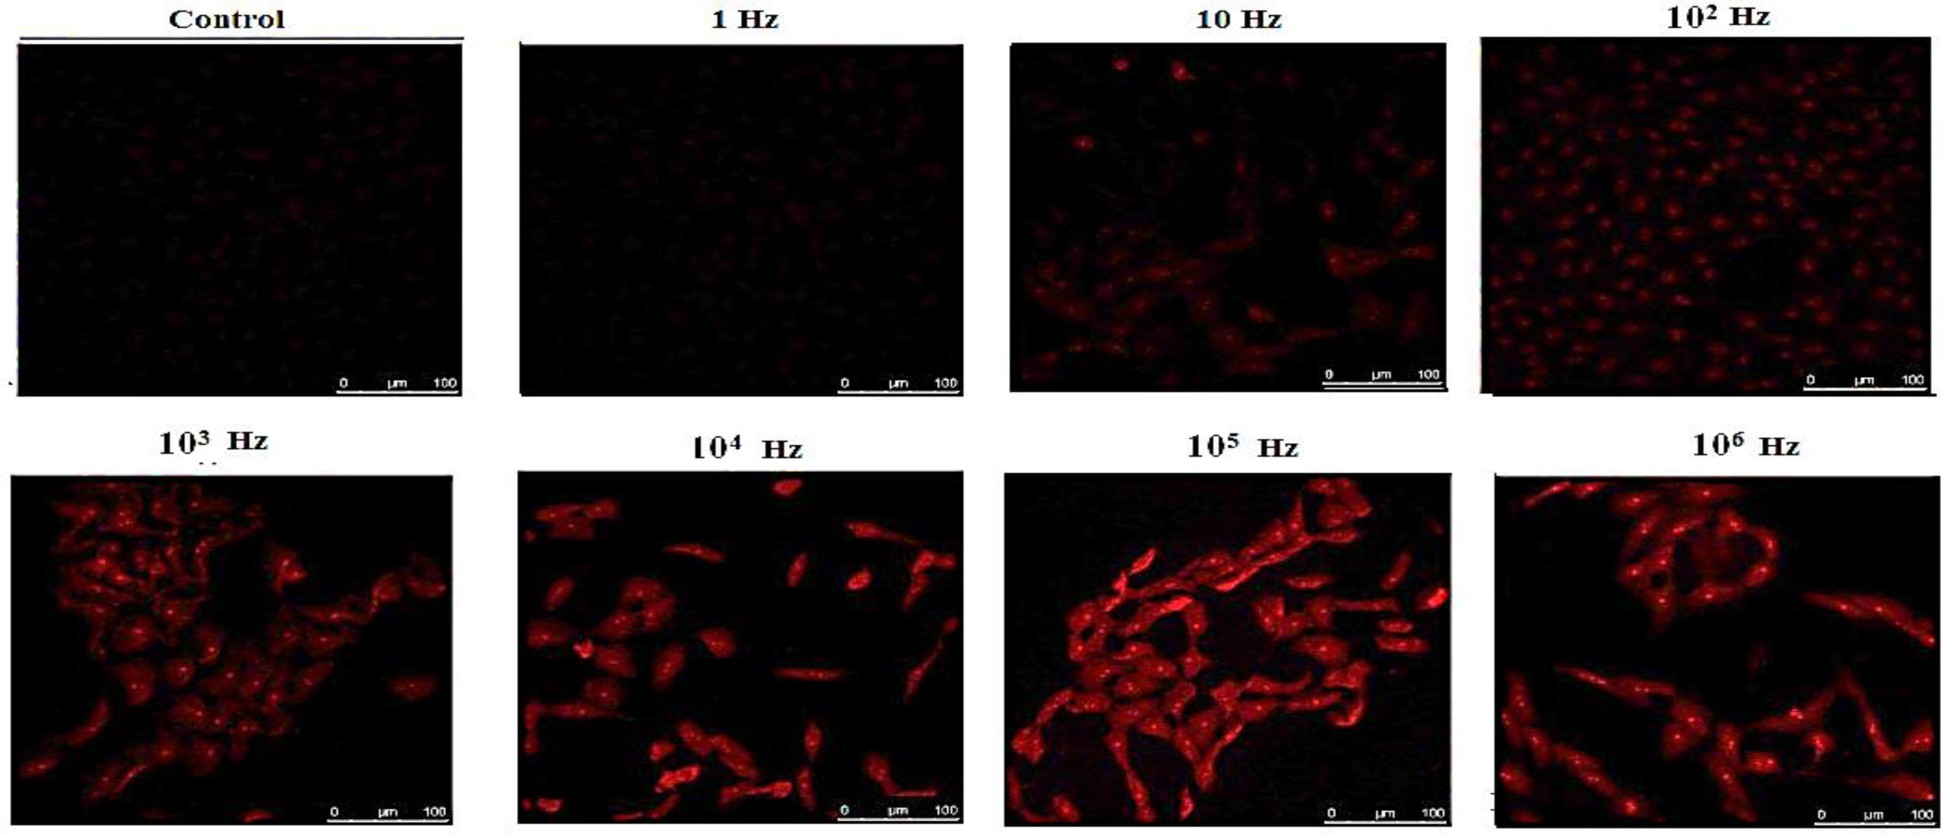
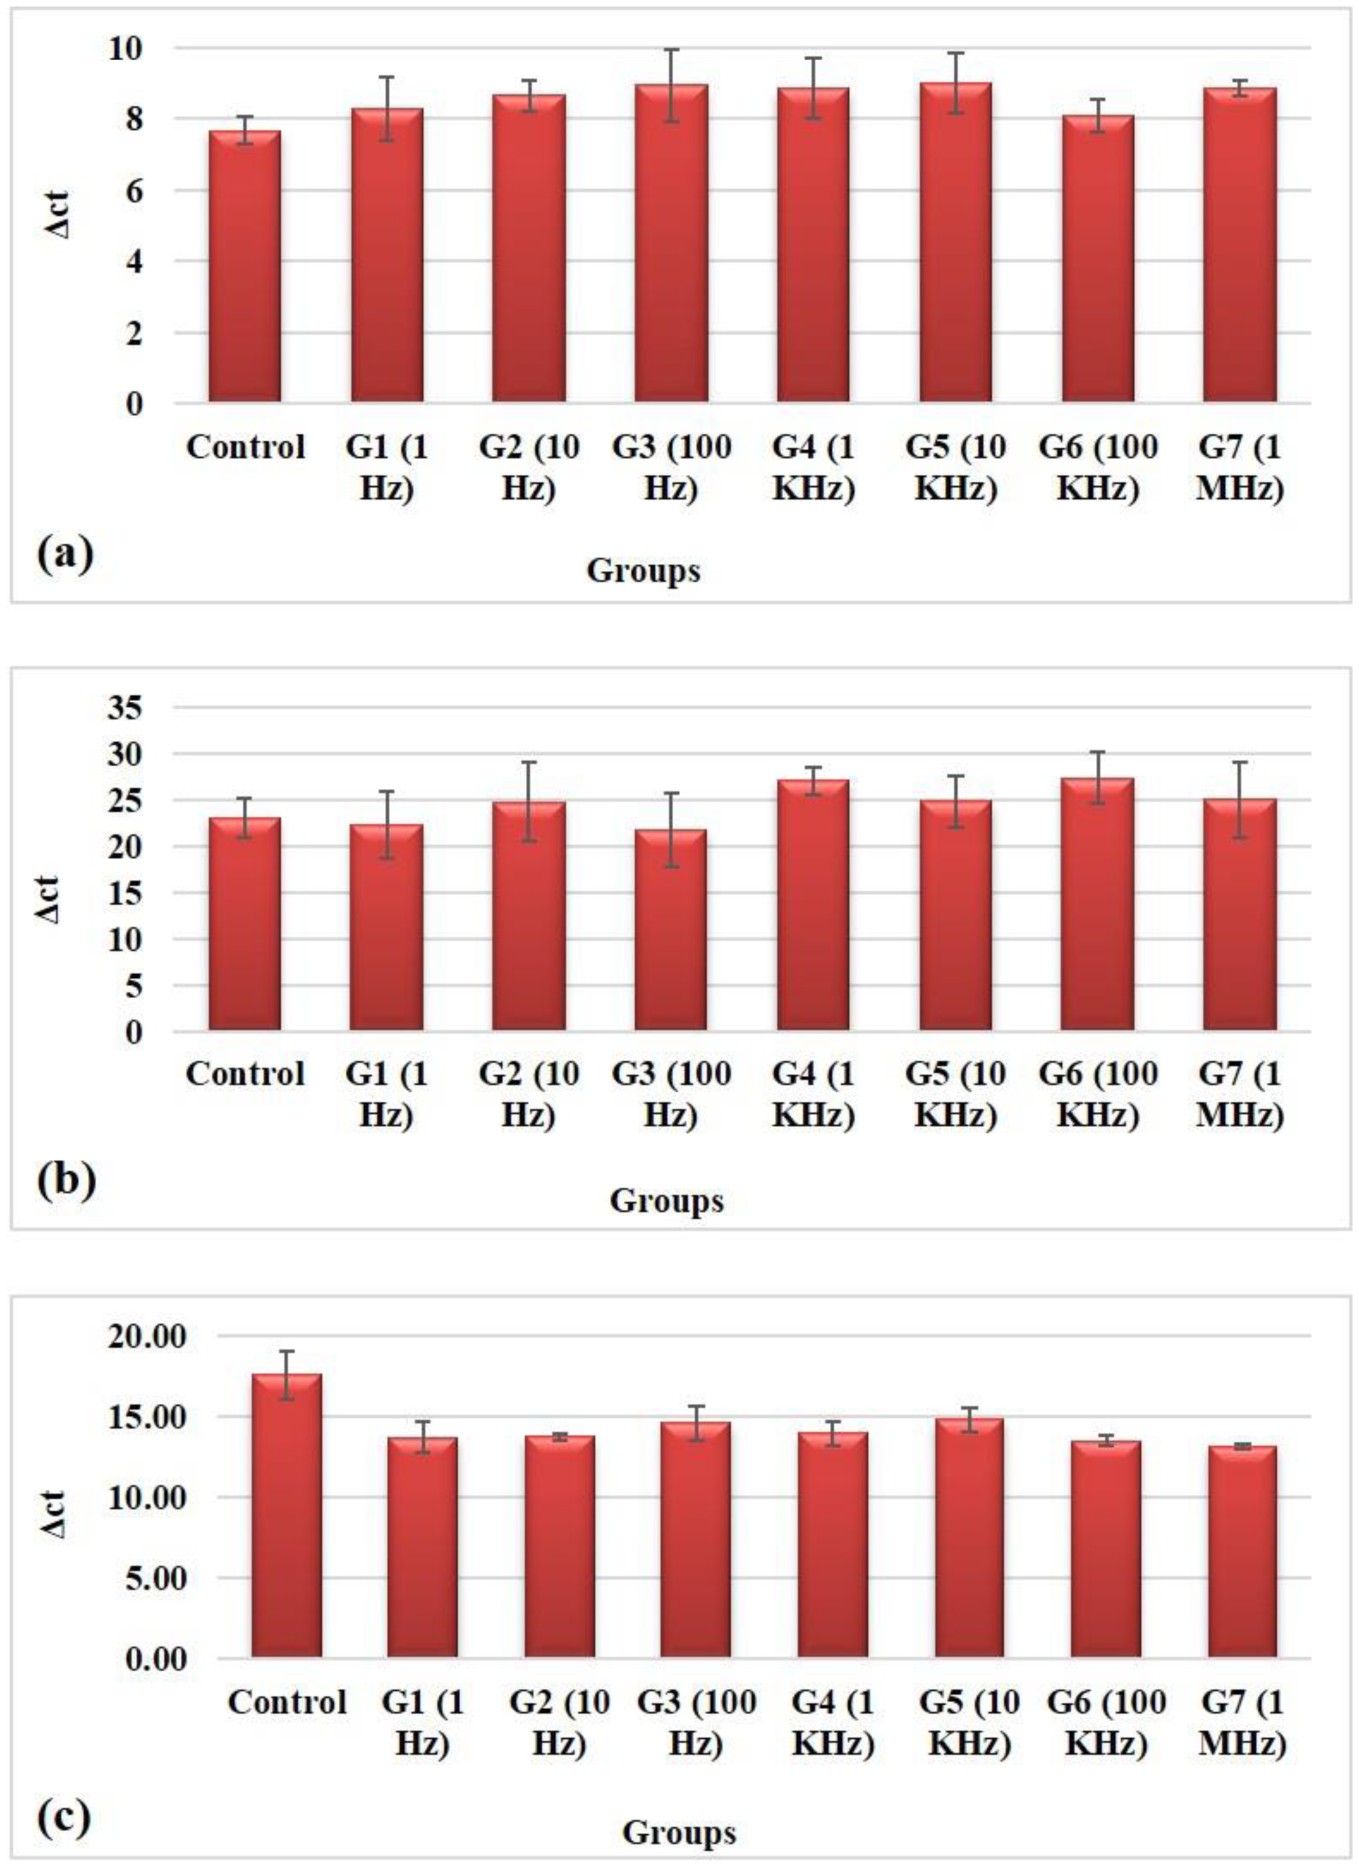
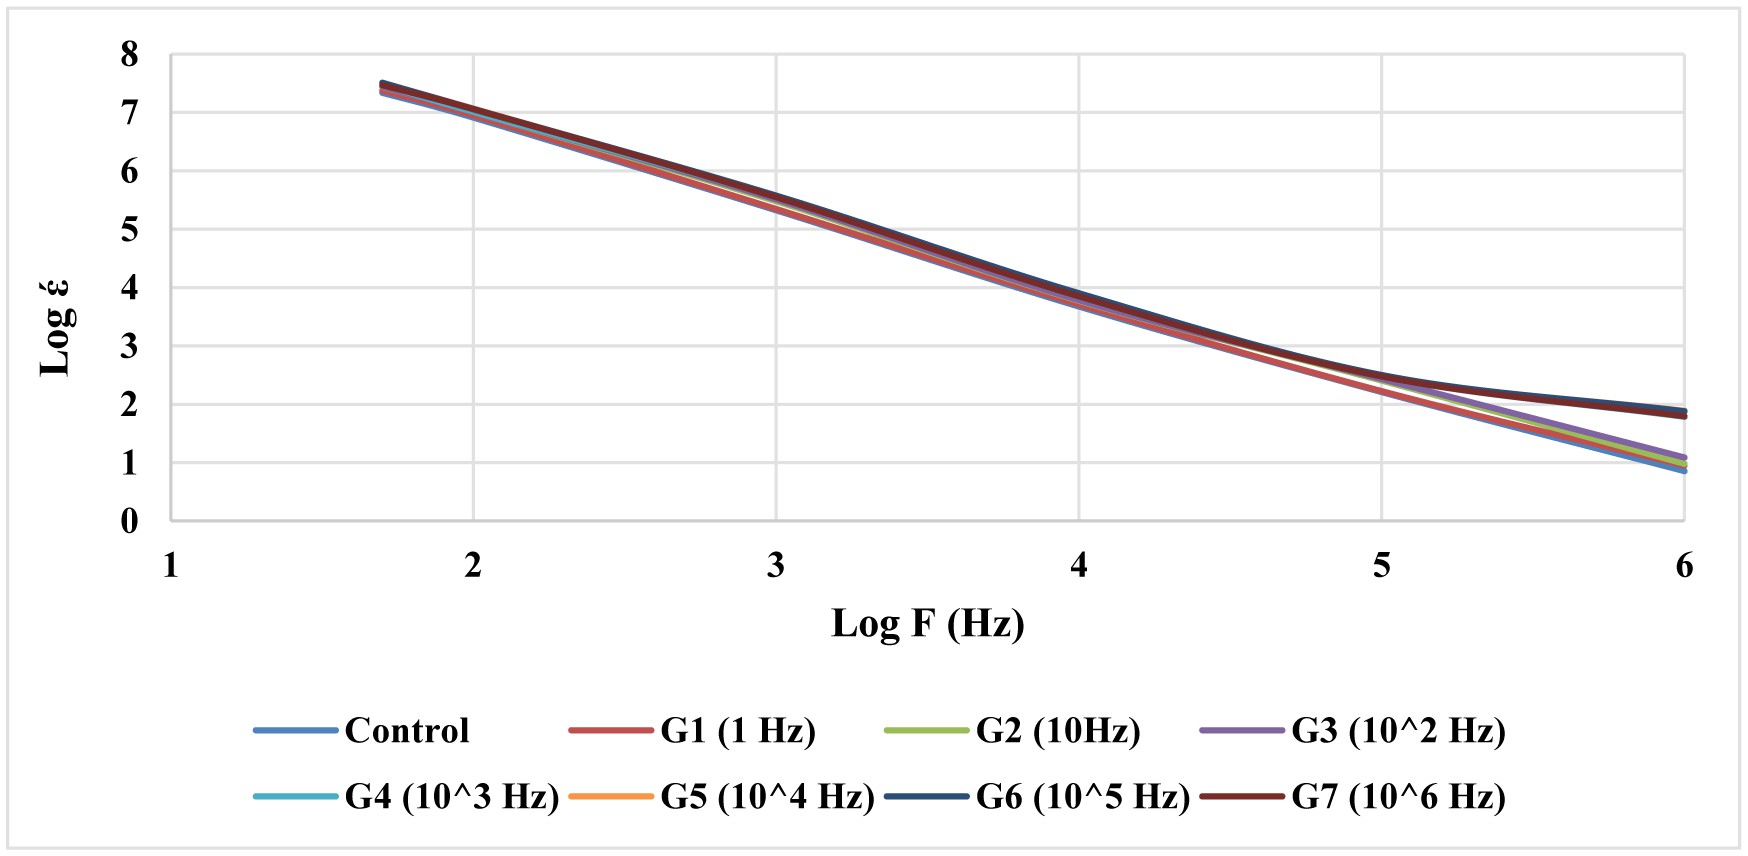
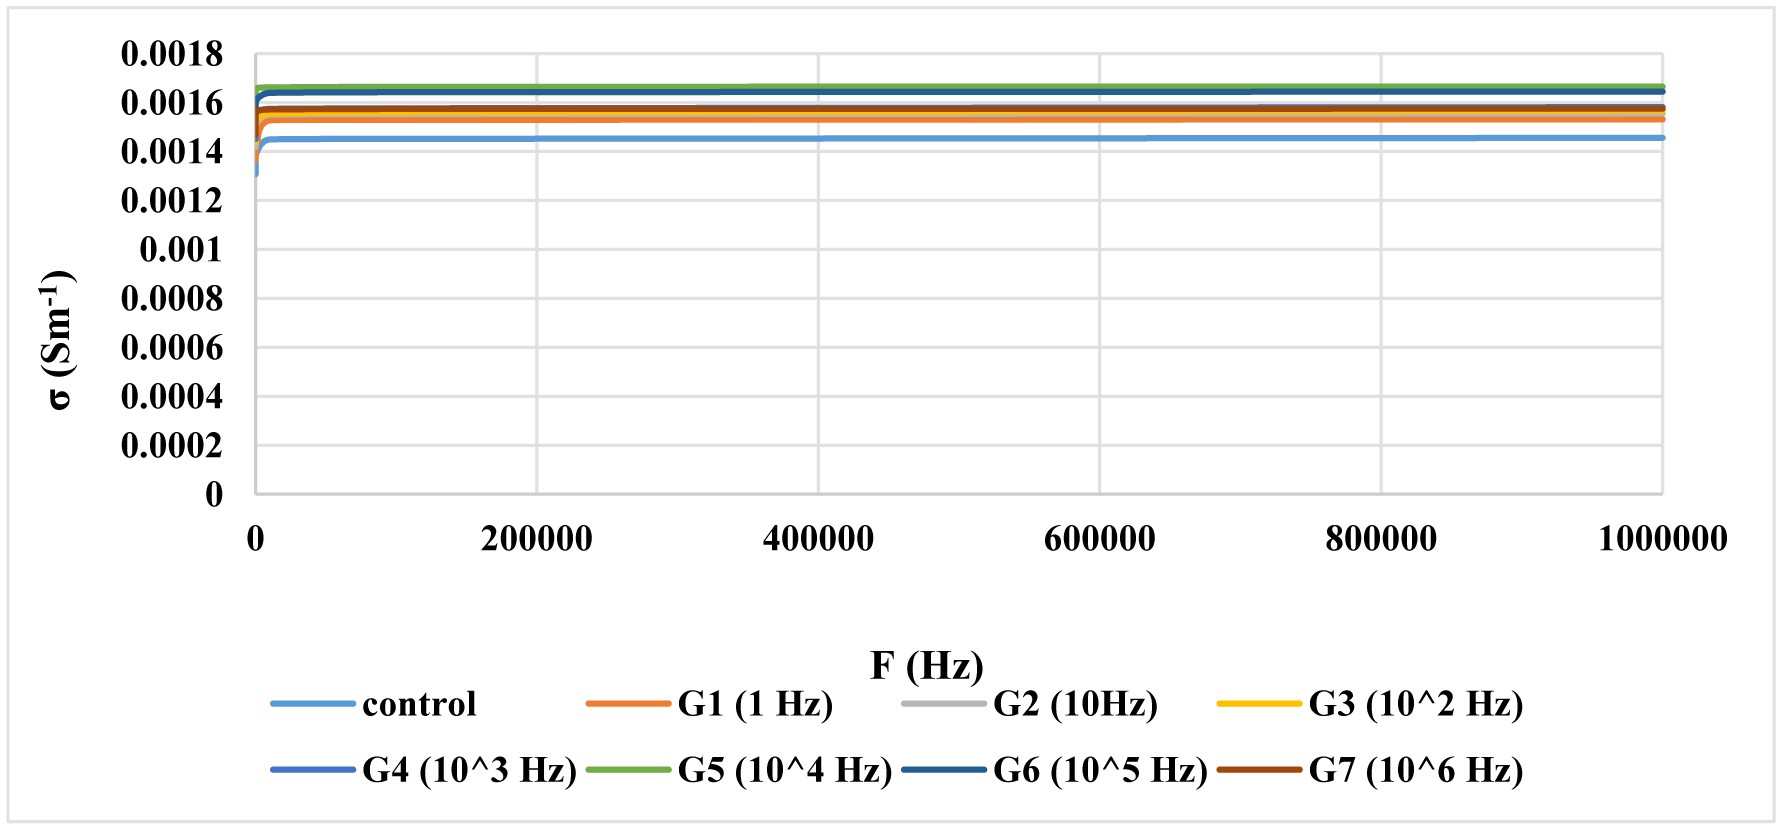
Different effects of alternating electric currents (AC) on biological materials have been observed depending on the frequency used. Extremely low frequencies (less than 1 KHz) produce electro-endocytosis at 500 Hz because of membrane depolarization. Intermediate frequencies coincide with tiny particle alignments and cell rotations (also known as the pearl chain effect), thus leading to the tumor-treating fields at 100–300 KHz. High frequencies (i.e., above several MHz) cause tissue heating to predominate due to the dielectric losses. This study investigates how exposure to a wide range of AC electric field frequencies affects the permeability and viability of hepatocellular carcinoma HEPG2 cells. With two silver/silver chloride electrodes, the cells were exposed to a square pulse with a magnitude of 0.4 V/cm at various frequencies between 1 Hz and 1 MHz. A dielectric properties measurement, flow cytometry analysis, fluorescent microscopy, and a polymerase chain reaction (PCR) gene expression analysis were performed. The results showed that all the exposed groups experienced a great reduction in the normal cells, with a clear increase in necrosis and apoptosis compared to the control group. It was noticed that the anti-tumoral effect of the examined frequency range was maximum at 10 KHz and 100 KHz. The permeability was increased in the groups exposed to frequencies above 1 kHz. The viability and permeability results were correlated to the electric relative permittivity, electric conductivity, and gene expression of cyclins A, B, and E.
Citation: Moataz M. Fahmy, Sohier M. El-Kholey, Seham Elabd, Mamdouh M. Shawki. Effect of changing the alternating electric current frequency on the viability of human liver cancer cell line (HEPG2)[J]. AIMS Biophysics, 2025, 12(1): 1-13. doi: 10.3934/biophy.2025001
Different effects of alternating electric currents (AC) on biological materials have been observed depending on the frequency used. Extremely low frequencies (less than 1 KHz) produce electro-endocytosis at 500 Hz because of membrane depolarization. Intermediate frequencies coincide with tiny particle alignments and cell rotations (also known as the pearl chain effect), thus leading to the tumor-treating fields at 100–300 KHz. High frequencies (i.e., above several MHz) cause tissue heating to predominate due to the dielectric losses. This study investigates how exposure to a wide range of AC electric field frequencies affects the permeability and viability of hepatocellular carcinoma HEPG2 cells. With two silver/silver chloride electrodes, the cells were exposed to a square pulse with a magnitude of 0.4 V/cm at various frequencies between 1 Hz and 1 MHz. A dielectric properties measurement, flow cytometry analysis, fluorescent microscopy, and a polymerase chain reaction (PCR) gene expression analysis were performed. The results showed that all the exposed groups experienced a great reduction in the normal cells, with a clear increase in necrosis and apoptosis compared to the control group. It was noticed that the anti-tumoral effect of the examined frequency range was maximum at 10 KHz and 100 KHz. The permeability was increased in the groups exposed to frequencies above 1 kHz. The viability and permeability results were correlated to the electric relative permittivity, electric conductivity, and gene expression of cyclins A, B, and E.

| [1] |
Llovet JM, Kelley RK, Villanueva A, et al. (2021) Hepatocellular carcinoma. Nat Rev Dis Primers 7: 6. https://doi.org/10.1038/s41572-020-00240-3 
|
| [2] |
Bray F, Ferlay J, Soerjomataram I, et al. (2018) Global cancer statistics 2018: GLOBOCAN estimates of incidence and mortality worldwide for 36 cancers in 185 countries. CA Cancer J Clin 68: 394-424. https://doi.org/10.3322/caac.21492
|
| [3] |
Marrero JA, Laura MK, Claude BS, et al. (2018) Diagnosis, staging, and management of hepatocellular carcinoma: 2018 practice guidance by the American Association for the Study of Liver Diseases. Hepatology 68: 723-750. https://doi.org/10.1002/hep.29913
|
| [4] |
Villemejane J, Mir LM (2009) Physical methods of nucleic acid transfer: general concepts and applications. Br J Pharmacol 157: 207-219. https://doi.org/10.1111/j.1476-5381.2009.00032.x
|
| [5] |
Kirson ED, Gurvich Z, Schneiderman R., et al. (2004) Disruption of cancer cell replication by alternating electric fields. Cancer Res 64: 3288-3295. https://doi.org/10.1158/0008-5472.CAN-04-0083
|
| [6] |
Zhang Y, Liang H, Tan H, et al. (2020) Development of microfluidic platform to high-throughput quantify single-cell intrinsic bioelectrical markers of tumor cell lines, subtypes and patient tumor cells. Sensor Actuat B-Chem 317: 128231. https://doi.org/10.1016/j.snb.2020.128231
|
| [7] |
Cone D (1971) Unified theory on the basic mechanism of normal mitotic control and oncogenesis. J Theor Biol 30: 151-181. https://doi.org/10.1016/0022-5193(71)90042-7
|
| [8] |
Al Ahmad M, Al Natour Z, Mustafa F, et al. (2018) Electrical characterization of normal and cancer cells. IEEE Access 6: 25979-25986. https://doi.org/10.1109/ACCESS.2018.2830883
|
| [9] |
Manatunga DC, De Silva RM, Nalin KM, et al. (2018) Effective delivery of hydrophobic drugs to breast (MCF-7) and Liver (HepG2) cancer cells: a detailed investigation using cytotoxicity assays, fluorescence imaging and flow cytometry. Eur J Pharm Biopharm 128: 18-26. https://doi.org/10.1016/j.ejpb.2018.04.001
|
| [10] |
Tummala V, Jaiswal J, Singh AK, et al. (2022) Biosynthesized silver nanoparticles having high redox current enhance anticancer response for HepG2 cells. Iran J Sci Technol Trans Sci 46: 1531-1539. https://doi.org/10.1007/s40995-022-01374-7
|
| [11] | Kadri K (2019) Polymerase chain reaction (PCR): principle and applications in: perspectives on polymerase chain reaction. Synthetic Biology, New Interdisciplinary Science . https://doi.org/10.5772/intechopen.86491 |
| [12] |
Bustin SA, Benes V, Nolan T, et al. (2005) Quantitative real-time RT-PCR—a perspective. J Mol Endocrinol 34: 597-601. https://doi.org/10.1677/jme.1.01755
|
| [13] |
Ambujakshi NP, Raveesha HR, Manohara SR, et al. (2019) Chonemorpha grandiflora extract mediated synthesis of Ag-ZnO nanoparticles for its anticancer, electrical and dielectric applications. Mater Res Express 6: 095068. https://doi.org/10.1088/2053-1591/ab3022
|
| [14] | Camué Ciria HM, González MM, Zamora Lo, et al. (2013) Antitumor effects of electrochemical treatment. Chin J Cancer Res 25: 223-234. https://10.3978/j.issn.1000-9604.2013.03.03 |
| [15] |
Morozas A, Malyško-Ptašinskė V, Kulbacka J, et al. (2024) Electrochemotherapy for head and neck cancers: possibilities and limitations. Front Oncol 14: 1353800. https://doi.org/10.3389/fonc.2024.1353800
|
| [16] |
Abd-Elghany AA (2022) Incorporation of electroendocytosis and nanosecond pulsed electric field in electrochemotherapy of breast cancer cells. Electromagn Biol Med 41: 25-34. https://doi.org/10.1080/15368378.2021.1978479
|
| [17] |
Prabhakar P, Avudaiappan AP, Sandman M, et al. (2024) Irreversible electroporation as a focal therapy for localized prostate cancer: a systematic review. Indian J Urol 40: 6-16. https://doi.org/10.4103/iju.iju_370_23
|
| [18] |
Mun EJ, Babiker HM, Weinberg U, et al. (2018) Tumor-treating fields: a fourth modality in cancer treatment. Clin Cancer Res 24: 266-275. https://doi.org/10.1158/1078-0432.CCR-17-1117
|
| [19] |
Giladi M, Weinberg U, Schneiderman RS, et al. (2014) Alternating electric fields (tumor-treating fields therapy) can improve chemotherapy treatment efficacy in non-small cell lung cancer both in vitro and in vivo. Semin Oncol 41: S35-S41. https://doi.org/10.1053/j.seminoncol.2014.09.006
|
| [20] |
Xiao D, Yao C, Liu H, et al. (2013) Irreversible electroporation and apoptosis in human liver cancer cells induced by nanosecond electric pulses. Bioelectromagnetics 34: 512-520. https://doi.org/10.1002/bem.21796
|
| [21] | Jing BW, Wen Q, Zhuo Y, et al. (2022) Optimization of three-dimensional culture conditions of HepG2 cells with response surface methodology based on the VitroGel system. Biomed Env Sci 35: 688-698. https://doi.org/10.3967/bes2022.091 |
| [22] |
El-Aouar RA, Nicolas A, De Paula TL, et al. (2017) Heterogeneous family of cyclomodulins: smart weapons that allow bacteria to hijack the eukaryotic cell cycle and promote infections. Front Cell Infect Microbiol 7: 208. https://doi.org/10.3389/fcimb.2017.00208
|
| [23] |
Xu J, Huang F, Yao Z, et al. (2019) Inhibition of cyclin E1 sensitizes hepatocellular carcinoma cells to regorafenib by mcl-1 suppression. Cell Commun Signal 17: 85. https://doi.org/10.1186/s12964-019-0398-3
|
| [24] |
Sonntag R, Penners C, Kohlhepp M, et al. (2021) Cyclin E1 in murine and human liver cancer: a promising target for therapeutic intervention during tumour progression. Cancers (Basel) 13: 5680. https://doi.org/10.3390/cancers13225680
|
Figures(7) / Tables(2)

Moataz M. Fahmy, Sohier M. El-Kholey, Seham Elabd, Mamdouh M. Shawki. Effect of changing the alternating electric current frequency on the viability of human liver cancer cell line (HEPG2)[J]. AIMS Biophysics, 2025, 12(1): 1-13. doi: 10.3934/biophy.2025001


 DownLoad: