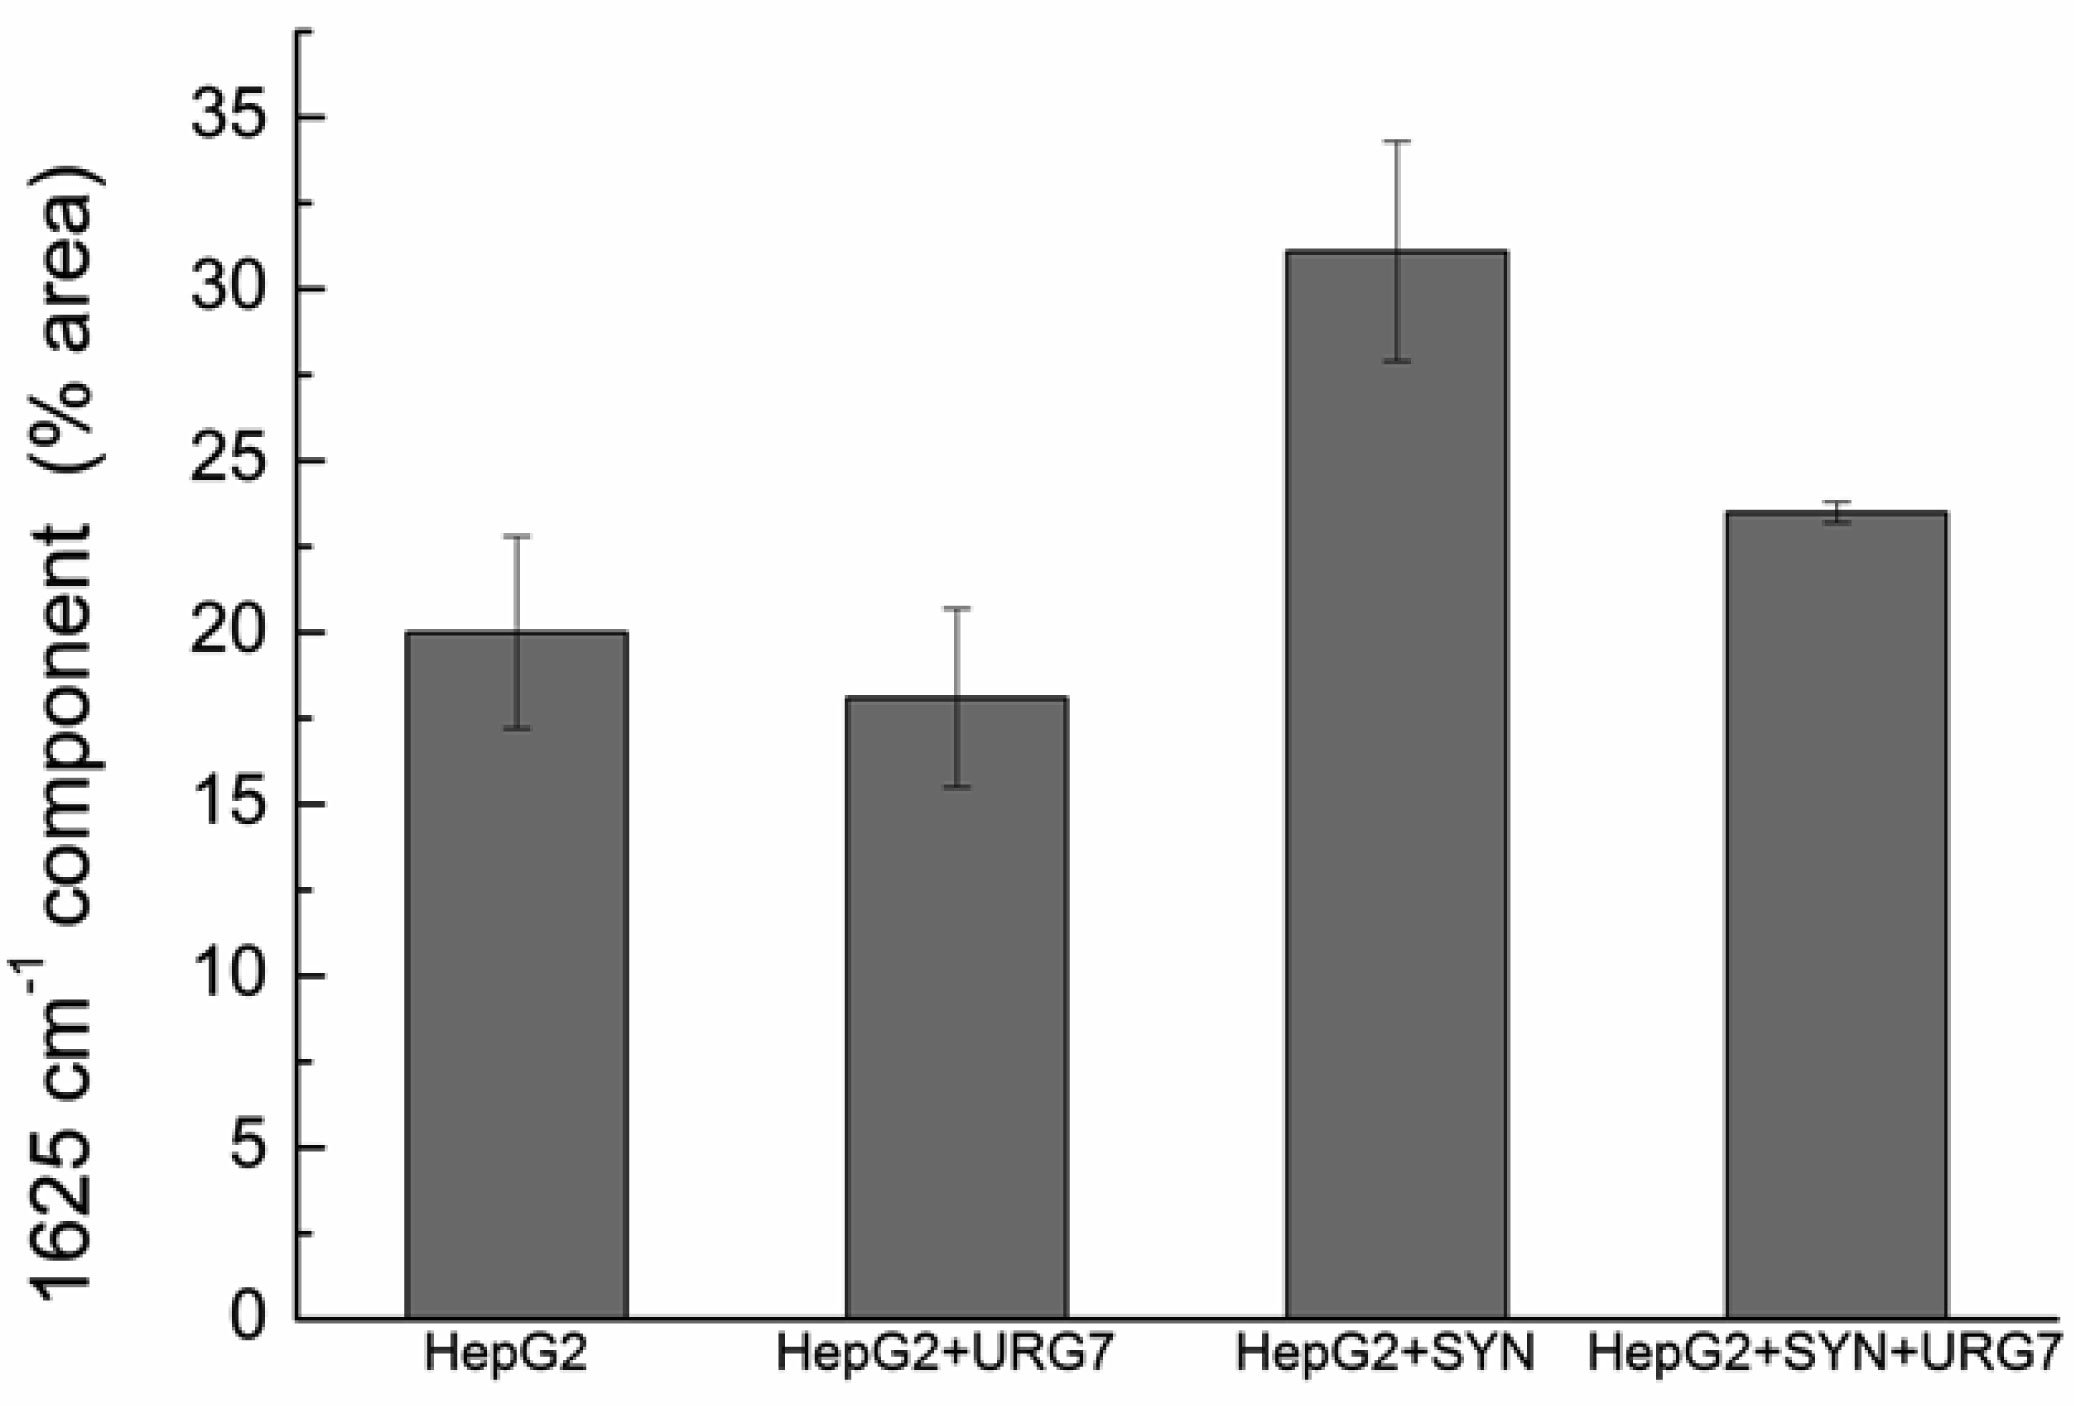
Differential scanning calorimetry and FITR analyses allowed to investigate the role of URG7 (up-regulated gene clone 7) protein involved in the development of hepatocellular carcinoma induced by hepatitis B virus infection, on the physical structure both of lysates of human hepatoblastoma cells (HepG2) stressed with tunicamycin and α-synuclein, one of the proteins associated with neurogenerative diseases. The protein-water interfacial region was identified and correlated with protein structure. DSC results confirm through the interfacial water behavior that URG7 is able to act in two ways: it maintains the interfacial water stability and controls the mobile fraction level, thereby the flexibility and the protein folding. The mobile water phase increases strongly for cells exposed to α-synuclein, demonstrating an important influence on water hydration. FTIR results evidenced an increase of about 30% of cross β structures in cells exposed to α-synuclein, associated with aggregated proteins. In stress conditions, URG7 was able to maintain the same fraction of mobile water as untreated cells. URG7 was able to restore the water reorientation ability around the complex lysate system and reduced abnormal protein folding.
Citation: Jany Dandurand, Angela Ostuni, Maria Francesca Armentano, Maria Antonietta Crudele, Vincenza Dolce, Federica Marra, Valérie Samouillan, Faustino Bisaccia. Calorimetry and FTIR reveal the ability of URG7 protein to modify the aggregation state of both cell lysate and amylogenic α-synuclein[J]. AIMS Biophysics, 2020, 7(3): 189-203. doi: 10.3934/biophy.2020015
Differential scanning calorimetry and FITR analyses allowed to investigate the role of URG7 (up-regulated gene clone 7) protein involved in the development of hepatocellular carcinoma induced by hepatitis B virus infection, on the physical structure both of lysates of human hepatoblastoma cells (HepG2) stressed with tunicamycin and α-synuclein, one of the proteins associated with neurogenerative diseases. The protein-water interfacial region was identified and correlated with protein structure. DSC results confirm through the interfacial water behavior that URG7 is able to act in two ways: it maintains the interfacial water stability and controls the mobile fraction level, thereby the flexibility and the protein folding. The mobile water phase increases strongly for cells exposed to α-synuclein, demonstrating an important influence on water hydration. FTIR results evidenced an increase of about 30% of cross β structures in cells exposed to α-synuclein, associated with aggregated proteins. In stress conditions, URG7 was able to maintain the same fraction of mobile water as untreated cells. URG7 was able to restore the water reorientation ability around the complex lysate system and reduced abnormal protein folding.

| [1] |
Lian Z, Liu J, Pan J, et al. (2001) A cellular gene up-regulated by hepatitis B virus-encoded X antigen promotes hepatocellular growth and survival. Hepatology 34: 146-157. doi: 10.1053/jhep.2001.25545

|
| [2] |
Ostuni A, Lara P, Armentano MF, et al. (2013) The hepatitis B x antigen anti-apoptotic effector URG7 is localized to the endoplasmic reticulum membrane. FEBS Lett 587: 3058-3062. doi: 10.1016/j.febslet.2013.07.042
|
| [3] |
Lee H, Lara P, Ostuni A, et al. (2014) Live-cell topology assessment of URG7, MRP6102 and SP-C using glycosylatable green fluorescent protein in mammalian cells. Biochem Biophys Res Commun 450: 1587-1592. doi: 10.1016/j.bbrc.2014.07.046
|
| [4] |
Ostuni A, Antonietta Castiglione Morelli M, Miglionico R, et al. (2014) Expression, purification and structural characterization of Up-regulated gene 7 encoded protein. Protein Peptide Lett 21: 413-418. doi: 10.2174/092986652105140218105249
|
| [5] |
Hayer J, Jadeau F, Deléage G, et al. (2013) HBVdb: a knowledge database for hepatitis B virus. Nucleic Acids Res 41: 566-570. doi: 10.1093/nar/gks1022
|
| [6] |
Pan J, Lian Z, Wallett S, et al. (2007) The hepatitis B x antigen effector, URG7, blocks tumour necrosis factor alpha-mediated apoptosis by activation of phosphoinositol 3-kinase and beta-catenin. J Gen Virol 88: 3275-3285. doi: 10.1099/vir.0.83214-0
|
| [7] |
Li B, Gao B, Ye L, et al. (2007) Hepatitis B virus X protein (HBx) activates ATF6 and IRE1-XBP1pathways of unfolded protein response. Virus Res 124: 44-49. doi: 10.1016/j.virusres.2006.09.011
|
| [8] |
Armentano MF, Caterino M, Miglionico R, et al. (2018) New insights on the functional role of URG7 in the cellular response to ER stress. Biol Cell 110: 147-158. doi: 10.1111/boc.201800004
|
| [9] | Ostuni A, Bisaccia F (2019) Method for diagnosing the risk of preneoplastic and neoplastic liver disease in subjects affected by hepatitis. European Patent EP3161488A1 . |
| [10] |
Cremades N, Chen SW, Dobson CM (2017) Structural characteristics of alpha-synuclein oligomers. Int Rev Cell Mol Biol 329: 79-143. doi: 10.1016/bs.ircmb.2016.08.010
|
| [11] |
Kim HY, Heise H, Fernandez CO, et al. (2007) Correlation of amyloid fibril Beta-structure with the unfolded state of alpha-synuclein. Chembiochem 8: 1671-1674. doi: 10.1002/cbic.200700366
|
| [12] |
Uversky VN, Elieser D (2009) Biophysics of Parkinson's desease: Structure and aggregation of alpha-synuclein. Curr Protein Peptide Sci 10: 483-499. doi: 10.2174/138920309789351921
|
| [13] |
Johnson CM (2013) Differential scanning calorimetry as a tool for protein folding and stability. Arch Biochem Biophys 531: 100-109. doi: 10.1016/j.abb.2012.09.008
|
| [14] |
Briere LA, Brandt JM, Medley J (2010) Measurement of protein denaturation in human synovial fluid and its analogs using differential scanning calorimetry. J Therm Anal Calorim 102: 99-106. doi: 10.1007/s10973-010-0794-9
|
| [15] |
Lunetti P, Cappello AR, Marsano RM, et al. (2013) Mitochondrial glutamate carriers from Drosophila melanogaster: biochemical, evolutionary and modeling studies. BBA-Bioenergetics 1827: 1245-1255. doi: 10.1016/j.bbabio.2013.07.002
|
| [16] |
Kamasa P, Bokor M, Pyda M, et al. (2007) DSC approach for the investigation of mobile water fractions in aqueous solutions of NaCl and Tris buffer. Thermochimica Acta 464: 29-34. doi: 10.1016/j.tca.2007.08.001
|
| [17] |
Ostuni A, Miglionico R, Castiglione Morelli MA, et al. (2010) Study of the nucleotide-binding domain 1 of the human transporter protein MRP6. Protein Peptide Lett 17: 1553-1558. doi: 10.2174/0929866511009011553
|
| [18] |
Salvia AM, Cuviello F, Coluzzi S, et al. (2017) Expression of some ATP-binding cassette transporters in acute myeloid leukemia. Hematol Rep 9: 137-141. doi: 10.4081/hr.2017.7406
|
| [19] |
Miglionico R, Ostuni A, Armentano MF, et al. (2017) ABCC6 knockdown in HepG2 cells induces a senescent-like cell phenotype. Cell Mol Biol Lett 22: 7. doi: 10.1186/s11658-017-0036-2
|
| [20] |
Martinelli F, Cuviello F, Pace MC, et al. (2018) Extracellular ATP regulates CD73 and ABCC6 expression in HepG2 cells. Front Mol Biosci 5: 75. doi: 10.3389/fmolb.2018.00075
|
| [21] |
Tompa K, Bánki P, Bokor M, et al. (2009) Interfacial water at protein surfaces: Wide-line NMR and DSC characterization of hydration in ubiquitin solutions. Biophys J 96: 2789-2798. doi: 10.1016/j.bpj.2008.11.038
|
| [22] |
Dandurand J, Samouillan V, Lacabanne C, et al. (2015) Water structure and elastin-like peptide aggregation. J Therm Anal Calorim 120: 416-426. doi: 10.1007/s10973-014-4254-9
|
| [23] |
Mehra S, Sahay S, Maji SK (2019) Alpha synuclein misfolding and aggregation: Implications in Parkinson's disease pathogenesis. BBA-Proteins Proteonomics 1867: 890-908. doi: 10.1016/j.bbapap.2019.03.001
|
| [24] |
Staniszewska E, Malek K, Baranska M (2014) Rapid approach to analyze biochemical variation in rat organs by ATR FTIR spectroscopy. Spectrochim Acta-Part A Mol Biomol Spectrosc 118: 981-986. doi: 10.1016/j.saa.2013.09.131
|
| [25] | Ami D, Neri T, Natalello A, et al. (2008) Embryonic stem cell differentiation studied by FT-IR spectroscopy. BBA-Mol Cell Res 1783: 98-106. |
| [26] |
Wood BR (2016) The importance of hydration and DNA conformation in interpreting infrared spectra of cells and tissues. Chem Soc Rev 45: 1980-1998. doi: 10.1039/C5CS00511F
|
| [27] |
Bochicchio B, Pepe A, Crudele M, et al. (2015) Tuning self-assembly in elastin-derived peptides. Soft Matter 11: 3385-3395. doi: 10.1039/C5SM00072F
|
| [28] |
Litvinov RI, Faizullin DA, Zuev YF, et al. (2012) The a-helix to b-sheet transition in stretched and compressed hydrated fibrin clots. Biophys J 103: 1020-1027. doi: 10.1016/j.bpj.2012.07.046
|
| [29] |
Barth A (2007) Infrared spectroscopy of proteins. BBA-Bioenergetics 1767: 1073-1101. doi: 10.1016/j.bbabio.2007.06.004
|
| [30] |
Dobson CM (2003) Protein folding and misfolding. Nature 426: 884-890. doi: 10.1038/nature02261
|
| [31] |
De Planque MRR, Killian JA (2003) Protein–lipid interactions studied with designed transmembrane peptides: role of hydrophobic matching and interfacial anchoring. Mol Membr Biol 20: 271-284. doi: 10.1080/09687680310001605352
|
| [32] |
Kim HY, Cho MK, Riedel D, et al. (2008) Dissociation of amyloid fibrils of α-synuclein in supercooled water. Angew Chem Int Edit 120: 5124-5126. doi: 10.1002/ange.200800342
|
| [33] |
Kim HY, Cho MK, Kumar A, et al. (2009) Structural properties of pore-forming oligomers of α-Synuclein. J Am Chem Soc 131: 17482-17489. doi: 10.1021/ja9077599
|
| [34] |
Fusco G, De Simone A, Gopinath T, et al. (2014) Direct observation of the three regions in α-synuclein that determine its membrane-bound behaviour. Nat Commun 5: 3827. doi: 10.1038/ncomms4827
|
| [35] |
Carija A, Pinheiro F, Pujols J, et al. (2019) Biasing the native α-synuclein conformational ensemble towards compact states abolishes aggregation and neurotoxicity. Redox Biol 22: 101135. doi: 10.1016/j.redox.2019.101135
|
 biophy-07-03-015-s001.pdf biophy-07-03-015-s001.pdf |
 |
Figures(8) / Tables(2)

Jany Dandurand, Angela Ostuni, Maria Francesca Armentano, Maria Antonietta Crudele, Vincenza Dolce, Federica Marra, Valérie Samouillan, Faustino Bisaccia. Calorimetry and FTIR reveal the ability of URG7 protein to modify the aggregation state of both cell lysate and amylogenic α-synuclein[J]. AIMS Biophysics, 2020, 7(3): 189-203. doi: 10.3934/biophy.2020015


 DownLoad: