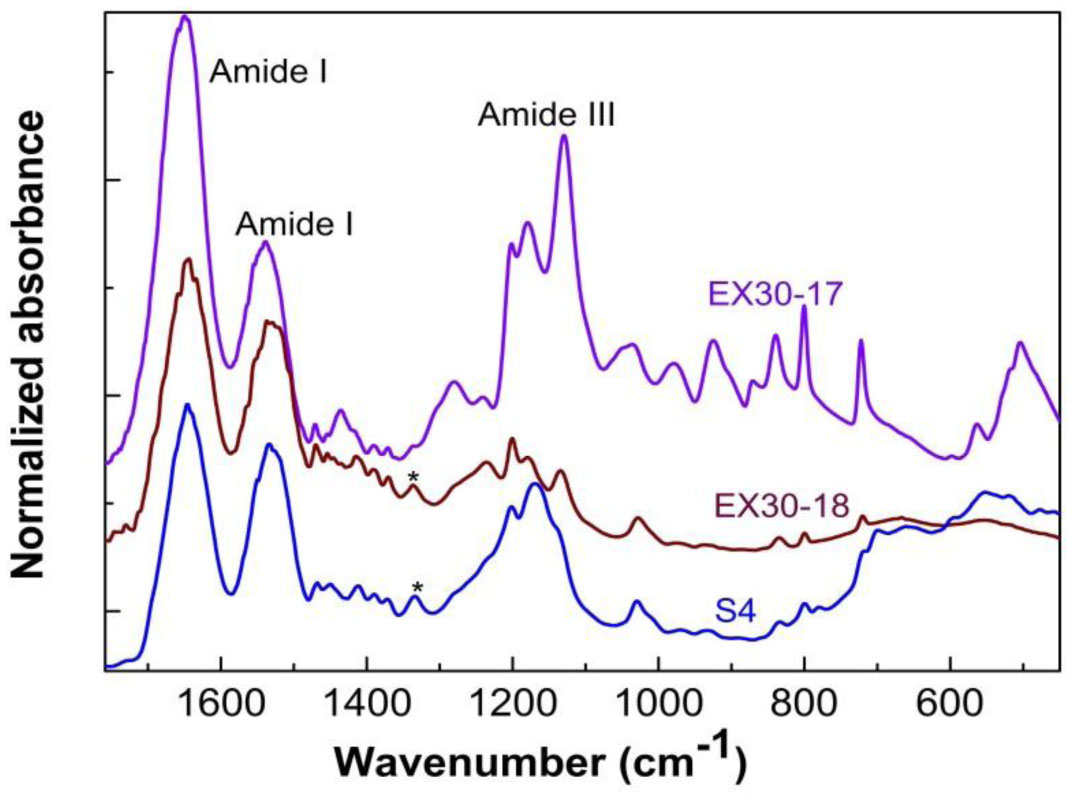
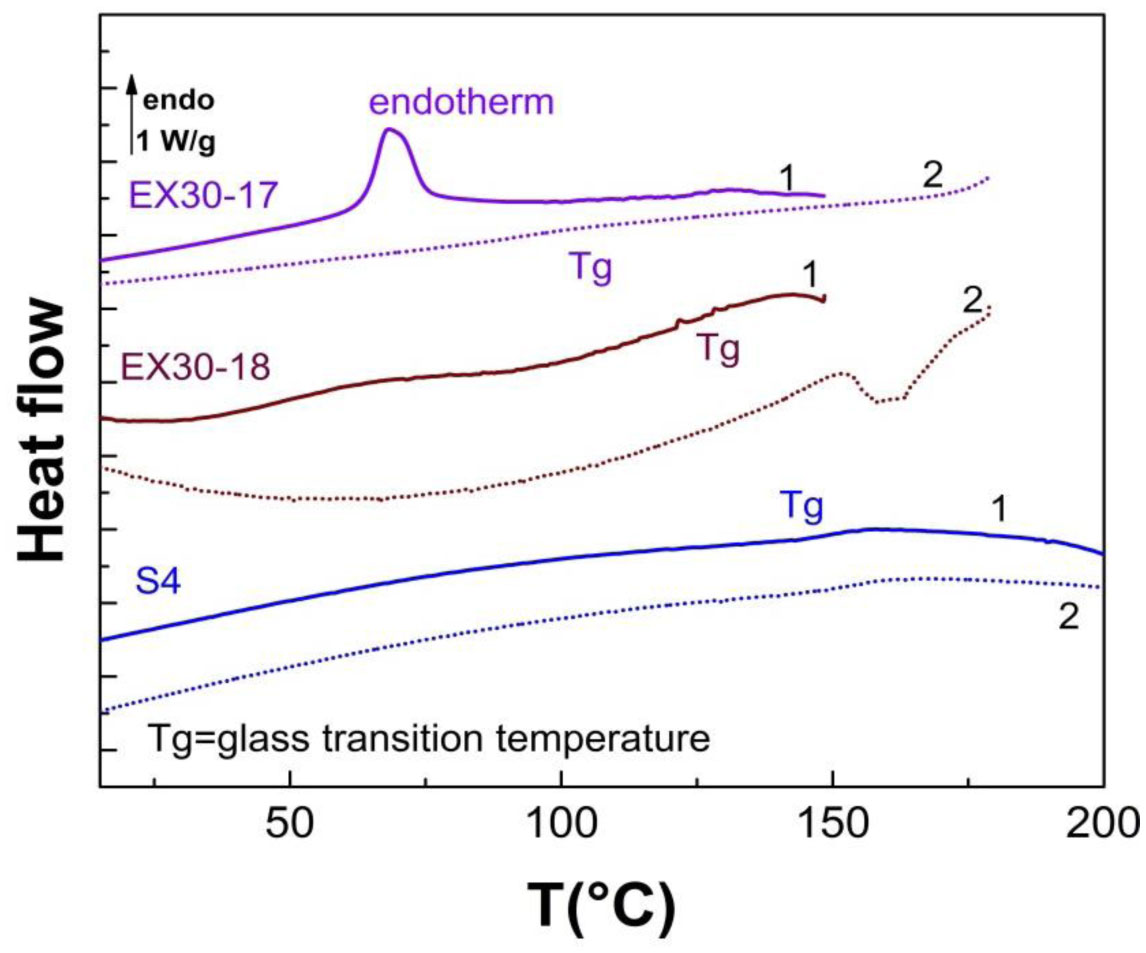
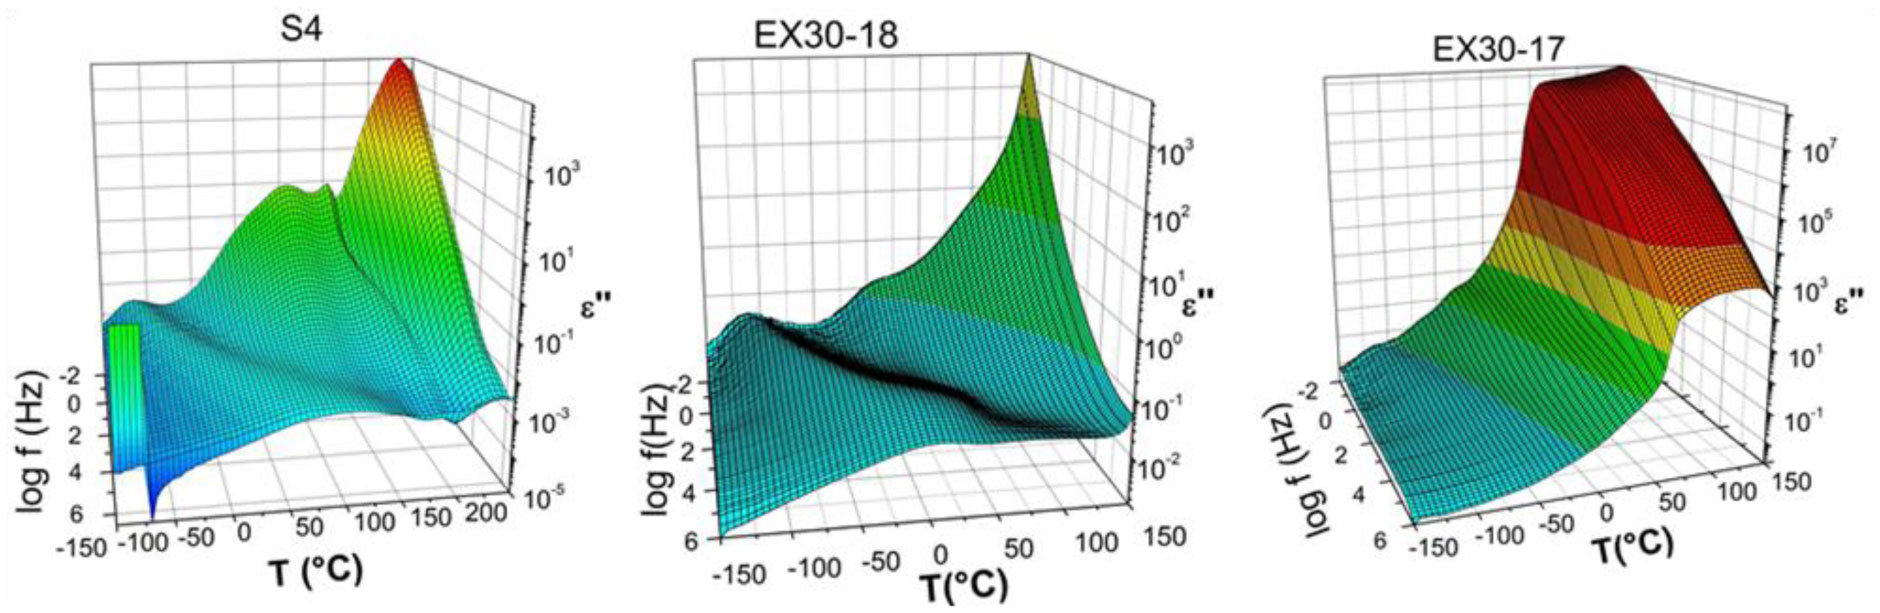
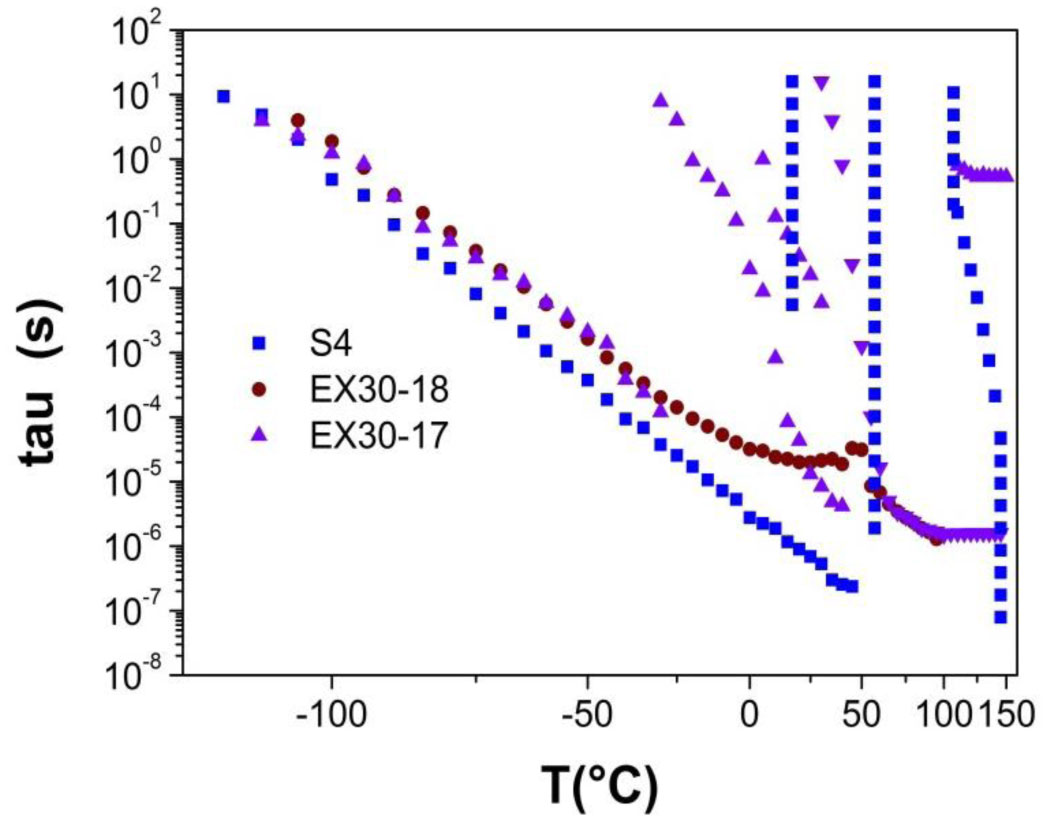
1.
Introduction
One of the usual properties of tropoelastin is its ability to coacervate, what constitutes the first step of fibrillogenesis of mature elastin. Coacervation is a reversible self-assembling [1] which promotes the formation of folded conformations including peculiarly β turn conformations [2]. This property depends on several parameters, such as the amino acid sequence, temperature, protein concentration, ionic strength and pH [3]. Using the reductionist approach, a significant number of peptides encoded by exons from human tropoelastin gene have been studied in literature [3]. Tamburro et al. evidenced that polypeptide sequences coded by single exons of the human elastin gene adopt autonomous folding and specific biological activities [4]–[7].
Some polypeptides encoded by Exon 30 (EX30) located in the C-terminal region of the human tropoelastin gene exhibit an ultrastructural organization different from typical fibrils of elastin, and give rise to amyloid fibers [8]–[11]. These fibers are frequently associated with neuro-degenerative diseases [12], Alzheimer's disease and diabetes [13]. The formation of amyloid fibrils, induced by changes in environment, is an irreversible process that leads to antiparallel alignment of cross β structures.
Furthermore, when the sequence encoded by EX30 is inserted in a longer peptide, the associated peptide does not form amyloid fibrils [8].
The three chemically synthesized peptides studied in this work named S4, EX30-17 and EX30-18 are subsets of the whole polypeptide coded by EX30. From a physiological perspective, S4 peptide corresponds to the human skin elastin digest by metalloprotease MMP-12 or pepsin [14]. While EX30-18 is able to coacervate [15], S4 and EX30-17 give rise to aggregation into amyloid fibers. These particular sequences have already been studied by circular dichroism (CD), NMR [11], turbidimetry, transmission Microscopy, AFM, [10], [3], evidencing relationship between the structure, the sequence and length. Previous studies evidenced the relevance and usefulness of vibrational and thermal analyses to investigate protein folding [16],[17]. The objective of this study is to check if the thermal, vibrational and dielectric signature of these three peptides in the solid state can inform on their self-assembling process in vivo and their propensity to coacervate or to give rise to irreversible amyloid fibers.
2.
Materials and methods
2.1. Peptide synthesis and purification
The synthesis and purification of the peptides were elsewhere described [15]; samples were delivered in the freeze-dried state.
The amino acid sequences of the studied elastin peptides EX30-17, EX30-18 and S4 are displayed in Table 1. The sequence of the whole peptide from EX30 (not studied in this work, but largely studied [3],[18]–[21] is added in this table for a full feature comparison of the coded sections.
The S4 sequence corresponds to the EX30 sequence without the first glycine residue and the last two (leucine and glycine) residues. Corresponding to a physiologic digest of enzymatic elastolysis, it was shown to aggregate into amyloids fibers [15].
The EX30-17 sequence corresponds to the first 17 N-terminal residues of EX30. Containing twice the (XGGZG) sequence and two alanine residues, it was identified as the smallest amyloidogenic peptide of elastin [22].
The EX30-18 sequence corresponds to the last 18 C-terminal residues of EX30 and it also contains twice the (XGGZG) sequence, a proline residue and none alanine residue. In contrast with the others peptides from EX30 this peptide coacervates, i.e. it self-assembles in a reversible way.
2.2. FTIR/ATR analysis
Fourier transform infrared spectroscopy/attenuated total reflectance (FTIR/ATR) spectra were collected using a Nicolet 5700 FTIR (THERMO FISHER SCIENTIFIC, Waltham, MA) equipped in ATR device equipped with a KBr beam splitter and a MCT/B detector. Spectra were recorded over the region of 4000–450 cm−1 with a data spacing of 0.25 cm−1, a band resolution of 2 cm−1 and 64 accumulations. The ATR accessory used was a Smart Orbit equipped with a type IIA diamond crystal (refractive index 2.4). A single-beam background spectrum was collected from the clean diamond crystal before each experiment and this background was subtracted from the spectra. After the baseline correction, the Y absorbances were divided by the height of the Amide II band for a better comparison between spectra. To quantify the secondary structures amount in the different peptides, a decomposition of the Amide I was performed using the Peak Resolve function in the Omnic 8.0 Software (THERMO FISHER SCIENTIFIC, Waltham, MA). In the curve fitting procedure, the location of the peaks was computed using the second derivative method and a combination of Gaussian-Lorentzian peaks shape was used for all the peaks.
2.3. Differential scanning calorimetry (DSC)
DSC analyses were performed using a DSC Pyris calorimeter (Perkin Elmer, USA) calibrated with cyclohexane and indium as standards, resulting in a temperature accuracy of ± 0.1 °C and an enthalpy accuracy of ± 0.2 J/g. Samples 5 mg in weight were sealed in aluminium pans. Experiments done in triplicate were performed between −100 °C and 200 °C with heating and cooling at 20 °C/min under helium atmosphere.
2.4. Dynamic Dielectric spectroscopy (DDS)
The dielectric measurements were performed using a broad-band dielectric spectrometer BDS 4000 system (Novocontrol technologies, Germany). Compressed powdered samples were kept in a special cell usually devoted to biological samples, consisting of two stainless electrodes surrounded by a PTFE ring. The diameter of the cell was 10 mm and the thickness of the samples was 200 µm.
Isothermal measurements of the complex dielectric function ϵ* = ϵ′-iϵ″ were performed at every 5 °C, with an isothermal stability of ± 0.1 °C from −145 °C to 150 °C in a frequency range 10−2 to 106 Hz. Amplitude of measuring voltage was 1 V. The experimental limit for the loss factor (tanδ = ϵ″/ϵ′) was about 10−4. ϵ′ and ϵ″ isothermal curves were then fitted using the sum of Havriliak-Negami function and DC conductivity term [23] to extract the relaxation times of the different relaxation modes.
Where ω is the pulsation, σ0 the DC conductivity, ϵ∞ the dielectric permittivity at high frequency, Δϵj the step of dielectric permittivity associated with of the jth relaxation mode and τj the relaxation time of the jth relaxation mode.
The powered samples were dehydrated with P2O5 before DDS measurements. To obtain hydrated states, dry power was rehydrated in saturated salt solution atmospheres of known relative humidity at 20 °C.
3.
Results and discussion
3.1. Vibrational signature
The spectra of the three peptides in the zone of interest [1800–450 cm−1] are superimposed on the Figure 1.
The FTIR spectra of these peptides are typical of polypeptides and proteins, evidencing amide I (C=O stretching), amide II (C-N stretching and N-H bending), and amide III (N-H in plane deformation) bands. Some distinct features can be observed on these global spectra, particularly the shift of amide II toward high wavenumber for EX30-17 and the specific fingerprint of each peptide in the [1360–900 cm−1] zone. It must be pointed out that the specific wagging of proline at 1340 cm−1 (marked by an asterisk) is clearly detected for both S4 and EX30-18 peptides.
Since the amide I-II region consists of several bands strongly dependent on secondary conformations, it was subjected to curve fitting in order to resolve the various underlying and overlapping spectral features that contribute to this complex region [24]–[27]. The decomposed FTIR spectra of the amide I region and the corresponding area ratio are presented in the supplementary Figure S1.
The predominant secondary structures of EX30-17 in the solid state are the β-sheets structures that account for almost 50% of the total structures. Coexisting with the PPII structure (~ 26%), a flexible structure devoid of intramolecular hydrogen bonds, it has been previously suggested that these β-sheets could easily interchange into cross-β structures, giving rise to amyloid fibers [28]. In contrast, unordered conformations are predominant for EX30-18. It could explain why this peptide self-assembles in a distinct way, via a reversible coacervation phenomenon. As for the S4 peptide, secondary structures are quite mixed, but the presence of β-sheets (~ 35%) combined with PPII appears sufficient to lead to cross-β aggregation in solution as it was already evidenced [15].
3.2. Thermal signature
DSC thermograms corresponding to the first and second heating scans are reported on Figure 2.
EX30-17 is the only peptide characterized by a well-defined endothermic phenomenon at the first heating (Tmax = 68 °C, ΔH = 28 J.g−1), generally associated with the presence of long-range order. As previously evidenced by FTIR, the predominant secondary structures of EX30-17 in the solid state are β-sheets that could explain this peculiar thermal behavior.
It is noteworthy that such an irreversible endothermic phenomenon has already been reported for S4 aggregated fibers at higher temperatures 145 °C [17], and associated with the collapse of amyloid fibers. In the case of EX30-17, cross-β structures FTIR attributed to amyloid fibers cannot be detected before aggregation, but the predominance of long-range β-sheets structures could be the signature of the prefibrillar state.
During the second heating, a glass transition phenomenon is detected at 95 °C for EX30-17 and associated with the amorphous phase.
In the case of S4 and EX30-18, the lack of endothermic events evidences the absence of long-range order, while the glass transition phenomenon at 150 °C (S4) and 128 °C (EX30-18), reversible on successive scans is ascribed to the amorphous phase. This thermal behavior is coherent with the quantification of secondary structures by FTIR, showing a predominance of unordered conformations for EX30-18 and a mix of unordered, PPII and β-sheets conformations for S4 in the solid state.
The broad and irreversible endotherm detected between 50 and 100 °C for EX30-18 can be attributed to the loss of bound water. The ability of this peptide to uptake water could be related to the predominance of unordered conformations: in the amorphous phase, increase of free volume is known to enhance water reachability. Finally, the endothermic event detected above 150 °C on the second heating for this peptide that could be associated with thermal degradation.
DSC experiments clearly illustrate that the physical structure of the peptides in the solid state is strongly dependent upon the amino acids sequence. The presence of the glycine residue at the N-terminal zone, the absence of proline in the sequence and the relative high proportion of alanine (EX30-17) seem to be the condition to reach a sufficient long-range order detectable by DSC; this long-range order in the solid state can be correlated to the prompt self-aggregation of this peptide in solution [15],[22]. The solid state mimics the high peptide concentration that can occur in the in vivo tissues and during pathological enzymatic processes.
3.3. Dielectric signature
The three-dimensional representations of the dielectric loss of the peptides in the freeze-dried state, i.e., the imaginary part of the dielectric permittivity ϵ″ versus frequency and temperature are presented in Figure 3.
Besides the increase of ϵ″ measured at low frequency and high temperature and attributed to conductivity, different relaxation modes are pointed out and indexed on Figure 3, that evidence the complexity of the molecular mobility of the different peptides. For a better reading we have plotted on supplementary Figures S2–S4 selected isothermal dielectric losses (tanδ = ϵ″/ϵ″) versus frequency for the three peptides.
For the S4 peptide, a low temperature mode (β mode) is evidenced between −115 and 45 °C, followed by a high temperature mode (α mode) between 110 and 145 °C. Two additional quasi-isothermal processes (MT modes) well detected in the dielectric map of the Figure 3 are evidenced at 17 and 57 °C. The associated temperature dependence of the relaxation time of each mode was plotted in Figure S2B.
The temperature dependence of the β mode obeys the Arrhenius law:
Where R is the universal gas constant, Ea (47 kJ/mol) is the activation energy and τ0 (3.5×10⁻¹⁵ s) the pre exponential factor. As previously reported in literature, a similar β mode is observed with comparable parameters for of a wide class of proteins and polypeptides and attributed to the localized orientation of carbonyl groups [29]. The value of Ea roughly corresponds to the energy needed for the breaking of two hydrogen bonds, allowing the further orientation of polar groups. At higher temperature, the α mode of S4 is a composite mode characterized by isothermal processes at low and high frequency and a temperature-frequency dependent behavior obeying the Arrhenius law between 1 and 1500Hz. This peculiar feature must be ascribed to overlapping transitions including: -structural first order transitions [30], (not detected by DSC, but consistent with a peculiar nanoscale ordering of S4 peptides, rich in β-sheets)
-the main process associated with the dielectric manifestation of the glass transition phenomenon, which was detected in this temperature range by DSC.
It must be pointed out that the α relaxation obeys an Arrhenius'law (and not a Vogel-Tamman-Fulcher's law) allowing us to associate this polypeptide to a strong glass in the Angell's classification [31] as already observed in proteins with an high density of hydrogen bonds.
For the EX30-18 peptide (Figure S3), a low temperature mode (β mode) obeying an Arrhenius law is evidenced between −110 and 50 °C, followed by another relaxation mode (α mode) between 55 and 95 °C. The origin of this β mode is similar to the S4 β mode, while the α mode could be attributed to the dielectric manifestation of the glass transition of EX30-18 observed in this temperature range by DSC.
For the EX30-17 (Figure S4), five relaxation modes are evidenced in this wide temperature range; the low temperature mode (β) obeys an Arrhenius law with the same interpretation as previously given, while the others modes are composite ones.
To compare the dynamics of the three peptides we have superimposed on Figure 4 the temperature dependence of the different relaxation times of the three studied peptides.
We can observe that the β mode of the three peptides have a similar behavior; we can assume that the distinct architecture of the three peptides from EX30 does not induce difference at this scale of mobility. In contrast, the relaxation modes observed at higher temperatures, that correspond to more delocalized motions or structural phase transitions (in the case of isothermal modes) are clearly dependent upon the architecture of the three peptides.
Another meaningful representation is the plot of the recalculated imaginary part of the dielectric permittivity ϵKK″ from the Kramers-Krönig formulation (KK) [32],[33] versus temperature for a selected frequency that could complete DSC data.
In this case we can observe at around −75 °C the similar β mode of the three peptides, corresponding to localized motions of the H-bonded carbonyl group C=O. It is noteworthy that such a motion is undetectable by DSC. At higher temperature, the dynamics of the three peptides differs: EX30-17 is characterized by successive and sharp increases of the dielectric losses between −50 and 100 °C, which could be associated to the dynamics of different ordered structures and their structural transitions. In peculiar the sharp increase of the dielectric losses between 40 and 70 °C must be compared to the DSC endotherm detected at 68 °C. Important variations of the dielectric absorption were already observed in literature for polypeptides undergoing transitions between different conformations, for example from helices to random chains [34]. The sharp variations observed for EX30-17 could correspond to the transition of differently ordered β-sheets zones towards random conformation with increasing temperature. In contrast, EX30-18 peptide present few dielectric losses until 100 °C (with the beginning of the dielectric manifestation of the glass transition, detected by DSC at 128 °C). The presence of twice the (XGGZG) sequence and the absence of alanine residue could account for this dielectric behavior, with any detection of nanocrystalline regions. As for S4 peptide, it presents an intermediate feature. If the sharp increase of the dielectric losses above 150 °C can be addressed to the nanometric motions of the glass transition also detected by DSC (at 150 °C), the dielectric losses evidenced between 20 and 110 °C are probably the dielectric signature of nanocrystalline regions not detected by DSC.
It was previously shown [15],[17],[35] that water enhances self-aggregation of S4 peptide: S4 peptide in solution gives rise to an irreversible aggregation when stirred at 60 °C or conserved one week at physiological temperature. So we attempted to investigate the role of water in the S4 peptide dynamics. For this purpose we performed dielectric measurement on S4 peptide rehydrated over a relative humidity of 33% and we superimposed the recalculated ϵ″KK on Figure 5. The localized β mode of rehydrated S4 peptide is shifted toward low temperature, which corresponds to a classical phenomenon of plasticization by water in biopolymers. The replacement of peptide-peptide hydrogen bonds by peptide-water hydrogens bonds enhances the mobility of carbonyl groups [29]. More remarkable is the feature of the dielectric losses at higher temperature, with a maximum followed by a sharp increase as for EX30-17, with a shift toward low temperature. As for EX30-17, this could be the dielectric signature of the prefibrillar state enhanced by water absorption.
4.
Conclusions
Combination of FTIR, DSC and DDS studies on three peptides derived from a peculiar sequence of elastin clearly evidences the strong effect of some modification of the studied sequence.
In the solid state, the vibrational, thermal and dielectric signatures are dependent upon the nature of the residues in the N-terminal and C-terminal region, the presence or absence of proline and alanine and the repetition of twice the (XGGZG) sequence. In this state, the electrostatic interactions, specifically the attractions between free charged terms i.e. positive N and negative C are of main relevance. However, hydrophobic interactions are indeed crucial when we consider the apolar side-chains of aminoacidic residues. These forces are considered responsible for the self-aggregation of amyloid-like fibrils, for example. Also in our case, we ascribe the spectral features to both types of forces.
An high proportion of β-sheets (quantified by FTIR) is correlated to a long-range order phase detectable by DSC and peculiar high dielectric absorptions, which evidence the high propensity of the peptide (when set in solution) to aggregate into amyloids fibers at room temperature. Dielectric analysis also allows to detect nano-crystalline regions untraceable by DSC which indicate a propensity of the peptide to aggregate into amyloids fibers if conditions of time and temperature are reached. Revealing the physical structure at the mesoscopic scale and the dynamics both at the nano and mesoscopic scales in the solid state, thermal and dielectric analyses show their high resolution power to discriminate between peptides that will reversibly coacervate or irreversibly aggregate in solution.
Even if presented data are obtained far away from physiological conditions, they lead to the comparison between the thermal and dielectric fingerprints of these peculiar peptides in the solid state. The scanned broad temperature range gives access to the multi-scale dynamics with a reduced handling time. Moreover, mimicking peptide accumulation observed in vivo (unbalanced enzymatic processes with pathology/ageing), the solid state is high of interest. Thermal and dielectric analyses could be used as a supplementary tool to screen between peptides leading to physiological or pathological self-assembling.