As an emerging financial tool, green bonds can broaden the financing channels of enterprises and stimulate the green innovation of enterprises. Based on the A-share data of Chinese listed companies from 2012 to 2020, this paper analyzes the impact of green bonds on green technology innovation by using a method of Difference in Difference with Propensity Score Matching (PSM-DID). We found that green bonds can significantly improve enterprise green technology innovation. Its positive impact is attributed to increases in media attention and R&D capital investment and a reduction in financing constraints. Green bonds play a greater role in the green innovation of strong financial constraints enterprises, non-SOEs and large-scale enterprises. Our findings have important reference significance for the improvement of the resource allocation role of green bonds and achievement of sustainable growth.
Citation: Tao Lin, Mingyue Du, Siyu Ren. How do green bonds affect green technology innovation? Firm evidence from China[J]. Green Finance, 2022, 4(4): 492-511. doi: 10.3934/GF.2022024
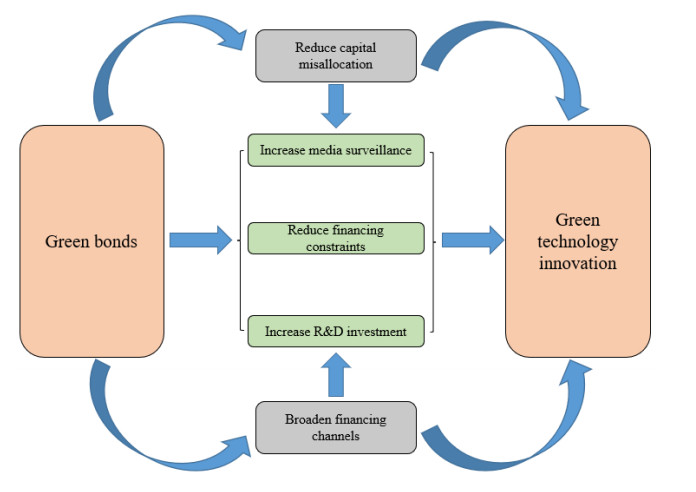
As an emerging financial tool, green bonds can broaden the financing channels of enterprises and stimulate the green innovation of enterprises. Based on the A-share data of Chinese listed companies from 2012 to 2020, this paper analyzes the impact of green bonds on green technology innovation by using a method of Difference in Difference with Propensity Score Matching (PSM-DID). We found that green bonds can significantly improve enterprise green technology innovation. Its positive impact is attributed to increases in media attention and R&D capital investment and a reduction in financing constraints. Green bonds play a greater role in the green innovation of strong financial constraints enterprises, non-SOEs and large-scale enterprises. Our findings have important reference significance for the improvement of the resource allocation role of green bonds and achievement of sustainable growth.

| [1] |
Barbieri N, Marzucchi A, Rizzo U (2020) Knowledge sources and impacts on subsequent inventions: Do green technologies differ from non-green ones? Res Policy 49: 103901. https://doi.org/10.1016/j.respol.2019.103901 doi: 10.1016/j.respol.2019.103901

|
| [2] |
Baulkaran V (2019) Stock market reaction to green bond issuance. J Asset Manage 20: 331–340. https://doi.org/10.1057/s41260-018-00105-1 doi: 10.1057/s41260-018-00105-1
|
| [3] |
Borsatto JMLS, Bazani CL (2021) Green innovation and environmental regulations: A systematic review of international academic works. Environ Sci Pollution Res 28: 63751–63768. https://doi.org/10.1007/s11356-020-11379-7 doi: 10.1007/s11356-020-11379-7
|
| [4] |
Broadstock DC, Cheng LT (2019) Time-varying relation between black and green bond price benchmarks: Macroeconomic determinants for the first decade. Financ Res Lette 29: 17–22. https://doi.org/10.1016/j.frl.2019.02.006 doi: 10.1016/j.frl.2019.02.006
|
| [5] |
Brown JR, Fazzari SM, Petersen BC (2009) Financing innovation and growth: Cash flow, external equity, and the 1990s R&D boom. J Finance 64: 151–185. https://doi.org/10.1111/j.1540-6261.2008.01431.x doi: 10.1111/j.1540-6261.2008.01431.x
|
| [6] |
Dangelico RM, Pujari D (2010) Mainstreaming green product innovation: Why and how companies integrate environmental sustainability. J Bus Ethics 95: 471–486. https://doi.org/10.1007/s10551-010-0434-0 doi: 10.1007/s10551-010-0434-0
|
| [7] |
Du K, Cheng Y, Yao X (2021) Environmental regulation, green technology innovation, and industrial structure upgrading: The road to the green transformation of Chinese cities. Energy Econ 98: 105247. https://doi.org/10.1016/j.eneco.2021.105247 doi: 10.1016/j.eneco.2021.105247
|
| [8] |
El Ghoul S, Guedhami O, Kim H, et al. (2018) Corporate environmental responsibility and the cost of capital: International evidence. J Bus Ethics 149: 335–361. https://doi.org/10.1007/s10551-015-3005-6 doi: 10.1007/s10551-015-3005-6
|
| [9] |
Flammer C (2021) Corporate green bonds. J Financ Econ 142: 499–516. https://doi.org/10.1016/j.jfineco.2021.01.010 doi: 10.1016/j.jfineco.2021.01.010
|
| [10] |
Ghisetti C, Quatraro F (2017) Green technologies and environmental productivity: A cross-sectoral analysis of direct and indirect effects in Italian regions. Ecol Econ 132: 1–13. https://doi.org/10.1016/j.ecolecon.2016.10.003 doi: 10.1016/j.ecolecon.2016.10.003
|
| [11] |
Hachenberg B, Schiereck D (2018). Are green bonds priced differently from conventional bonds? J Asset Manag 19: 371–383. https://doi.org/10.1057/s41260-018-0088-5 doi: 10.1057/s41260-018-0088-5
|
| [12] |
Hao Y, Ba N, Ren S, et al. (2021) How does international technology spillover affect China's carbon emissions? A new perspective through intellectual property protection. Sustain Prod Consump 25: 577–590. https://doi.org/10.1016/j.spc.2020.12.008 doi: 10.1016/j.spc.2020.12.008
|
| [13] |
Hao Y, Huang J, Guo Y, et al. (2022) Does the legacy of state planning put pressure on ecological efficiency? Evidence from China. Bus Strateg Environ 5: 1–22. https://doi.org/10.1002/bse.3066 doi: 10.1002/bse.3066
|
| [14] |
Hu AG, Jefferson GH (2009) A great wall of patents: What is behind China's recent patent explosion?. J Dev Econ 90: 57–68. https://doi.org/10.1016/j.jdeveco.2008.11.004 doi: 10.1016/j.jdeveco.2008.11.004
|
| [15] |
Huang H, Mbanyele W, Wang F, et al. (2022) Climbing the quality ladder of green innovation: Does green finance matter? Technol Forecast Soc 184: 122007. https://doi.org/10.1016/j.techfore.2022.122007 doi: 10.1016/j.techfore.2022.122007
|
| [16] |
Huang Z, Liao G, Li Z (2019) Loaning scale and government subsidy for promoting green innovation. Technol Forecast Soc 144: 148–156. https://doi.org/10.1016/j.techfore.2019.04.023 doi: 10.1016/j.techfore.2019.04.023
|
| [17] |
Hyun S, Park D, Tian S (2020) The price of going green: the role of greenness in green bond markets. Account Financ 60: 73–95. https://doi.org/10.1111/acfi.12515 doi: 10.1111/acfi.12515
|
| [18] |
Jiang Z, Wang Z, Lan X (2021) How environmental regulations affect corporate innovation? The coupling mechanism of mandatory rules and voluntary management. Technol Soc 65: 101575. https://doi.org/10.1016/j.techsoc.2021.101575 doi: 10.1016/j.techsoc.2021.101575
|
| [19] | Keohane NO, Olmstead SM (2016) Economic Efficiency and Environmental Protection. In Markets and the Environment. 11–34. Island Press, Washington, DC. https://doi.org/10.5822/978-1-61091-608-0_2 |
| [20] |
Larcker DF, Watts EM (2020) Where's the greenium? J Account Econ 69: 101312. https://doi.org/10.1016/j.jacceco.2020.101312 doi: 10.1016/j.jacceco.2020.101312
|
| [21] |
Li F, Xu X, Li Z, et al. (2021) Can low-carbon technological innovation truly improve enterprise performance? The case of Chinese manufacturing companies. J Clean Prod 293: 125949. https://doi.org/10.1016/j.jclepro.2021.125949 doi: 10.1016/j.jclepro.2021.125949
|
| [22] |
Li Z, Liao G, Albitar K (2020) Does corporate environmental responsibility engagement affect firm value? The mediating role of corporate innovation. Bus Strateg Environ 29: 1045–1055. https://doi.org/10.1002/bse.2416 doi: 10.1002/bse.2416
|
| [23] |
Lin B, Luan R (2020) Do government subsidies promote efficiency in technological innovation of China's photovoltaic enterprises? J Clean Prod 254: 120108. https://doi.org/10.1016/j.jclepro.2020.120108 doi: 10.1016/j.jclepro.2020.120108
|
| [24] |
Liu J, Zhao M, Wang Y (2020) Impacts of government subsidies and environmental regulations on green process innovation: A nonlinear approach. Technol Soc 63: 101417. https://doi.org/10.1016/j.techsoc.2020.101417 doi: 10.1016/j.techsoc.2020.101417
|
| [25] |
Liu P, Zhao Y, Zhu J, et al. (2022) Technological industry agglomeration, green innovation efficiency, and development quality of city cluster. Green Financ 4: 411–435. https://doi.org/10.3934/gf.2022020 doi: 10.3934/gf.2022020
|
| [26] |
Lv C, Shao C, Lee CC (2021) Green technology innovation and financial development: Do environmental regulation and innovation output matter? Energy Econ 98: 105237. https://doi.org/10.1016/j.eneco.2021.105237 doi: 10.1016/j.eneco.2021.105237
|
| [27] |
Managi S, Opaluch JJ, Jin D, et al. (2005) Environmental regulations and technological change in the offshore oil and gas industry. Land Econ 81: 303–319. https://doi.org/10.3368/le.81.2.303 doi: 10.3368/le.81.2.303
|
| [28] |
Mbanyele W, Huang H, Li Y, et al. (2022) Corporate social responsibility and green innovation: Evidence from mandatory CSR disclosure laws. Econ Lett 212: 110322. https://doi.org/10.1016/j.econlet.2022.110322 doi: 10.1016/j.econlet.2022.110322
|
| [29] |
Miao CL, Meng XN, Duan MM, et al. (2020) Energy consumption, environmental pollution, and technological innovation efficiency: taking industrial enterprises in China as empirical analysis object. Environ Sci Pollut Res 27: 34147–34157. https://doi.org/10.1007/s11356-020-09537-y doi: 10.1007/s11356-020-09537-y
|
| [30] |
Mughal N, Arif A, Jain V, et al. (2022) The role of technological innovation in environmental pollution, energy consumption and sustainable economic growth: Evidence from South Asian economies. Energy Strateg Rev 39: 100745. https://doi.org/10.1016/j.esr.2021.100745 doi: 10.1016/j.esr.2021.100745
|
| [31] |
Rahman S, Moral IH, Hassan M, et al. (2022) A systematic review of green finance in the banking industry: perspectives from a developing country. Green Financ 4: 347–363. https://doi.org/10.3934/gf.2022017 doi: 10.3934/gf.2022017
|
| [32] |
Reboredo JC (2018) Green bond and financial markets: Co-movement, diversification and price spillover effects. Energy Econ 74: 38–50. https://doi.org/10.1016/j.eneco.2018.05.030 doi: 10.1016/j.eneco.2018.05.030
|
| [33] |
Ren S, Hao Y, Wu H (2021) Government corruption, market segmentation and renewable energy technology innovation: Evidence from China. J Environ Manage 300: 113686. https://doi.org/10.1016/j.jenvman.2021.113686 doi: 10.1016/j.jenvman.2021.113686
|
| [34] |
Ren S, Hao Y, Wu H (2022a) Digitalization and environment governance: does internet development reduce environmental pollution? J Environ Plann Manage 3: 1–30. https://doi.org/10.1080/09640568.2022.2033959 doi: 10.1080/09640568.2022.2033959
|
| [35] |
Ren S, Liu Z, Zhanbayev R, et al. (2022b) Does the internet development put pressure on energy-saving potential for environmental sustainability? Evidence from China. J Econ Anal 1: 81–101. https://doi.org/10.12410/jea.2811-0943.2022.01.004 doi: 10.12410/jea.2811-0943.2022.01.004
|
| [36] |
Sartzetakis ES (2021) Green bonds as an instrument to finance low carbon transition. Econ Chang Restruct 54: 755–779. https://doi.org/10.1007/s10644-020-09266-9 doi: 10.1007/s10644-020-09266-9
|
| [37] |
Singh MP, Chakraborty A, Roy M (2016) The link among innovation drivers, green innovation and business performance: empirical evidence from a developing economy. World Review of Science, Technol Sustainable Dev 12: 316–334. https://doi.org/10.1504/wrstsd.2016.10003088 doi: 10.1504/wrstsd.2016.10003088
|
| [38] |
Wang F, Wang R, He Z (2021a) The impact of environmental pollution and green finance on the high-quality development of energy based on spatial Dubin model. Resour Policy 74: 102451. https://doi.org/10.1016/j.resourpol.2021.102451 doi: 10.1016/j.resourpol.2021.102451
|
| [39] |
Wang J, Chen X, Li X, et al. (2020) The market reaction to green bond issuance: Evidence from China. Pacific-Basin Financ J 60: 101294. https://doi.org/10.1016/j.pacfin.2020.101294 doi: 10.1016/j.pacfin.2020.101294
|
| [40] |
Wang P, Dong C, Chen N, et al. (2021b) Environmental Regulation, Government Subsidies, and Green Technology Innovation—A Provincial Panel Data Analysis from China. Int J Environ Res Public Health 18: 11991. https://doi.org/10.3390/ijerph182211991 doi: 10.3390/ijerph182211991
|
| [41] |
Wu H, Hao Y, Ren S, et al. (2021a) Does internet development improve green total factor energy efficiency? Evidence from China. Energy Policy 153: 112247. https://doi.org/10.1016/j.enpol.2021.112247 doi: 10.1016/j.enpol.2021.112247
|
| [42] |
Wu H, Xue Y, Hao Y, et al. (2021b) How does internet development affect energy-saving and emission reduction? Evidence from China. Energy Econ 103: 105577. https://doi.org/10.1016/j.eneco.2021.105577 doi: 10.1016/j.eneco.2021.105577
|
| [43] |
Xie X, Huo J, Zou H (2019) Green process innovation, green product innovation, and corporate financial performance: A content analysis method. J Bus Res 101: 697–706. https://doi.org/10.1016/j.jbusres.2019.01.010 doi: 10.1016/j.jbusres.2019.01.010
|
| [44] |
Yang X, Wang W, Su X, et al. (2022) Analysis of the influence of land finance on haze pollution: An empirical study based on 269 prefecture‐level cities in China. Growth Chang 4: 1–22. https://doi.org/10.1016/j.strueco.2020.12.001 doi: 10.1016/j.strueco.2020.12.001
|
| [45] |
Yang X, Wu H, Ren S, et al. (2021) Does the development of the internet contribute to air pollution control in China? Mechanism discussion and empirical test. Struct Chang Econ Dyn 56: 207–224. https://doi.org/10.1016/j.strueco.2020.12.001 doi: 10.1016/j.strueco.2020.12.001
|
| [46] |
Yao Y, Hu D, Yang C, et al. (2021) The impact and mechanism of fintech on green total factor productivity. Green Financ 3: 198–221. https://doi.org/10.3934/gf.2021011 doi: 10.3934/gf.2021011
|
| [47] |
Yeow KE, Ng SH (2021) The impact of green bonds on corporate environmental and financial performance. Managerial Financ 1: 1–20. https://doi.org/10.1108/mf-09-2020-0481 doi: 10.1108/mf-09-2020-0481
|
| [48] |
Yii KJ, Geetha C (2017) The nexus between technology innovation and CO2 emissions in Malaysia: evidence from granger causality test. Energy Procedia 105: 3118–3124. https://doi.org/10.1016/j.egypro.2017.03.654 doi: 10.1016/j.egypro.2017.03.654
|
| [49] |
Yin S, Zhang N, Li B (2020) Enhancing the competitiveness of multi-agent cooperation for green manufacturing in China: An empirical study of the measure of green technology innovation capabilities and their influencing factors. Sustain Prod Consump 23: 63–76. https://doi.org/10.1016/j.spc.2020.05.003 doi: 10.1016/j.spc.2020.05.003
|
| [50] |
Zerbib OD (2019) The effect of pro-environmental preferences on bond prices: Evidence from green bonds. J Bank Financ 98: 39–60. https://doi.org/10.1016/j.jbankfin.2018.10.012 doi: 10.1016/j.jbankfin.2018.10.012
|
| [51] |
Zhang D, Zhang Z, Managi S (2019) A bibliometric analysis on green finance: Current status, development, and future directions. Financ Res Lett 29: 425–430. https://doi.org/10.1016/j.frl.2019.02.003 doi: 10.1016/j.frl.2019.02.003
|
| [52] |
Zhang W, Li G (2020) Environmental decentralization, environmental protection investment, and green technology innovation. Environ Sci Pollut Res 10: 1–16. https://doi.org/10.1007/s11356-020-09849-z doi: 10.1007/s11356-020-09849-z
|
| [53] |
Zhao L, Zhang L, Sun J, et al. (2022) Can public participation constraints promote green technological innovation of Chinese enterprises? The moderating role of government environmental regulatory enforcement. Technol Forecast Soc Chang 174: 121198. https://doi.org/10.1016/j.techfore.2021.121198 doi: 10.1016/j.techfore.2021.121198
|
| [54] |
Zheng C, Deng F, Zhuo C, et al. (2022) Green Credit Policy, Institution Supply and Enterprise Green Innovation. J Econ Anal 1: 28–51. https://doi.org/10.12410/jea.2811-0943.2022.01.002 doi: 10.12410/jea.2811-0943.2022.01.002
|
| [55] |
Zhou Q, Du M, Ren S (2022) How government corruption and market segmentation affect green total factor energy efficiency in the post-COVID-19 era: Evidence from China. Front Energy Res 10: 1–16. https://doi.org/10.3389/fenrg.2022.878065 doi: 10.3389/fenrg.2022.878065
|


Figures(6) / Tables(5)

Tao Lin, Mingyue Du, Siyu Ren. How do green bonds affect green technology innovation? Firm evidence from China[J]. Green Finance, 2022, 4(4): 492-511. doi: 10.3934/GF.2022024


 DownLoad: