Citation: Austin Bushur, Kevin Ward, Tommy Flahaven, Tom Kelly, Jin H. Jo, Matt Aldeman. Techno-economic evaluation of installing EV and PV combined infrastructure on Academic Institution’s Parking Garages in Illinois, USA[J]. AIMS Energy, 2019, 7(1): 31-45. doi: 10.3934/energy.2019.1.31

| [1] | EPA (2018) Sources of Greenhouse Gas Emissions. Available from: https://www.epa.gov/ghgemissions/sources-greenhouse-gas-emissions. |
| [2] | Goldfarb B (2016) On College Campuses, Signs of Progress on Renewable Energy. Available from: http://e360.yale.edu/features/on_college_campuses_progress_on_renewable_energy. |
| [3] | Swatowska B, Panek P (2017) The impact of shading on solar cell electrical parameters. Opt Appl 47: 319–323. |
| [4] | Chao J (2017) Parking Lot Science: Is Black Best? Lawrence Berkeley National Lab. Available from: http://newscenter.lbl.gov/2012/09/13/parking-lot-science/. |
| [5] |
Alghamdi AS, Bahaj AS, Wu Y (2017) Assessment of Large Scale Photovoltaic Power Generation from Carport Canopies. Energies 10: 686. doi: 10.3390/en10050686

|
| [6] | NYSERDA (2017) Public Access Charging Stations. Available from: https://www.nyserda.ny.gov/Researchers-and-Policymakers/Electric-Vehicles/Case-Studies/Public-Access-Locations. |
| [7] | Jo JH, Ilves K, Barth T, et al. (2017) Implementation of a large-scale solar photovoltaic system at a higher education institution in Illinois, USA. AIMS Energy 5: 54–62. |
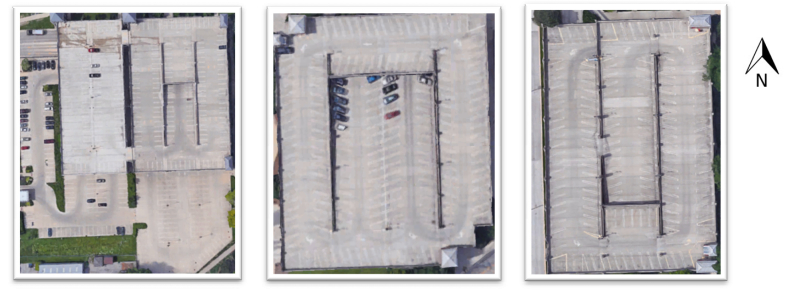
| [8] | Normal IL (2018) Google Earth [image]. Available from: https://earth.google.com. |
| [9] | Hybrid Cars.com Staff (2018) Hybrid Market Dashboard. Hybrid Cars. Available from: http://www.hybridcars.com/market-dashboard/http://www.hybridcars.com/market-dashboard/http://www.hybridcars.com/market-dashboard/. |
| [10] | Edelstein S (2013) How Did a Small Illinois Town End Up with 300 Plug-In Cars? Green Car Reports. Available from: https://www.greencarreports.com/news/1089012_how-did-a-small-illinois-town-end-up-with-300-plug-in-cars. |
| [11] | U.S. Census Bureau (2018) Normal, IL Search Results. U.S. Department of Commerce. Available from: https://www.census.gov/search-results.html?q=normal+IL+population&page=1&stateGeo=none&searchtype=web&cssp=SERP. |
| [12] | Forbes (2017) America's Top Colleges. Illinois State University. Available from: https://www.forbes.com/colleges/illinois-state-university/. |
| [13] | EV Adoption (2018) EV Market Share. Available from: http://evadoption.com/ev-market-share/http://evadoption.com/ev-market-share/http://evadoption.com/ev-market-share/. |
Figures(8) / Tables(12)

Austin Bushur, Kevin Ward, Tommy Flahaven, Tom Kelly, Jin H. Jo, Matt Aldeman. Techno-economic evaluation of installing EV and PV combined infrastructure on Academic Institution’s Parking Garages in Illinois, USA[J]. AIMS Energy, 2019, 7(1): 31-45. doi: 10.3934/energy.2019.1.31


 DownLoad: