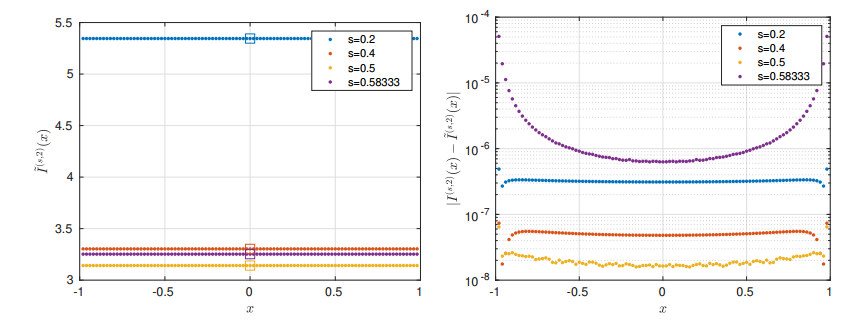
We face a rigidity problem for the fractional $ p $-Laplace operator to extend to this new framework some tools useful for the linear case. It is known that $ (-\Delta)^s(1-|x|^{2})^s_+ $ and $ -\Delta_p(1-|x|^{\frac{p}{p-1}}) $ are constant functions in $ (-1, 1) $ for fixed $ p $ and $ s $. We evaluated $ (-\Delta_p)^s(1-|x|^{\frac{p}{p-1}})^s_+ $ proving that it is not constant in $ (-1, 1) $ for some $ p\in (1, +\infty) $ and $ s\in (0, 1) $. This conclusion is obtained numerically thanks to the use of very accurate Gaussian numerical quadrature formulas.
Citation: Francesca Colasuonno, Fausto Ferrari, Paola Gervasio, Alfio Quarteroni. Some evaluations of the fractional $ p $-Laplace operator on radial functions[J]. Mathematics in Engineering, 2023, 5(1): 1-23. doi: 10.3934/mine.2023015
We face a rigidity problem for the fractional $ p $-Laplace operator to extend to this new framework some tools useful for the linear case. It is known that $ (-\Delta)^s(1-|x|^{2})^s_+ $ and $ -\Delta_p(1-|x|^{\frac{p}{p-1}}) $ are constant functions in $ (-1, 1) $ for fixed $ p $ and $ s $. We evaluated $ (-\Delta_p)^s(1-|x|^{\frac{p}{p-1}})^s_+ $ proving that it is not constant in $ (-1, 1) $ for some $ p\in (1, +\infty) $ and $ s\in (0, 1) $. This conclusion is obtained numerically thanks to the use of very accurate Gaussian numerical quadrature formulas.

| [1] |
X. Cabré, Y. Sire, Nonlinear equations for fractional Laplacians, Ⅰ: Regularity, maximum principles, and Hamiltonian estimates, Ann. Inst. H. Poincaré Anal. Non Linéaire, 31 (2014), 23–53. http://dx.doi.org/10.1016/j.anihpc.2013.02.001 doi: 10.1016/j.anihpc.2013.02.001

|
| [2] | C. Canuto, M. Y. Hussaini, A. Quarteroni, T. A. Zang, Spectral methods: Evolution to complex geometries and applications to fluid dynamics, Berlin, Heidelberg: Springer, 2007. http://dx.doi.org/10.1007/978-3-540-30728-0 |
| [3] |
C. Canuto, A. Quarteroni, Approximation results for orthogonal polynomials in Sobolev spaces, Math. Comput., 38 (1982), 67–86. http://dx.doi.org/10.1090/S0025-5718-1982-0637287-3 doi: 10.1090/S0025-5718-1982-0637287-3
|
| [4] |
W. Chen, C. Li, Maximum principles for the fractional $p$-Laplacian and symmetry of solutions, Adv. Math., 335 (2018), 735–758. http://dx.doi.org/10.1016/j.aim.2018.07.016 doi: 10.1016/j.aim.2018.07.016
|
| [5] |
E. Cinti, F. Colasuonno, A nonlocal supercritical Neumann problem, J. Differ. Equations, 268 (2020), 2246–2279. http://dx.doi.org/10.1016/j.jde.2019.09.014 doi: 10.1016/j.jde.2019.09.014
|
| [6] |
F. Colasuonno, F. Ferrari, The soap bubble-theorem and a $p$-Laplacian overdetermined problem, Commun. Pure Appl. Anal., 19 (2020), 983–1000. http://dx.doi.org/10.3934/cpaa.2020045 doi: 10.3934/cpaa.2020045
|
| [7] |
L. M. Del Pezzo, A. Quaas, A Hopf's lemma and a strong minimum principle for the fractional $p$-Laplacian, J. Differ. Equations, 263 (2017), 765–778. http://dx.doi.org/10.1016/j.jde.2017.02.051 doi: 10.1016/j.jde.2017.02.051
|
| [8] |
F. del Teso, D. Gómez-Castro, J. L. Vázquez, Three representations of the fractional $p$-Laplacian: semigroup, extension and Balakrishnan formulas, Fract. Calc. Appl. Anal., 24 (2021), 966–1002. http://dx.doi.org/10.1515/fca-2021-0042 doi: 10.1515/fca-2021-0042
|
| [9] |
B. Dyda, Fractional calculus for power functions and eigenvalues of the fractional Laplacian, Fract. Calc. Appl. Anal., 15 (2012), 536–555. http://dx.doi.org/10.2478/s13540-012-0038-8 doi: 10.2478/s13540-012-0038-8
|
| [10] |
M. M. Fall, S. Jarohs, Overdetermined problems with fractional Laplacian, ESAIM Control Optim. Calc. Var., 21 (2015), 924–938. http://dx.doi.org/10.1051/cocv/2014048 doi: 10.1051/cocv/2014048
|
| [11] | P. Gervasio, A MATLAB tool for evaluating the fractional $p$-Laplace operator in 1D domains. Available from: https://github.com/pgerva/fractional-p-laplace.git. |
| [12] | A. Iannizzotto, S. Mosconi, N. Papageorgiou, On the logistic equation for the fractional p-laplacian, 2021, arXiv: 2101.05535. |
| [13] | A. Iannizzotto, S. Mosconi, M. Squassina, Global Hölder regularity for the fractional $p$-Laplacian, Rev. Mat. Iberoam., 32 (2016), 1353–1392. |
| [14] |
H. Ishii, G. Nakamura, A class of integral equations and approximation of $p$-Laplace equations, Calc. Var., 37 (2010), 485–522. http://dx.doi.org/10.1007/s00526-009-0274-x doi: 10.1007/s00526-009-0274-x
|
| [15] |
S. Jarohs, Strong comparison principle for the fractional $p$-Laplacian and applications to starshaped rings, Adv. Nonlinear Stud., 18 (2018), 691–704. http://dx.doi.org/10.1515/ans-2017-6039 doi: 10.1515/ans-2017-6039
|
| [16] |
S. Jarohs, T. Weth, On the strong maximum principle for nonlocal operators, Math. Z., 293 (2019), 81–111. http://dx.doi.org/10.1007/s00209-018-2193-z doi: 10.1007/s00209-018-2193-z
|
| [17] |
E. Lindgren, P. Lindqvist, Fractional eigenvalues, Calc. Var., 49 (2014), 795–826. http://dx.doi.org/10.1007/s00526-013-0600-1 doi: 10.1007/s00526-013-0600-1
|
| [18] |
J. J. Manfredi, $p$-harmonic functions in the plane, Proc. Amer. Math. Soc., 103 (1988), 473–479. http://dx.doi.org/10.1090/S0002-9939-1988-0943069-2 doi: 10.1090/S0002-9939-1988-0943069-2
|
| [19] |
R. Musina, A. I. Nazarov, Strong maximum principles for fractional Laplacians, Proc. Roy. Soc. Edinb. A, 149 (2019), 1223–1240. http://dx.doi.org/10.1017/prm.2018.81 doi: 10.1017/prm.2018.81
|
| [20] | S. G. Samko, A. A. Kilbas, O. I. Marichev, Fractional integrals and derivatives: theory and applications, Yverdon: Gordon and Breach Science Publishers, 1993. |
| [21] |
L. F. Shampine, Vectorized adaptive quadrature in Matlab, J. Comput. Appl. Math., 211 (2008), 131–140. http://dx.doi.org/10.1016/j.cam.2006.11.021 doi: 10.1016/j.cam.2006.11.021
|
| [22] | Wolfram Research Inc., Mathematica, Version 12.3.1, Champaign, IL, 2021. Availabe from: https://www.wolfram.com/mathematica. |


Figures(4) / Tables(1)

Francesca Colasuonno, Fausto Ferrari, Paola Gervasio, Alfio Quarteroni. Some evaluations of the fractional $ p $-Laplace operator on radial functions[J]. Mathematics in Engineering, 2023, 5(1): 1-23. doi: 10.3934/mine.2023015


 DownLoad: