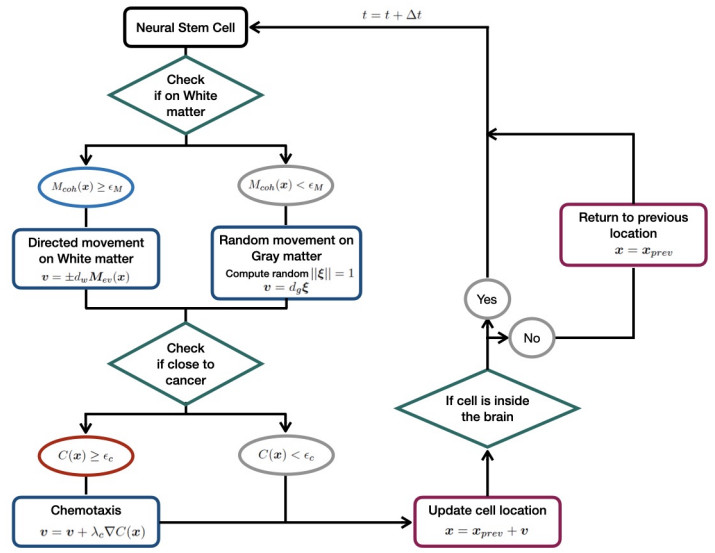
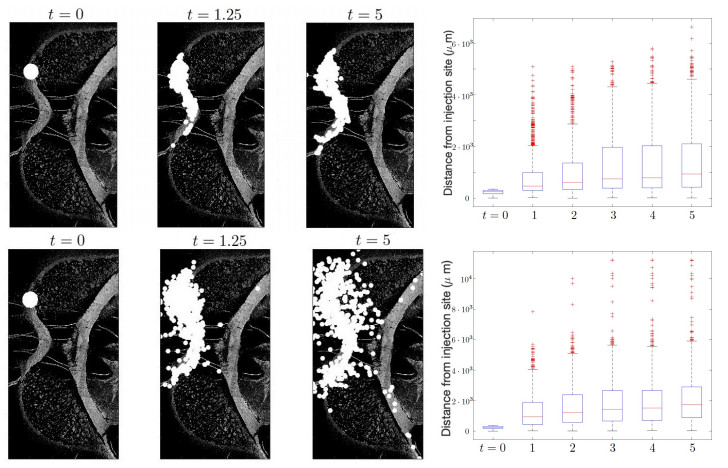
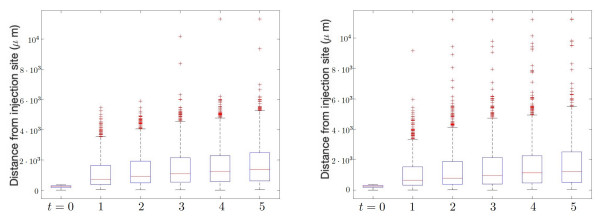
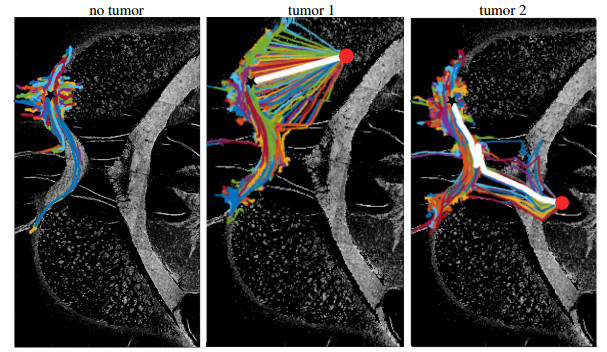
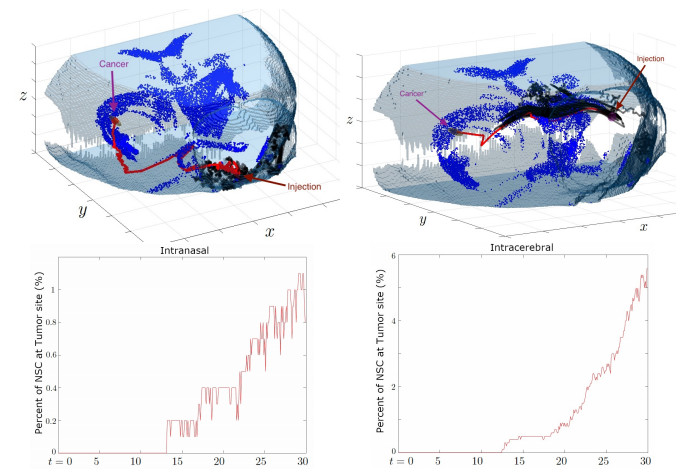
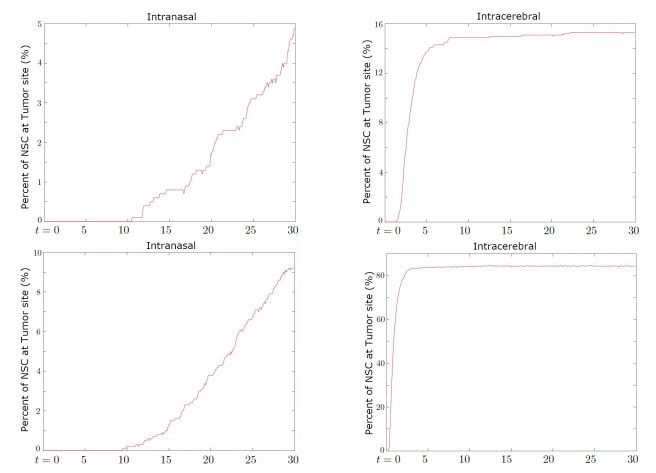
Neural stem cells (NSCs) offer a potential solution to treating brain tumors. This is because NSCs can circumvent the blood-brain barrier and migrate to areas of damage in the central nervous system, including tumors, stroke, and wound injuries. However, for successful clinical application of NSC treatment, a sufficient number of viable cells must reach the diseased or damaged area(s) in the brain, and evidence suggests that it may be affected by the paths the NSCs take through the brain, as well as the locations of tumors. To study the NSC migration in brain, we develop a mathematical model of therapeutic NSC migration towards brain tumor, that provides a low cost platform to investigate NSC treatment efficacy. Our model is an extension of the model developed in Rockne et al. (PLoS ONE 13, e0199967, 2018) that considers NSC migration in non-tumor bearing naive mouse brain. Here we modify the model in Rockne et al. in three ways: (i) we consider three-dimensional mouse brain geometry, (ii) we add chemotaxis to model the tumor-tropic nature of NSCs into tumor sites, and (iii) we model stochasticity of migration speed and chemosensitivity. The proposed model is used to study migration patterns of NSCs to sites of tumors for different injection strategies, in particular, intranasal and intracerebral delivery. We observe that intracerebral injection results in more NSCs arriving at the tumor site(s), but the relative fraction of NSCs depends on the location of injection relative to the target site(s). On the other hand, intranasal injection results in fewer NSCs at the tumor site, but yields a more even distribution of NSCs within and around the target tumor site(s).
Citation: Justin Gomez, Nathanael Holmes, Austin Hansen, Vikram Adhikarla, Margarita Gutova, Russell C. Rockne, Heyrim Cho. Mathematical modeling of therapeutic neural stem cell migration in mouse brain with and without brain tumors[J]. Mathematical Biosciences and Engineering, 2022, 19(3): 2592-2615. doi: 10.3934/mbe.2022119
Neural stem cells (NSCs) offer a potential solution to treating brain tumors. This is because NSCs can circumvent the blood-brain barrier and migrate to areas of damage in the central nervous system, including tumors, stroke, and wound injuries. However, for successful clinical application of NSC treatment, a sufficient number of viable cells must reach the diseased or damaged area(s) in the brain, and evidence suggests that it may be affected by the paths the NSCs take through the brain, as well as the locations of tumors. To study the NSC migration in brain, we develop a mathematical model of therapeutic NSC migration towards brain tumor, that provides a low cost platform to investigate NSC treatment efficacy. Our model is an extension of the model developed in Rockne et al. (PLoS ONE 13, e0199967, 2018) that considers NSC migration in non-tumor bearing naive mouse brain. Here we modify the model in Rockne et al. in three ways: (i) we consider three-dimensional mouse brain geometry, (ii) we add chemotaxis to model the tumor-tropic nature of NSCs into tumor sites, and (iii) we model stochasticity of migration speed and chemosensitivity. The proposed model is used to study migration patterns of NSCs to sites of tumors for different injection strategies, in particular, intranasal and intracerebral delivery. We observe that intracerebral injection results in more NSCs arriving at the tumor site(s), but the relative fraction of NSCs depends on the location of injection relative to the target site(s). On the other hand, intranasal injection results in fewer NSCs at the tumor site, but yields a more even distribution of NSCs within and around the target tumor site(s).

| [1] |
A. U. Ahmed, N. G. Alexiades, M. S. Lesniak, The use of neural stem cells in cancer gene therapy: Predicting the path to the clinic, Curr. Opin. Mol. Ther., 12 (2010), 546–552. https://doi.org/10.1016/j.copbio.2010.06.005. doi: 10.1016/j.copbio.2010.06.005

|
| [2] |
M. E. Barish, K. Herrmann, Y. Tang, S. A. Herculian, M. Metz, S. Aramburo, et al., Human neural stem cell biodistribution and predicted tumor coverage by a diffusible therapeutic in a mouse glioma model, Stem Cells Transl. Med., 6 (2017), 1522–1532. https://doi.org/10.1002/sctm.16-0397. doi: 10.1002/sctm.16-0397
|
| [3] |
M. Gutova, J. P. Cheng, V. Adhikarla, L. Tsaturyan, M. E. Barish, R. C. Rockne, et al., Intranasally administered L-Myc-immortalized human neural stem cells migrate to primary and distal sites of damage after cortical impact and enhance spatial learning, Stem Cells Int., 2021 (2021), 1–11. https://doi.org/10.1155/2021/5549381. doi: 10.1155/2021/5549381
|
| [4] |
Z. Li, D. Oganesyan, R. Mooney, X. Rong, M. J. Christensen, D. Shahmanyan, et al., L-MYC expression maintains self-renewal and prolongs multipotency of primary human neural stem cells, Stem Cell Rep., 7 (2016), 483–495. https://doi.org/10.1016/j.stemcr.2016.07.013. doi: 10.1016/j.stemcr.2016.07.013
|
| [5] |
M. Gutova, J. A. Frank, M. D'apuzzo, V. Khankaldyyan, M. M. Gilchrist, A. J. Annala, et al., Magnetic resonance imaging tracking of Ferumoxytol-labeled human neural stem cells : Studies leading to clinical use, Stem Cells Trans. Med., 2 (2013), 766–775. https://doi.org/10.5966/sctm.2013-0049. doi: 10.5966/sctm.2013-0049
|
| [6] |
M. Gutova, L. Flores, V. Adhikarla, L. Tsaturyan, R. Tirughana, S. Aramburo, et al., Quantitative evaluation of intraventricular delivery of therapeutic neural stem cells to orthotopic glioma, Front. Oncol., 9 (2019), 1–8. https://doi.org/10.3389/fonc.2019.00068. doi: 10.3389/fonc.2019.00068
|
| [7] |
I. V. Balyasnikova, M. S. Prasol, S. D. Ferguson, Y. Han, A. U. Ahmed, M. Gutova, et al., Intranasal delivery of mesenchymal stem cells significantly extends survival of irradiated mice with experimental brain tumors, Mol. Ther., 22 (2014), 140–148. https://doi.org/10.1038/mt.2013.199. doi: 10.1038/mt.2013.199
|
| [8] |
K. S. Aboody, J. Najbauer, M. Z. Metz, M. D'Apuzzo, M. Gutova, A. J. Annala, et al., Neural stem cell–mediated enzyme/prodrug therapy for glioma: Preclinical studies, Sci. Trans. Med., 5 (2013), 184ra59. https://doi.org/10.1126/scitranslmed.3005365. doi: 10.1126/scitranslmed.3005365
|
| [9] |
A. L. Alexander, J. E. Lee, M. Lazar, A. S. Field, Diffusion tensor imaging of the brain, Neurotherapeutics, 4 (2007), 316–329. https://doi.org/10.1016/j.nurt.2007.05.011. doi: 10.1016/j.nurt.2007.05.011
|
| [10] |
R. C. Rockne, V. Adhikarla, L. Tsaturyan, Z. Li, M. B. Masihi, K. S. Aboody, et al., Long-term stability and computational analysis of migration patterns of L-MYC immortalized neural stem cells in the brain, PLoS One, 13 (2018), 1–15. https://doi.org/10.1371/journal.pone.0199967. doi: 10.1371/journal.pone.0199967
|
| [11] |
K. J. Painter, T. Hillen, Mathematical modelling of glioma growth: the use of diffusion tensor imaging (dti) data to predict the anisotropic pathways of cancer invasion, J. Theor. Biol., 323 (2013), 25–39. https://doi.org/10.1016/j.jtbi.2013.01.014. doi: 10.1016/j.jtbi.2013.01.014
|
| [12] |
M. Gutova, J. Najbauer, R. T. Frank, S. E. Kendall, A. Gevorgyan, M. Z. Metz, et al., Urokinase plasminogen activator and urokinase plasminogen activator receptor mediate human stem cell tropism to malignant solid tumors, Stem Cells, 26 (2008), 1406–1413. https://doi.org/10.1634/stemcells.2008-0141. doi: 10.1634/stemcells.2008-0141
|
| [13] |
J. Breton, Y. Mao-Draayer. Impact of cytokines on neural stem/progenitor cell fate, J. Neurol. Neurophysiol., 4 (2011), 1–12. https://doi.org/10.4172/2155-9562.S4-001. doi: 10.4172/2155-9562.S4-001
|
| [14] | C. Kizil, N. Kyritsis, M. Brand, Effects of inflammation on stem cells: together they strive? EMBO Rep., 16 (2015), 416–426. https://doi.org/10.15252/embr.201439702. |
| [15] |
R. B. Colquitt, D. A. Colquhoun, R. H. Thiele, In silico modelling of physiologic systems, Best Pract. Res. Clin. Anaesthesiol., 25 (2011), 499–510. https://doi.org/10.1016/j.bpa.2011.08.006. doi: 10.1016/j.bpa.2011.08.006
|
| [16] |
C. Jean-Quartier, F. Jeanquartier, I. Jurisica, A. Holzinger, In silico cancer research towards 3r, BMC Cancer, 18 (2018), 1–12. https://doi.org/10.1186/s12885-018-4302-0. doi: 10.1186/s12885-018-4302-0
|
| [17] |
Y. Mansury, M. Kimura, J. Lobo, T. S. Deisboeck, Emerging patterns in tumor systems: simulating the dynamics of multicellular clusters with an agent-based spatial agglomeration model, J. Theor. Biol., 219 (2002), 343–370. https://doi.org/10.1006/jtbi.2002.3131. doi: 10.1006/jtbi.2002.3131
|
| [18] |
D. G. Mallett, L. G. De Pillis, A cellular automata model of tumor-immune system interactions, J. Theor. Biol., 239 (2006), 334–350. https://doi.org/10.1016/j.jtbi.2005.08.002. doi: 10.1016/j.jtbi.2005.08.002
|
| [19] |
J. Metzcar, Y. Wang, R. Heiland, P. Macklin, A review of cell-based computational modeling in cancer biology, JCO Clin. Cancer Inf., 2 (2019), 1–13. https://doi.org/10.1200/CCI.18.00069. doi: 10.1200/CCI.18.00069
|
| [20] |
H. Murphy, H. Jaafari, H. M. Dobrovolny, Differences in predictions of ODE models of tumor growth: A cautionary example, BMC Cancer, 16 (2016), 1–10. https://doi.org/10.1186/s12885-016-2164-x. doi: 10.1186/s12885-016-2164-x
|
| [21] |
B. G. Birkhead, E. M. Rakin, S. Gallivan, L. Dones, R. D. Rubens, A mathematical model of the development of drug resistance to cancer chemotherapy, Eur. J. Cancer Clin. Oncol., 23 (1987), 1421–1427. https://doi.org/10.1016/0277-5379(87)90133-7. doi: 10.1016/0277-5379(87)90133-7
|
| [22] |
C. Tomasetti, D. Levy, An elementary approach to modeling drug resistance in cancer, Math. Biosci. Eng., 7 (2010), 905–918. https://doi.org/10.3934/mbe.2010.7.905. doi: 10.3934/mbe.2010.7.905
|
| [23] | H. Cho, A. L. Lewis, K. M. Storey, R. Jennings, B. Shtylla, A. M. Reynolds, et al., A framework for performing data-driven modeling of tumor growth with radiotherapy treatment, Springer, 22 (2020), 179–216. https://doi.org/10.1007/978-3-030-57129-0_8. |
| [24] |
A. R. Anderson, M. Chaplain, Continuous and discrete mathematical models of tumor-induced angiogenesis, Bull. Math. Biol., 60 (1998), 857–899. https://doi.org/10.1006/bulm.1998.0042. doi: 10.1006/bulm.1998.0042
|
| [25] |
O. Trédan, C. M. Galmarini, K. Patel, I. F. Tannock, Drug resistance and the solid tumor microenvironment, J. Natl. Cancer Inst., 99 (2007), 1441–1454. https://doi.org/10.1093/jnci/djm135. doi: 10.1093/jnci/djm135
|
| [26] |
A. Wu, K. Loutherback, G. Lambert, L. Estévez-Salmerón, T. D. Tlsty, R. H. Austin, et al., Cell motility and drug gradients in the emergence of resistance to chemotherapy, Proc. Natl. Acad. Sci., 110 (2013), 16103–16108. https://doi.org/10.1073/pnas.1314385110. doi: 10.1073/pnas.1314385110
|
| [27] |
A. Lorz, T. Lorenzi, M. E. Hochberg, J. Clairambault, B. Perthame, Populational adaptive evolution, chemotherapeutic resistance and multiple anti-cancer therapies, Esaim Math. Model. Numer. Anal., 47 (2013), 377–399. https://doi.org/10.1051/m2an/2012031. doi: 10.1051/m2an/2012031
|
| [28] |
J. Greene, O. Lavi, M. M. Gottesman, D. Levy, The impact of cell density and mutations in a model of multidrug resistance in solid tumors, Bull. Math. Biol., 74 (2014), 627–653. https://doi.org/10.1007/s11538-014-9936-8. doi: 10.1007/s11538-014-9936-8
|
| [29] |
H. Cho, D. Levy, Modeling the chemotherapy-induced selection of drug-resistant traits during tumor growth, J. Theor. Biol., 436 (2018), 120–134. https://doi.org/10.1016/j.jtbi.2017.10.005. doi: 10.1016/j.jtbi.2017.10.005
|
| [30] |
Y. Liu, J. Purvis, A. Shih, J. Weinstein, N. Agrawal, R. Radhakrishnan, A multiscale computational approach to dissect early events in the erb family receptor mediated activation, differential signaling, and relevance to oncogenic transformations, Ann. Biomed. Eng., 35 (2007), 1012–1025. https://doi.org/10.1007/s10439-006-9251-0. doi: 10.1007/s10439-006-9251-0
|
| [31] | I. Ramis-Conde, M. A. J. Chaplain, A. R..A. Anderson, D. Drasdo, Multi-scale modelling of cancer cell intravasation: The role of cadherins in metastasis, Phys. Biol., 6 (2009). https://doi.org/10.1088/1478-3975/6/1/016008. |
| [32] |
A. Hawkins-Daarud, S. Prudhomme, K. G. van der Zee, J. T. Oden, Bayesian calibration, validation, and uncertainty quantification of diffuse interface models of tumor growth, J. Math. Biol., 67 (2013), 1457–1485. https://doi.org/10.1007/s00285-012-0595-9. doi: 10.1007/s00285-012-0595-9
|
| [33] | V. Cristini, H. B. Frieboes, X. Li, J. S. Lowengrub, P. Macklin, S. Sanga, et al., Nonlinear modeling and simulation of tumor growth, in Selected Topics in Cancer Modeling, Springer, (2008), 113–181. https://doi.org/10.1007/978-0-8176-4713-1_6. |
| [34] |
H. M. Byrne, T. Alarcon, M. R. Owen, S. D. Webb, P. K. Maini, Modelling aspects of cancer dynamics: a review, Phil. Trans. R. Soc. A., 364 (2006), 1563–1578. https://doi.org/10.1098/rsta.2006.1786. doi: 10.1098/rsta.2006.1786
|
| [35] |
N. Bellomo, E. De Angelis, L. Preziosi, Multiscale modeling and mathematical problems related to tumor evolution and medical therapy, J. Theor. Med., 5 (2003), 111–136. https://doi.org/10.1080/1027336042000288633. doi: 10.1080/1027336042000288633
|
| [36] |
J. S. Lowengrub, H. B. Frieboes, F. Jin, Y. L. Chuang, X. Li, P. Macklin, et al., Nonlinear modelling of cancer: bridging the gap between cells and tumours, Nonlinearity, 23 (2010), R1–R9. https://doi.org/10.1088/0951-7715/23/1/r01. doi: 10.1088/0951-7715/23/1/r01
|
| [37] |
P. M. Altrock, L. L. Liu, F. Michor, The mathematics of cancer: Integrating quantitative models, Nat. Rev. Cancer, 15 (2015), 730–745. https://doi.org/10.1038/nrc4029. doi: 10.1038/nrc4029
|
| [38] | R. A. Gatenby, E. T. Gawlinski, A reaction-diffusion model of cancer invasion, Cancer Res., 56 (1996), 5745–5753. Available from: https://cancerres.aacrjournals.org/content/56/24/5745.full-text.pdf. |
| [39] |
H. M. Byrne, Biological inferences from a mathematical model for malignant invasion, Invasion Metastasis, 16 (1996), 209–22l. https://doi.org/10.1016/S0360-3016(96)90064-4. doi: 10.1016/S0360-3016(96)90064-4
|
| [40] |
M. A. J. Chaplain, M. Lachowicz, Z. Szymańska, D. Wrzosek, Mathematical modelling of cancer invasion: the importance of cell–cell adhesion and cell–matrix adhesion, Math. Models Methods Appl. Sci., 21 (2011), 719–743. https://doi.org/10.1142/S0218202511005192. doi: 10.1142/S0218202511005192
|
| [41] |
A. J. Perumpanani, D. L. Simmons, A. J. H. Gearing, K. M. Miller, G. Ward, J. Norbury, et al., Extracellular matrix-mediated chemotaxis can impede cell migration, Proc. R. Soc. B, 265 (1998), 2347–2352. https://doi.org/10.1098/rspb.1998.0582. doi: 10.1098/rspb.1998.0582
|
| [42] |
J. B. McGillen, E. A. Gaffney, N. K. Martin, P. K. Maini, A general reaction–diffusion model of acidity in cancer invasion, J. Math. Biol., 68 (2014), 1199–1224. https://doi.org/10.1007/s00285-013-0665-7. doi: 10.1007/s00285-013-0665-7
|
| [43] |
A. R. A Anderson, M. A. J. Chaplain, E. L. Newman, R. J. C. Steele, A. M. Thompson, Mathematical modelling of tumour invasion and metastasis, Comput. Math. Methods Med., 2 (2000), 129–154. https://doi.org/10.1080/10273660008833042. doi: 10.1080/10273660008833042
|
| [44] | N. Sfakianakis, M. A. J. Chaplain, Mathematical modelling of cancer invasion: A review. in International Conference by Center for Mathematical Modeling and Data Science, Osaka University, Springer, (2020), 153–172. https://doi.org/10.1007/978-981-16-4866-3_10. |
| [45] |
K. R. Swanson, C. Bridge, J. D. Murray, E. C. Alvord, Virtual and real brain tumors: using mathematical modeling to quantify glioma growth and invasion, J. Neurol. Sci., 216 (2003), 1–10. https://doi.org/10.1016/j.jns.2003.06.001. doi: 10.1016/j.jns.2003.06.001
|
| [46] | H. Hatzikirou, A. Deutsch, C. Schaller, M. Simon, K. Swanson, Mathematical modelling of glioblastoma tumour development: a review. Math. Models Methods Appl. Sci., 15 (2005), 1779–1794. https://doi.org/10.1142/S0218202505000960. |
| [47] |
J. C. L. Alfonso, K. Talkenberger, M. Seifert, B. Klink, A. Hawkins-Daarud, K. R. Swanson, et al., The biology and mathematical modelling of glioma invasion: a review, J. R. Soc., Interface, 14 (2017), 20170490. https://doi.org/10.1098/rsif.2017.0490. doi: 10.1098/rsif.2017.0490
|
| [48] |
C. Engwer, T. Hillen, M. Knappitsch, C. Surulescu, Glioma follow white matter tracts: a multiscale dti-based model, J. Math. Biol., 71 (2015), 551–582. https://doi.org/10.1007/s00285-014-0822-7. doi: 10.1007/s00285-014-0822-7
|
| [49] |
A. Swan, T. Hillen, J. C. Bowman, A. D. Murtha, A patient-specific anisotropic diffusion model for brain tumour spread, Bull. Math. Biol., 80 (2018), 1259–1291. https://doi.org/10.1007/s11538-017-0271-8. doi: 10.1007/s11538-017-0271-8
|
| [50] |
C. C. V. Chen, Y. H. Hsu, D. M. Jayaseema, J. Y. J. Chen, D. Y. Hueng, C. Chang, White matter tracts for the trafficking of neural progenitor cells characterized by cellular MRI and immunohistology: the role of CXCL12/CXCR4 signaling, Brain Struct. Funct., 220 (2015), 2073–2085. https://doi.org/10.1007/s00429-014-0770-4. doi: 10.1007/s00429-014-0770-4
|
| [51] |
L. Ottoboni, A. Merlini, G. Martino, Neural stem cell plasticity: advantages in therapy for the injured central nervous system, Front. Cell Dev. Biol., 5 (2017), 52. https://doi.org/10.3389/fcell.2017.00052. doi: 10.3389/fcell.2017.00052
|
| [52] |
Y. Guan, Z. Jiang, B. Ciric, A. M. Rostami, G. X. Zhang, Upregulation of chemokine receptor expression by il-10/il-4 in adult neural stem cells, Exp. Mol. Pathol., 85 (2008), 232–236. https://doi.org/10.1016/j.yexmp.2008.07.003. doi: 10.1016/j.yexmp.2008.07.003
|
| [53] |
D. Widera, W. Holtkamp, F. Entschladen, B. Niggemann, K. Zänker, B. Kaltschmidt, C. Kaltschmidt, Mcp-1 induces migration of adult neural stem cells, European J. Cell Biol., 83 (2004), 381–387. https://doi.org/10.1078/0171-9335-00403. doi: 10.1078/0171-9335-00403
|
| [54] |
K. Zhang, T. J. Sejnowski, A universal scaling law between gray matter and white matter of cerebral cortex, Proc. Natl. Acad. Sci., 97 (2000), 5621–5626. https://doi.org/10.1073/pnas.090504197. doi: 10.1073/pnas.090504197
|
| [55] |
M. Gutova, D. Shahmanyan, D. Oganesyan, Y. Abramyants, L. Danielyan, W. H. Frey, et al., Intranasal delivery of therapeutic neural stem cells to target intracerebral glioma, Enliven J. Stem Cell Res. Regen. Med., 1 (2015), 1–7. https://doi.org/10.1093/neuonc/nov204.29. doi: 10.1093/neuonc/nov204.29
|
| [56] |
N. Chuang, S. Mori, A. Yamamoto, H. Jiang, X. Ye, X. Xu, et al., An MRI-based atlas and database of the developing mouse brain, Neuroimage, 54 (2011), 80–89. https://doi.org/10.1016/j.neuroimage.2010.07.043. doi: 10.1016/j.neuroimage.2010.07.043
|
| [57] |
H. G. Othmer, S. R. Dunbar, W. Alt, Models of dispersal in biological systems, J. Math. Biol., 26 (1988), 263–298. https://doi.org/10.1007/BF00277392. doi: 10.1007/BF00277392
|
| [58] |
A. Stevens, H. G. Othmer, Aggregation, blowup, and collapse: the abc's of taxis in reinforced random walks, SIAM J. Appl. Math., 57 (1997), 1044–1081. https://doi.org/10.1137/S0036139995288976. doi: 10.1137/S0036139995288976
|
| [59] |
R. Erban, H. G. Othmer, From individual to collective behavior in bacterial chemotaxis, SIAM J. Appl. Math., 65 (2004), 361–391. https://doi.org/10.1137/S0036139903433232. doi: 10.1137/S0036139903433232
|
| [60] |
G, Danuser, J, Allard, A. Mogilner, Mathematical modeling of eukaryotic cell migration: insights beyond experiments, Ann. Rev. Cell Dev. Biol., 29 (2013), 501–528. https://doi.org/10.1146/annurev-cellbio-101512-122308. doi: 10.1146/annurev-cellbio-101512-122308
|
| [61] |
T. Hillen, M$^5$ mesoscopic and macroscopic models for mesenchymal motion, J. Math. Biol., 53 (2006), 585–616. https://doi.org/10.1007/s00285-006-0017-y. doi: 10.1007/s00285-006-0017-y
|
| [62] |
H. G. Othmer, T. Hillen, The diffusion limit of transport equations ii: Chemotaxis equations, SIAM J. Appl. Math., 62 (2002), 1222–1250. https://doi.org/10.1137/S0036139900382772. doi: 10.1137/S0036139900382772
|
| [63] |
E. Di Costanzo, R. Natalini, L. Preziosi, A hybrid mathematical model for self-organizing cell migration in the zebrafish lateral line, J. Math. Biol., 71 (2015), 171–214. https://doi.org/10.15252/embr.201439702. doi: 10.15252/embr.201439702
|
| [64] |
Y. Kim, H. Kang, G. Powathil, H. Kim, D. Trucu, W. Lee, et al., Role of extracellular matrix and microenvironment in regulation of tumor growth and LAR-mediated invasion in glioblastoma, PLoS One, 13 (2018), e0204865. https://doi.org/10.1371/journal.pone.0204865. doi: 10.1371/journal.pone.0204865
|
| [65] |
S. A. V. Mercedes, F. Bocci, H. Levine, J. Onuchic, M. K. Jolly, P. K. Wong, Decoding leader cells in collective cancer invasion, Nat. Rev. Cancer, 21 (2021), 592–604. https://doi.org/10.1038/s41568-021-00376-8. doi: 10.1038/s41568-021-00376-8
|
| [66] |
D. C. Markham, R. E. Baker, P. K. Maini, Modelling collective cell behaviour, Discrete Contin. Dyn. Syst., 34 (2014), 5123. https://doi.org/10.1098/rstb.2019.0377. doi: 10.1098/rstb.2019.0377
|
| [67] |
L. J. Schumacher, P. M. Kulesa, R. McLennan, R. E. Baker, P. K. Maini, Multidisciplinary approaches to understanding collective cell migration in developmental biology, Open Biol., 6 (2016), 160056. https://doi.org/10.1098/rsob.160056. doi: 10.1098/rsob.160056
|
| [68] |
R. McLennan, L. J. Schumacher, J. A. Morrison, J. M. Teddy, D. A. Ridenour, A. C. Box, et al., Neural crest migration is driven by a few trailblazer cells with a unique molecular signature narrowly confined to the invasive front, Development, 142 (2015), 2014–2025. https://doi.org/10.1242/dev.117507. doi: 10.1242/dev.117507
|
| [69] |
R. Gini$\overline{\rm{u}}$naitė, R. E. Baker, P. M. Kulesa, P. K. Maini, Modelling collective cell migration: neural crest as a model paradigm, J. Math. Biol., 80 (2020), 481–504. https://doi.org/10.1007/s00285-019-01436-2. doi: 10.1007/s00285-019-01436-2
|
Figures(10) / Tables(2)

Justin Gomez, Nathanael Holmes, Austin Hansen, Vikram Adhikarla, Margarita Gutova, Russell C. Rockne, Heyrim Cho. Mathematical modeling of therapeutic neural stem cell migration in mouse brain with and without brain tumors[J]. Mathematical Biosciences and Engineering, 2022, 19(3): 2592-2615. doi: 10.3934/mbe.2022119


 DownLoad: