Obesity and its related complications have become a pressing public health issue, requiring personalized nutritional and lifestyle interventions. Nutrigenetic diets utilize genetic information to tailor dietary recommendations based on an individual's genetic variations. This case-control study aimed to evaluate the impact of a nutrigenetic diet on weight loss and clinical parameters. Three groups were included: obese individuals following a nutrigenetic diet (n = 27), obese individuals following a generic diet (n = 23), and a control group of individuals with a normal body mass index (BMI) (n = 19). Based on polygenic risk scoring, personalized diet plans were developed that considered various genetic traits such as the impact of high amounts of protein on weight loss, the impact of low amounts of carbohydrates on weight loss, the risk of a high body fat percentage, the impact of a calorie restriction on weight loss, lactose intolerance, and gluten intolerance. By assessing a subject's risk scores, a personalized diet was created. Measurements taken at baseline and after four months included weight, BMI, body fat, lean mass, fasting blood sugar levels, total cholesterol, triglycerides, thyroid-stimulating hormone (TSH), triiodothyronine (T3), thyroxine (T4), and uric acid. Results showed significant differences favouring the nutrigenetic group in weight (p < 0.001), BMI (p < 0.001), and body fat percentage (p = 0.05) when compared to the control and the generic diet groups. Additionally, the nutrigenetic group exhibited significant improvements in triglycerides (p = 0.003). Moreover, the within-group effect among nutrigenetic subjects showed a significant weight reduction (p < 0.001), BMI (p < 0.001), body fat percentage (p < 0.001), fat mass (p < 0.001), fasting blood sugar level (p = 0.019), and uric acid (p = 0.042). These findings suggest that a nutrigenetic diet may yield more effective weight loss and improved clinical parameters compared to a generic diet.
Citation: Duraimani Shanthi Lakshmi, Sati Bhawna, Ahmed Khan Ghori Junaid, Selvanathan Abinaya, Saikia Katherine, Lote Ishita, Ahluwalia Geetika, Gosar Hetal, Dharmaraj Swetha, Bhatt Dhivya, Kocharekar Akshada, Salat Raunaq, Ramesh Aarthi, AR Balamurali, Ranganathan Rahul. Unlocking weight loss potential: Investigating the impact of personalized nutrigenetic-based diet in an Indian population[J]. AIMS Molecular Science, 2024, 11(1): 21-41. doi: 10.3934/molsci.2024002
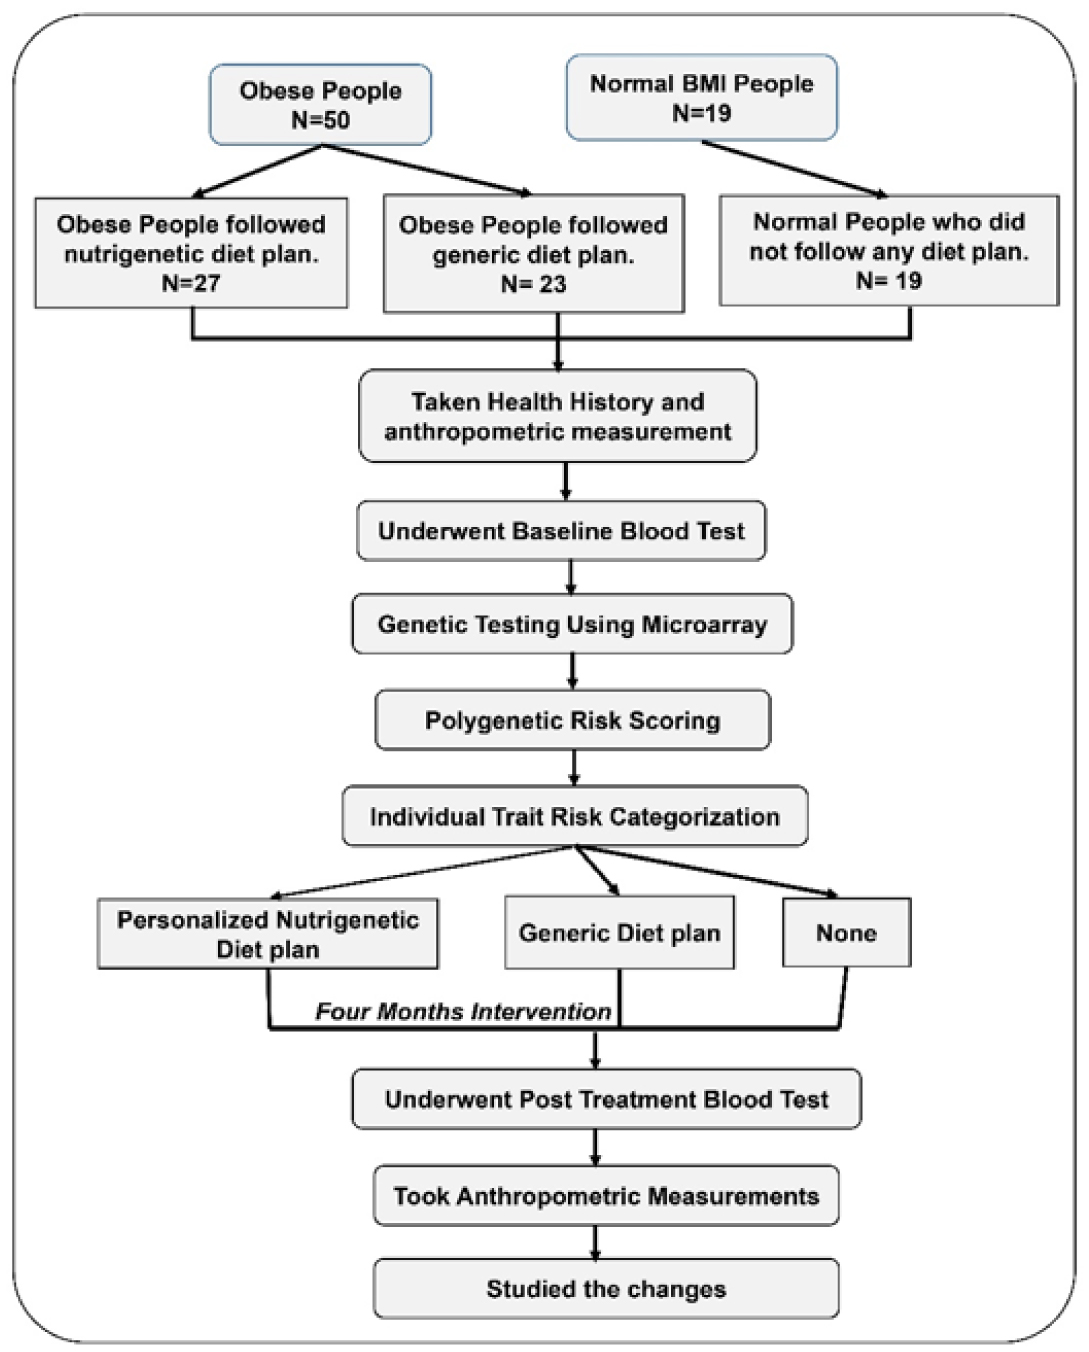
Obesity and its related complications have become a pressing public health issue, requiring personalized nutritional and lifestyle interventions. Nutrigenetic diets utilize genetic information to tailor dietary recommendations based on an individual's genetic variations. This case-control study aimed to evaluate the impact of a nutrigenetic diet on weight loss and clinical parameters. Three groups were included: obese individuals following a nutrigenetic diet (n = 27), obese individuals following a generic diet (n = 23), and a control group of individuals with a normal body mass index (BMI) (n = 19). Based on polygenic risk scoring, personalized diet plans were developed that considered various genetic traits such as the impact of high amounts of protein on weight loss, the impact of low amounts of carbohydrates on weight loss, the risk of a high body fat percentage, the impact of a calorie restriction on weight loss, lactose intolerance, and gluten intolerance. By assessing a subject's risk scores, a personalized diet was created. Measurements taken at baseline and after four months included weight, BMI, body fat, lean mass, fasting blood sugar levels, total cholesterol, triglycerides, thyroid-stimulating hormone (TSH), triiodothyronine (T3), thyroxine (T4), and uric acid. Results showed significant differences favouring the nutrigenetic group in weight (p < 0.001), BMI (p < 0.001), and body fat percentage (p = 0.05) when compared to the control and the generic diet groups. Additionally, the nutrigenetic group exhibited significant improvements in triglycerides (p = 0.003). Moreover, the within-group effect among nutrigenetic subjects showed a significant weight reduction (p < 0.001), BMI (p < 0.001), body fat percentage (p < 0.001), fat mass (p < 0.001), fasting blood sugar level (p = 0.019), and uric acid (p = 0.042). These findings suggest that a nutrigenetic diet may yield more effective weight loss and improved clinical parameters compared to a generic diet.

| [1] |
Ahirwar R, Mondal PR (2019) Prevalence of obesity in India: A systematic review. Diabetes Metab Synd 13: 318-321. https://doi.org/10.1016/j.dsx.2018.08.032 
|
| [2] |
Kalra S, Kapoor N, Verma M, et al. (2023) Defining and diagnosing obesity in India: A call for advocacy and action. J Obes 2023: 4178121. https://doi.org/10.1155/2023/4178121
|
| [3] |
Zhang X, Qi Q, Zhang C, et al. (2012) FTO genotype and 2-year change in body composition and fat distribution in response to weight-loss diets: the POUNDS LOST Trial. Diabetes 61: 3005-3011. https://doi.org/10.2337/db11-1799
|
| [4] |
Willer CJ, Speliotes EK, Loos RJF, et al. (2009) Six new loci associated with body mass index highlight a neuronal influence on body weight regulation. Nat Genet 41: 25-34. https://doi.org/10.1038/ng.287
|
| [5] |
Albuquerque D, Nóbrega C, Rodríguez-López R, et al. (2014) Association study of common polymorphisms in MSRA, TFAP2B, MC4R, NRXN3, PPARGC1A, TMEM18, SEC16B, HOXB5 and OLFM4 genes with obesity-related traits among Portuguese children. J Hum Genet 59: 307-313. https://doi.org/10.1038/jhg.2014.23
|
| [6] |
Burgdorf KS, Gjesing AP, Grarup N, et al. (2012) Association studies of novel obesity-related gene variants with quantitative metabolic phenotypes in a population-based sample of 6,039 Danish individuals. Diabetologia 55: 105-113. https://doi.org/10.1007/s00125-011-2320-4
|
| [7] |
Hong KW, Oh B (2012) Recapitulation of genome-wide association studies on body mass index in the Korean population. Int J Obes 36: 1127-1130. https://doi.org/10.1038/ijo.2011.202
|
| [8] | Jamshidi Y, Snieder H, Ge D, et al. (2007) The SH2B gene is associated with serum leptin and body fat in normal female twins. Obesity 15: 5-9. https://doi.org/10.1038/oby.2007.637 |
| [9] |
Kitamoto A, Kitamoto T, Mizusawa S, et al. (2013) NUDT3 rs206936 is associated with body mass index in obese Japanese women. Endocr J 60: 991-1000. https://doi.org/10.1507/endocrj.EJ13-0100
|
| [10] |
Kurokawa N, Young EH, Oka Y, et al. (2008) The ADRB3 Trp64Arg variant and BMI: A meta-analysis of 44 833 individuals. Int J Obes 32: 1240-1249. https://doi.org/10.1038/ijo.2008.90
|
| [11] |
Sandholt CH, Vestmar MA, Bille DS, et al. (2011) Studies of metabolic phenotypic correlates of 15 obesity associated gene variants. PloS One 6: e23531. https://doi.org/10.1371/journal.pone.0023531
|
| [12] |
Lim JU, Lee JH, Kim JS, et al. (2017) Comparison of world health organization and Asia-Pacific body mass index classifications in COPD patients. Int J Chron Obstruct Pulmon Dis 12: 2465-2475. https://doi.org/10.2147/COPD.S141295
|
| [13] | Nielsen DE, Shih S, El-Sohemy A (2014) Perceptions of genetic testing for personalized nutrition: A randomized trial of DNA-based dietary advice. J Nutrigenet Nutrigenomics 7: 94-104. https://doi.org/10.1159/000365508 |
| [14] |
Arkadianos I, Valdes AM, Marinos E, et al. (2007) Improved weight management using genetic information to personalize a calorie controlled diet. Nutr J 6: 29. https://doi.org/10.1186/1475-2891-6-29
|
| [15] |
Khera AV, Chaffin M, Aragam KG, et al. (2018) Genome-wide polygenic scores for common diseases identify individuals with risk equivalent to monogenic mutations. Nature Genet 50: 1219-1224. https://doi.org/10.1038/s41588-018-0183-z
|
| [16] |
Choi SW, Shin-Heng Mak T, O'Reilly PF (2020) Tutorial: A guide to performing polygenic risk score analyses. Nat Protoc 15: 2759-2772. https://doi.org/10.1038/s41596-020-0353-1
|
| [17] |
Horne JR, Gilliland JA, O'Connor CP, et al. (2020) Change in weight, BMI, and body composition in a population-based intervention versus genetic-based intervention: The NOW trial. Obesity 28: 1419-1427. https://doi.org/10.1002/oby.22880
|
| [18] |
Stookey JD, Constant F, Popkin BM, et al. (2008) Drinking water is associated with weight loss in overweight dieting women independent of diet and activity. Obesity 16: 2481-2488. https://doi.org/10.1038/oby.2008.409
|
| [19] | Talib SH, Bhattu S, Ali SA, et al. (2022) Efficacy of DNA-based customised diet and exercise plan for weight management. JIACM 23: 91-94. |
| [20] |
Merritt DC, Jamnik J, El-Sohemy A (2018) FTO genotype, dietary protein intake, and body weight in a multiethnic population of young adults: a cross-sectional study. Genes Nutr 13: 4. https://doi.org/10.1186/s12263-018-0593-7
|
| [21] |
Vimaleswaran KS, Bodhini D, Lakshmipriya N, et al. (2016) Interaction between FTO gene variants and lifestyle factors on metabolic traits in an Asian Indian population. Nutr Metab (Lond) 13: 39. https://doi.org/10.1186/s12986-016-0098-6
|
| [22] |
Kirac D, Kasimay Cakir O, Avcilar T, et al. (2016) Effects of MC4R, FTO, and NMB gene variants to obesity, physical activity, and eating behavior phenotypes. IUBMB Life 68: 806-816. https://doi.org/10.1002/iub.1558
|
| [23] |
Wing MR, Ziegler J, Langefeld CD, et al. (2009) Analysis of FTO gene variants with measures of obesity and glucose homeostasis in the IRAS family study. Hum Genet 125: 615-626. https://doi.org/10.1007/s00439-009-0656-3
|
| [24] |
Cuypers K, De Ridder K, Kvaløy K, et al. (2012) Leisure time activities in adolescence in the presence of susceptibility genes for obesity: risk or resilience against overweight in adulthood? The HUNT study. BMC Public Health 12: 820. https://doi.org/10.1186/1471-2458-12-820
|
| [25] |
Vimaleswaran KS, Li S, Zhao JH, et al. (2009) Physical activity attenuates the body mass index-increasing influence of genetic variation in the FTO gene. Am J Clin Nutr 90: 425-428. https://doi.org/10.3945/ajcn.2009.27652
|
| [26] |
Li S, Zhao JH, Luan J, et al. (2010) Physical activity attenuates the genetic predisposition to obesity in 20,000 men and women from EPIC-Norfolk prospective population study. PLoS Med 7: e1000332. https://doi.org/10.1371/journal.pmed.1000332
|
| [27] |
Trifonova EA, Popovich AA, Bocharova AV, et al. (2020) The role of natural selection in the formation of the genetic structure of populations by SNP markers in association with body mass index and obesity. Mol Biol (Mosk) 54: 398-411. https://doi.org/10.31857/S0026898420030179
|
| [28] |
Fesinmeyer MD, North KE, Ritchie MD, et al. (2013) Genetic risk factors for BMI and obesity in an ethnically diverse population: results from the population architecture using genomics and epidemiology (PAGE) study. Obesity 21: 835-846. https://doi.org/10.1002/oby.20268
|
| [29] |
Krishnan M, Shelling AN, Wall CR, et al. (2018) Gene-by-activity interactions on obesity traits of 6-year-old New Zealand European children: A children of SCOPE study. Pediatr Exerc Sci 30: 69-80. https://doi.org/10.1123/pes.2017-0077
|
| [30] |
Rana S, Bhatti AA (2021) Predicting anthropometric and metabolic traits with a genetic risk score for obesity in a sample of Pakistanis. Sci Rep 11: 8320. https://doi.org/10.1038/s41598-021-87702-0
|
| [31] |
Antonio J, Knafo S, Kapoor R, et al. (2018) A fat mass and obesity-associated gene polymorphism influences fat mass in exercise-trained individuals. J Int Soc Sports Nutr 15: 40. https://doi.org/10.1186/s12970-018-0246-7
|
| [32] |
Katus U, Villa I, Ringmets I, et al. (2020) Association of FTO rs1421085 with obesity, diet, physical activity, and socioeconomic status: A longitudinal birth cohort study. Nutr Metab Cardiovasc Dis 30: 948-959. https://doi.org/10.1016/j.numecd.2020.02.008
|
| [33] |
Abadi A, Alyass A, Robiou du Pont S, et al. (2017) Penetrance of polygenic obesity susceptibility loci across the body mass index distribution. Am J Hum Genet 101: 925-938. https://doi.org/10.1016/j.ajhg.2017.10.007
|
| [34] |
Chang YC, Liu PH, Lee WJ, et al. (2008) Common variation in the fat mass and obesity-associated (FTO) gene confers risk of obesity and modulates BMI in the Chinese population. Diabetes 57: 2245-2252. https://doi.org/10.2337/db08-0377
|
| [35] |
Saber-Ayad M, Manzoor S, Radwan H, et al. (2019) The FTO genetic variants are associated with dietary intake and body mass index amongst Emirati population. PLoS One 14: e0223808. https://doi.org/10.1371/journal.pone.0223808
|
| [36] | Wei BL, Yin RX, Liu CX, et al. (2020) The MC4R SNPs, their haplotypes and gene-environment interactions on the risk of obesity. Mol Med 26: 77. https://doi.org/10.1186/s10020-020-00202-1 |
| [37] |
Liu JZ, Medland SE, Wright MJ, et al. (2010) Genome-wide association study of height and body mass index in Australian twin families. Twin Res Hum Genet 13: 179-193. https://doi.org/10.1375/twin.13.2.179
|
| [38] |
Xi B, Shen Y, Reilly KH, et al. (2013) Sex-dependent associations of genetic variants identified by GWAS with indices of adiposity and obesity risk in a Chinese children population. Clin Endocrinol (Oxf) 79: 523-528. https://doi.org/10.1111/cen.12091
|
| [39] |
Sandholt CH, Vestmar MA, Bille DS, et al. (2011) Studies of metabolic phenotypic correlates of 15 obesity associated gene variants. PLoS One 6: e23531. https://doi.org/10.1371/journal.pone.0023531
|
| [40] |
Cotsapas C, Speliotes EK, Hatoum IJ, et al. (2009) Common body mass index-associated variants confer risk of extreme obesity. Hum Mol Genet 18: 3502-3507. https://doi.org/10.1093/hmg/ddp292
|
| [41] |
Xi B, Cheng H, Shen Y, et al. (2013) Study of 11 BMI-associated loci identified in GWAS for associations with central obesity in Chinese children. PLoS One 8: e56472. https://doi.org/10.1371/journal.pone.0056472
|
| [42] |
Burgdorf KS, Gjesing AP, Grarup N, et al. (2012) Association studies of novel obesity-related gene variants with quantitative metabolic phenotypes in a population-based sample of 6,039 Danish individuals. Diabetologia 55: 105-113. https://doi.org/10.1007/s00125-011-2320-4
|
| [43] |
Wang HY, Chang SC, Lin WY, et al. (2018) Machine learning-based method for obesity risk evaluation using single-nucleotide polymorphisms derived from next-generation sequencing. J Comput Biol 25: 1347-1360. https://doi.org/10.1089/cmb.2018.0002
|
| [44] |
Willer CJ, Speliotes EK, Loos RJ, et al. (2009) Six new loci associated with body mass index highlight a neuronal influence on body weight regulation. Nat Genet 41: 25-34. https://doi.org/10.1038/ng.287
|
| [45] |
Paternoster L, Evans DM, Nohr EA, et al. (2011) Genome-wide population-based association study of extremely overweight young adults—The GOYA study. PLoS One 6: e24303. https://doi.org/10.1371/journal.pone.0024303
|
| [46] |
Hong KW, Oh B (2012) Recapitulation of genome-wide association studies on body mass index in the Korean population. Int J Obes 36: 1127-1130. https://doi.org/10.1038/ijo.2011.202
|
| [47] |
Costa-Urrutia P, Abud C, Franco-Trecu V, et al. (2020) Effect of 15 BMI-associated polymorphisms, reported for Europeans, across Ethnicities and degrees of Amerindian ancestry in Mexican children. Int J Mol Sci 21: 374. https://doi.org/10.3390/ijms21020374
|
| [48] |
Rana S, Sultana A (2020) Association of the variant rs7561317 Downstream of the TMEM18 gene with overweight/obesity and related anthropometric traits in a sample of Pakistani population. Biochem Genet 58: 257-278. https://doi.org/10.1007/s10528-019-09940-2
|
| [49] |
Hotta K, Nakamura M, Nakamura T, et al. (2009) Association between obesity and polymorphisms in SEC16B, TMEM18, GNPDA2, BDNF, FAIM2, and MC4R in a Japanese population. J Hum Genet 54: 727-731. https://doi.org/10.1038/jhg.2009.106
|
| [50] |
Albayrak Ö, Pütter C, Volckmar AL, et al. (2013) Psychiatric GWAS Consortium: ADHD Subgroup. (2013) Common obesity risk alleles in childhood attention-deficit/hyperactivity disorder. Am J Med Genet B Neuropsychiatr Genet 162: 295-305. https://doi.org/10.1002/ajmg.b.32144
|
| [51] |
Kitamoto A, Kitamoto T, Mizusawa S, et al. (2013) NUDT3 rs206936 is associated with body mass index in obese Japanese women. Endocr J 60: 991-1000. https://doi.org/10.1507/endocrj.ej13-0100
|
| [52] |
Albuquerque D, Nóbrega C, Rodríguez-López R, et al. (2014) Association study of common polymorphisms in MSRA, TFAP2B, MC4R, NRXN3, PPARGC1A, TMEM18, SEC16B, HOXB5, and OLFM4 genes with obesity-related traits among Portuguese children. J Hum Genet 59: 307-313. https://doi.org/10.1038/jhg.2014.23
|
| [53] |
Kurokawa N, Young EH, Oka Y, et al. (2008) The ADRB3 Trp64Arg variant and BMI: A meta-analysis of 44,833 individuals. Int J Obes (Lond) 32: 1240-1249. https://doi.org/10.1038/ijo.2008.90
|
| [54] |
Daghestani M, Daghestani M, Daghistani M, et al. (2018) ADRB3 polymorphism rs4994 (Trp64Arg) associates significantly with bodyweight elevation and dyslipidaemias in Saudis but not rs1801253 (Arg389Gly) polymorphism in ARDB1. Lipids Health Dis 17: 58. https://doi.org/10.1186/s12944-018-0679-7
|
| [55] |
Kim-Motoyama H, Yasuda K, Yamaguchi T, et al. (1997) A mutation of the beta 3-adrenergic receptor is associated with visceral obesity but decreased serum triglyceride. Diabetologia 40: 469-472. https://doi.org/10.1007/s001250050702
|
| [56] |
de Luis DA, Izaola O, Primo D, et al. (2018) The association of SNP276G>T at adiponectin gene with insulin resistance and circulating adiponectin in response to two different hypocaloric diets. Diabetes Res Clin Pract 137: 93-99. https://doi.org/10.1016/j.diabres.2018.01.003
|
| [57] |
Tan PY, Mitra SR, Amini F (2018) Lifestyle interventions for weight control modified by genetic variation: A review of the evidence. Public Health Genomics 21: 169-185. https://doi.org/10.1159/000499854
|
| [58] |
Laaksonen MML, Mikkilä V, Räsänen L, et al. (2009) Genetic lactase non-persistence, consumption of milk products and intakes of milk nutrients in Finns from childhood to young adulthood. Brit J Nutr 102: 8-17. https://doi.org/10.1017/S0007114508184677
|
| [59] |
Araujo EM, Dos Santos L, Coutinho R, et al. (2019) Genetic and oral tests for the diagnosis of lactose intolerance in mixed-ancestry Brazilians with metabolic syndrome. Lifestyle Genom 12: 1-9. https://doi.org/10.1159/000501690
|
| [60] |
Fernández CI, Montalva N, Arias M, et al. (2016) Lactase non-persistence and general patterns of dairy intake in indigenous and mestizo Chilean populations. Am J Hum Biol 28: 213-219. https://doi.org/10.1002/ajhb.22775
|
| [61] |
Amundsen SS, Rundberg J, Adamovic S, et al. (2010) Four novel coeliac disease regions replicated in an association study of a Swedish-Norwegian family cohort. Genes Immun 11: 79-86. https://doi.org/10.1038/gene.2009.67
|
| [62] |
Dubois PCA, Trynka G, Franke L, et al. (2010) Multiple common variants for celiac disease influencing immune gene expression. Nat Genet 42: 295-302. https://doi.org/10.1038/ng.543
|
| [63] |
Adamovic S, Amundsen SS, Lie BA, et al. (2008) Association study of IL2/IL21 and FcgRIIa: Significant association with the IL2/IL21 region in Scandinavian coeliac disease families. Genes Immun 9: 364-367.
|
| [64] |
Glas J, Stallhofer J, Ripke S, et al. (2009) Novel genetic risk markers for ulcerative colitis in the IL2/IL21 region are in epistasis with IL23R and suggest a common genetic background for ulcerative colitis and celiac disease. Am J Gastroenterol 104: 1737-1744. https://doi.org/10.1038/ajg.2009.163
|
| [65] |
Hunt KA, Zhernakova A, Turner G, et al. (2008) Newly identified genetic risk variants for celiac disease related to the immune response. Nat Genet 40: 395-402. https://doi.org/10.1038/ng.102
|
| [66] |
Garner CP, Murray JA, Ding YC, et al. (2009) Replication of celiac disease UK genome-wide association study results in a US population. Hum Mol Genet 18: 4219-4225. https://doi.org/10.1093/hmg/ddp364
|
| [67] |
Sperandeo MP, Tosco A, Izzo V, et al. (2011) Potential celiac patients: A model of celiac disease pathogenesis. PLoS One 6: e21281. https://doi.org/10.1371/journal.pone.0021281
|
| [68] |
Izzo V, Pinelli M, Tinto N, et al. (2011) Improving the estimation of celiac disease sibling risk by non-HLA genes. PLoS One 6: e26920. https://doi.org/10.1371/journal.pone.0026920
|
| [69] |
Adamovic S, Amundsen SS, Lie BA, et al. (2008) Association study of IL2/IL21 and FcgRIIa: Significant association with the IL2/IL21 region in Scandinavian coeliac disease families. Genes Immun 9: 364-367. https://doi.org/10.1038/gene.2008.27
|
| [70] |
Monsuur AJ, de Bakker PIW, Zhernakova A, et al. (2008) Effective detection of human leukocyte antigen risk alleles in celiac disease using tag single nucleotide polymorphisms. PLoS One 3: e2270. https://doi.org/10.1371/journal.pone.0002270
|
| [71] |
Rostami-Nejad M, Romanos J, Rostami K, et al. (2014) Allele and haplotype frequencies for HLA-DQ in Iranian celiac disease patients. World J Gastroenterol 20: 6302-6308. https://doi.org/10.3748/wjg.v20.i20.6302
|
| [72] |
Zhernakova A, Stahl EA, Trynka G, et al. (2011) Meta-analysis of genome-wide association studies in celiac disease and rheumatoid arthritis identifies fourteen non-HLA shared loci. PLoS Genet 7: e1002004. https://doi.org/10.1371/journal.pgen.1002004
|
| [73] |
Östensson M, Montén C, Bacelis J, et al. (2013) A possible mechanism behind autoimmune disorders discovered by genome-wide linkage and association analysis in celiac disease. PLoS One 8: e70174. https://doi.org/10.1371/journal.pone.0070174
|
| [74] |
Senapati S, Sood A, Midha V, et al. (2016) Shared and unique common genetic determinants between pediatric and adult celiac disease. BMC Med Genomics 9: 44. https://doi.org/10.1186/s12920-016-0211-8
|
| [75] |
Walker MM, Murray JA, Ronkainen J, et al. (2010) Detection of celiac disease and lymphocytic enteropathy by parallel serology and histopathology in a population-based study. Gastroenterology 139: 112-119. https://doi.org/10.1053/j.gastro.2010.04.007
|
 molsci-11-01-002-s001.pdf molsci-11-01-002-s001.pdf |
 |
Figures(1) / Tables(6)

Duraimani Shanthi Lakshmi, Sati Bhawna, Ahmed Khan Ghori Junaid, Selvanathan Abinaya, Saikia Katherine, Lote Ishita, Ahluwalia Geetika, Gosar Hetal, Dharmaraj Swetha, Bhatt Dhivya, Kocharekar Akshada, Salat Raunaq, Ramesh Aarthi, AR Balamurali, Ranganathan Rahul. Unlocking weight loss potential: Investigating the impact of personalized nutrigenetic-based diet in an Indian population[J]. AIMS Molecular Science, 2024, 11(1): 21-41. doi: 10.3934/molsci.2024002


 DownLoad: