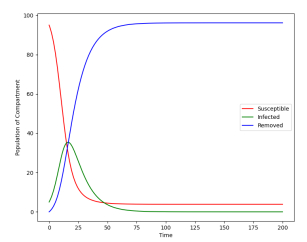
Traditional compartmental models describe the evolution of a virus over a population of nodes; one common model separates the population into compartments of susceptible, infected, and removed nodes. More complex bi-virus models describe this evolution for two competing viruses in the same population, having an additional parameter known as the virus interaction factor, which defines the effect one virus has on the rate of infection of another. Although these models are generally used in the context of infectious diseases, they could also describe the spread of ideas, or competing products in a market of consumers. In this paper, a new model was proposed that added separate interaction factors for each virus, differentiating the effects of viruses on one another. Adding this additional parameter will allow for more accurate interactions to be modeled and analyzed. A focus was placed on the limiting behavior of this model, an eventual end-state equilibrium where the number of nodes in each compartment remains constant. Relationships between the virus interaction factors and the strengths of the viruses on the limiting behavior were identified. Finally, a complete numerical solution to the model and a condition for real-valued limiting behaviors was calculated and tested against the simulation data.
Citation: Benjamin Zhang. Limiting behaviors of a bi-virus model with two interaction factors[J]. Mathematical Modelling and Control, 2024, 4(1): 64-70. doi: 10.3934/mmc.2024006
Traditional compartmental models describe the evolution of a virus over a population of nodes; one common model separates the population into compartments of susceptible, infected, and removed nodes. More complex bi-virus models describe this evolution for two competing viruses in the same population, having an additional parameter known as the virus interaction factor, which defines the effect one virus has on the rate of infection of another. Although these models are generally used in the context of infectious diseases, they could also describe the spread of ideas, or competing products in a market of consumers. In this paper, a new model was proposed that added separate interaction factors for each virus, differentiating the effects of viruses on one another. Adding this additional parameter will allow for more accurate interactions to be modeled and analyzed. A focus was placed on the limiting behavior of this model, an eventual end-state equilibrium where the number of nodes in each compartment remains constant. Relationships between the virus interaction factors and the strengths of the viruses on the limiting behavior were identified. Finally, a complete numerical solution to the model and a condition for real-valued limiting behaviors was calculated and tested against the simulation data.

| [1] | F. Brauer, Compartmental models in epidemiology, In: F. Brauer, P. Driessche, J. Wu, Mathematical epidemiology, 3 Eds., Berlin: Springer, 1945, 19–79. https://doi.org/10.1007/978-3-540-78911-6_2 |
| [2] | E. Kuhl, The classical SIS model, In: Computational epidemiology, 3 Eds., Switzerland: Springer, Cham, 2021. https://doi.org/10.1007/978-3-030-82890-5_2 |
| [3] | A. Beutel, A. Prakash, R. Rosenfeld, C. Faloutsos, Interacting viruses in networks: can both survive? KDD '12: Proceedings of the 18th ACM SIGKDD International Conference on Knowledge Discovery and Data Mining, 2012,426–434. https://doi.org/10.1145/2339530.2339601 |
| [4] | K. Servick, How will COVID-19 affect the coming flu season? Scientists struggle for clues, Science, 2020. Available from: https://www.science.org/content/article/how-will-covid-19-affect-coming-flu-season-scientists-struggle-clues |
| [5] |
J. Liu, P. E. Paré, A. Nedić, C. Y. Tang, C. L. Beck, Analysis and control of a continuous-time bi-virus model, IEEE Trans. Autom. Control, 64 (2019), 4891–4906. https://doi.org/10.1109/TAC.2019.2898515 doi: 10.1109/TAC.2019.2898515

|


Figures(8) / Tables(1)
Benjamin Zhang. Limiting behaviors of a bi-virus model with two interaction factors[J]. Mathematical Modelling and Control, 2024, 4(1): 64-70. doi: 10.3934/mmc.2024006


 DownLoad: