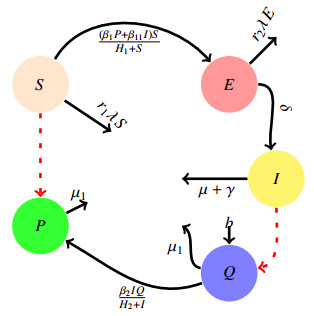
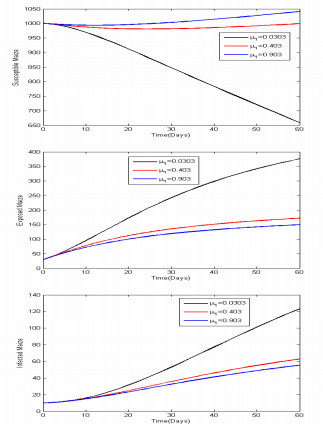
In this paper, a deterministic ordinary differential equations model for the transmission dynamics of maize streak virus disease (MSVD) in maize plants is proposed and analyzed qualitatively. Using the next generation matrix approach, the basic reproduction number, $ \mathcal{R}_{0} $ with respect to the MSVD free equilibrium is found to be $ 4.7065\approx5 $. The conditions for local stability of the disease-free equilibrium and endemic equilibrium points were established. From the results, the disease-free equilibrium point was found to be unstable whenever $ \mathcal{R}_{0} > 1 $ and the endemic equilibrium point was found to be locally asymptotically stable whenever $ \mathcal{R}_{0} > 1 $. The sensitivity indices of various parameters with respect to the MSVD eradication or spreading were determined. It was found that $ b\; , \beta_{{1}}\; , \beta_{{11}}\; , $ and $ \beta_{{2}} $ are the parameters that are directly related to $ \mathcal{R}_{0} $, and $ H_{2}, \mu, \mu_{{1}} $ and $ \gamma $ are inversely related to $ \mathcal{R}_{0} $. Numerical simulation was performed and displayed graphically to justify the analytical results.
Citation: Abdul-Fatawu O. Ayembillah, Baba Seidu, C. S. Bornaa. Mathematical modeling of the dynamics of maize streak virus disease (MSVD)[J]. Mathematical Modelling and Control, 2022, 2(4): 153-164. doi: 10.3934/mmc.2022016
In this paper, a deterministic ordinary differential equations model for the transmission dynamics of maize streak virus disease (MSVD) in maize plants is proposed and analyzed qualitatively. Using the next generation matrix approach, the basic reproduction number, $ \mathcal{R}_{0} $ with respect to the MSVD free equilibrium is found to be $ 4.7065\approx5 $. The conditions for local stability of the disease-free equilibrium and endemic equilibrium points were established. From the results, the disease-free equilibrium point was found to be unstable whenever $ \mathcal{R}_{0} > 1 $ and the endemic equilibrium point was found to be locally asymptotically stable whenever $ \mathcal{R}_{0} > 1 $. The sensitivity indices of various parameters with respect to the MSVD eradication or spreading were determined. It was found that $ b\; , \beta_{{1}}\; , \beta_{{11}}\; , $ and $ \beta_{{2}} $ are the parameters that are directly related to $ \mathcal{R}_{0} $, and $ H_{2}, \mu, \mu_{{1}} $ and $ \gamma $ are inversely related to $ \mathcal{R}_{0} $. Numerical simulation was performed and displayed graphically to justify the analytical results.

| [1] |
I. F. B. Council, Safety evaluation of foods and food ingredients derived from microorganisms, Regul. Toxicol. Pharm., 12 (1990), 114–128. http://doi.org/10.1016/S0273-2300(05)80080-7 doi: 10.1016/S0273-2300(05)80080-7

|
| [2] |
D. N. Shepherd, D. P. Martin, E. Van der Walt, K. Dent, A. Varsani, E. P. Rybicki, Maize streak virus: an old and complex 'emerging' pathogen, Mol. Plant Pathol., 11 (2010), 1–12. http://doi.org/10.1111/j.1364-3703.2009.00568.x doi: 10.1111/j.1364-3703.2009.00568.x
|
| [3] |
M. Jackson, B. M. Chen-Charpentier, Modeling plant virus propagation with delays, J. Comput. Appl. Math., 309 (2017), 611–621. http://doi.org/10.1016/j.cam.2016.04.024 doi: 10.1016/j.cam.2016.04.024
|
| [4] | ASABE, Maize in Ghana: An overview of cultivation to processing, in: 2016 ASABE International Meeting, American Society of Agricultural and Biological Engineers, 2016. http://doi.org/10.13031/aim.20162460492. |
| [5] | P. Protection, Regulatory services directorate–ministry of food and agriculture (pprsd-mofa), Pesticide dealers' handbook, 2000. |
| [6] | CABI, Invasive species compendium: datasheet report for maize streak virus (streak disease of maize)-detailed coverage of invasive species threatening livelihoods and the environment worldwide. |
| [7] | M. Mayo, C. Pringle, Virus taxonomy-1997, J. Gen. Virol., 79 (1998), 649–657. |
| [8] | S. G. Lazarowitz, R. Shepherd, Geminiviruses: genome structure and gene function, Crit. Rev. Plant Sci., 11 (1992), 327–349. |
| [9] | K. E. Palmer, E. P. Rybicki, The molecular biology of mastreviruses, Adv. virus res., 50 (1998), 183–234. |
| [10] | A. Oppong, D. A. Kubi, B. E. Ifie, L. A. Abrokwah, K. Ofori, S. K. Offei, et al., Analyzing combining abilities and heterotic groups among ghanaian maize landraces for yield and resistance/tolerance to maize streak virus disease, Maydica, 64 (2020), 10. |
| [11] | S. S. Gnanamanickam, Biological control of crop diseases, Marcel Dekker, Inc, New York, 2002. |
| [12] | G. Loebenstein, Control of plant virus diseases : seed-propagated crops, Elsevier, Waltham, Massachusetts, 2014. |
| [13] |
R. Shi, H. Zhao, S. Tang, Global dynamic analysis of a vector-borne plant disease model, Advances in Difference Equations, 59 (2014), 1–16. http://doi.org/10.1186/1687-1847-2014-59 doi: 10.1186/1687-1847-2014-59
|
| [14] |
H. T. Alemneh, O. D. Makinde, D. M. Theuri, Ecoepidemiological model and analysis of MSV disease transmission dynamics in maize plant, International Journal of Mathematics and Mathematical Sciences, 2019 (2019), 1–14. http://doi.org/10.1155/2019/7965232 doi: 10.1155/2019/7965232
|
| [15] |
H. T. Alemneh, O. D. Makinde, D. M. Theuri, Optimal control model and cost effectiveness analysis of maize streak virus pathogen interaction with pest invasion in maize plant, Egyptian Journal of Basic and Applied Sciences, 7 (2020), 180–193. http://doi.org/10.1080/2314808x.2020.1769303 doi: 10.1080/2314808x.2020.1769303
|
| [16] | H. T. Alemneh, A. S. Kassa, A. A. Godana, An optimal control model with cost effectiveness analysis of maize streak virus disease in maize plant, Infectious Disease Modelling, 6 (2021), 169–182. |
| [17] | Seidu, Baba and Asamoah, Joshua Kiddy K and Wiah, Eric Neebo and Ackora-Prah, Joseph, A comprehensive cost-effectiveness analysis of control of maize streak virus disease with Holling's Type II predation form and standard incidence, Results in Physics, (2022) |
| [18] | P. Van den Driessche, J. Watmough, Further notes on the basic reproduction number, Mathematical epidemiology, (2008), 159–178. http://doi.org/10.1007/978-3-540-78911-6_6 |
| [19] | T. Kinene, L. S. Luboobi, B. Nannyonga, G. G. Mwanga, A mathematical model for the dynamics and cost effectiveness of the current controls of cassava brown streak disease in uganda, J. Math. Comput. Sci., 5 (2015), 567–600. http://scik.org/index.php/jmcs/article/viewFile/2185/1159 |


Figures(8) / Tables(2)
Abdul-Fatawu O. Ayembillah, Baba Seidu, C. S. Bornaa. Mathematical modeling of the dynamics of maize streak virus disease (MSVD)[J]. Mathematical Modelling and Control, 2022, 2(4): 153-164. doi: 10.3934/mmc.2022016


 DownLoad: