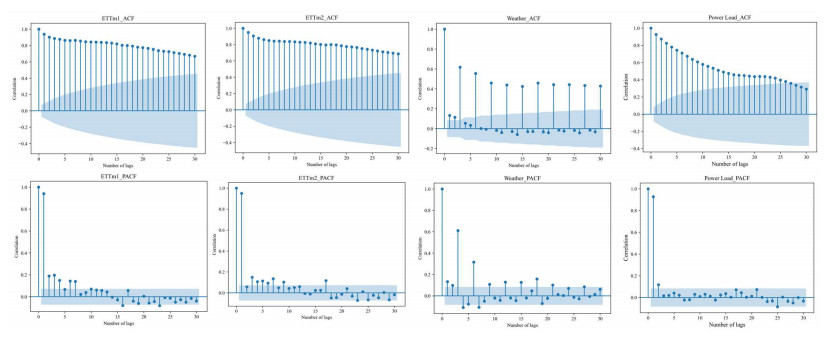
An accurate ultra-short-term time series prediction of a power load is an important guarantee for power dispatching and the safe operation of power systems. Problems of the current ultra-short-term time series prediction algorithms include low prediction accuracy, difficulty capturing the local mutation features, poor stability, and others. From the perspective of series decomposition, a multi-scale sequence decomposition model (TFDNet) based on power spectral density and the Morlet wavelet transform is proposed that combines the multidimensional correlation feature fusion strategy in the time and frequency domains. By introducing the time-frequency energy selection module, the "prior knowledge" guidance module, and the sequence denoising decomposition module, the model not only effectively delineates the global trend and local seasonal features, completes the in-depth information mining of the smooth trend and fluctuating seasonal features, but more importantly, realizes the accurate capture of the local mutation seasonal features. Finally, on the premise of improving the forecasting accuracy, single-point load forecasting and quantile probabilistic load forecasting for ultra-short-term load forecasting are realized. Through the experiments conducted on three public datasets and one private dataset, the TFDNet model reduces the mean square error (MSE) and mean absolute error (MAE) by 19.80 and 11.20% on average, respectively, as compared with the benchmark method. These results indicate the potential applications of the TFDNet model.
Citation: Lihe Liang, Jinying Cui, Juanjuan Zhao, Yan Qiang, Qianqian Yang. Ultra-short-term forecasting model of power load based on fusion of power spectral density and Morlet wavelet[J]. Mathematical Biosciences and Engineering, 2024, 21(2): 3391-3421. doi: 10.3934/mbe.2024150
An accurate ultra-short-term time series prediction of a power load is an important guarantee for power dispatching and the safe operation of power systems. Problems of the current ultra-short-term time series prediction algorithms include low prediction accuracy, difficulty capturing the local mutation features, poor stability, and others. From the perspective of series decomposition, a multi-scale sequence decomposition model (TFDNet) based on power spectral density and the Morlet wavelet transform is proposed that combines the multidimensional correlation feature fusion strategy in the time and frequency domains. By introducing the time-frequency energy selection module, the "prior knowledge" guidance module, and the sequence denoising decomposition module, the model not only effectively delineates the global trend and local seasonal features, completes the in-depth information mining of the smooth trend and fluctuating seasonal features, but more importantly, realizes the accurate capture of the local mutation seasonal features. Finally, on the premise of improving the forecasting accuracy, single-point load forecasting and quantile probabilistic load forecasting for ultra-short-term load forecasting are realized. Through the experiments conducted on three public datasets and one private dataset, the TFDNet model reduces the mean square error (MSE) and mean absolute error (MAE) by 19.80 and 11.20% on average, respectively, as compared with the benchmark method. These results indicate the potential applications of the TFDNet model.

| [1] |
A. Haque, S. Rahman, Short-term electrical load forecasting through heuristic configuration of regularized deep neural network, Appl. Soft Comput., 122 (2022), 108877. https://doi.org/10.1016/j.asoc.2022.108877 doi: 10.1016/j.asoc.2022.108877

|
| [2] |
J. Ma, M. Yang, X. Han, Z. Li, Ultra-short-term wind generation forecast based on multivariate empirical dynamic modeling, IEEE Trans. Ind. Appl., 54 (2017), 1029–1038. https://doi.org/10.1109/TIA.2017.2782207 doi: 10.1109/TIA.2017.2782207
|
| [3] |
Y. Dai, X. Yang, M. Leng, Forecasting power load: A hybrid forecasting method with intelligent data processing and optimized artificial intelligence, Technol. Forecast. Soc. Change, 182 (2022), 121858. https://doi.org/10.1109/TIA.2017.2782207 doi: 10.1109/TIA.2017.2782207
|
| [4] |
R. Ospina, A. Gondim, V. Leiva, C Castro, An overview of forecast analysis with ARIMA models during the COVID-19 pandemic: Methodology and case study in Brazil, Mathematics, 11 (2023), 3069. https://doi.org/10.3390/math11143069 doi: 10.3390/math11143069
|
| [5] |
F. Yuan, Z. Zhang, Z. Fang, An effective CNN and Transformer complementary network for medical image segmentation, Pattern Recognit., 136 (2023), 109228. https://doi.org/10.1016/j.patcog.2022.109228 doi: 10.1016/j.patcog.2022.109228
|
| [6] |
M. Saraswat, Srishti, Leveraging genre classification with RNN for Book recommendation, Int. J. Inf. Technol., 14 (2022), 3751–3756. https://doi.org/10.1007/s41870-022-00937-6 doi: 10.1007/s41870-022-00937-6
|
| [7] |
D. Salinas, V. Flunkert, J. Gasthaus, T. Januschowski, DeepAR: Probabilistic forecasting with autoregressive recurrent networks, Int. J. Forecast., 36 (2020), 1181–1191. https://doi.org/10.1016/j.ijforecast.2019.07.001 doi: 10.1016/j.ijforecast.2019.07.001
|
| [8] |
W. Zha, Y. Liu, Y. Wan, R. Luo, D. Li, S. Yang, et al., Forecasting monthly gas field production based on the CNN-LSTM model, Energy, 260 (2022), 124889. https://doi.org/10.1016/j.energy.2022.124889 doi: 10.1016/j.energy.2022.124889
|
| [9] |
Y. Wang, L. Rui, J. Ma, A short-term residential load forecasting scheme based on the multiple correlation-temporal graph neural networks, Appl. Soft Comput., 146 (2023), 110629. https://doi.org/10.1016/j.asoc.2023.110629 doi: 10.1016/j.asoc.2023.110629
|
| [10] | B. Tang, D. S. Matteson, Probabilistic transformer for time series analysis, Adv. Neural Inf. Process. Syst., 34 (2021), 23592–23608. |
| [11] | S. Li, X. Jin, Y. Xuan, X. Zhou, W. Chen, Y. X. Wang, et al., Enhancing the locality and breaking the memory bottleneck of transformer on time series forecasting, in Advances in Neural Information Processing Systems 32 (NeurIPS 2019), 2019. |
| [12] | N. Kitaev, L. Kaiser, A. Levskaya, Reformer: The efficient transformer, preprint, arXiv: 200104451. |
| [13] | H. Zhou, S. Zhang, J. Peng, S. Zhang, J. Li, H. Xiong, et al., Informer: Beyond efficient transformer for long sequence time-series forecasting, in Proceedings of the AAAI Conference on Artificial Intelligence, (2021), 11106–11115. https://doi.org/10.1609/aaai.v35i12.17325 |
| [14] | H. Wu, J. Xu, J. Wang, M. Long, Autoformer: Decomposition transformers with auto-correlation for long-term series forecasting, in Advances in Neural Information Processing Systems, (2021), 22419–22430. |
| [15] | T. Zhou, Z. Ma, Q. Wen, X. Wang, L. Sun, R. Jin, Fedformer: Frequency enhanced decomposed transformer for long-term series forecasting, in Proceedings of the 39th International Conference on Machine Learning, (2022), 27268–27286. |
| [16] | H. Wu, T. Hu, Y. Liu, H. Zhou, J. Wang, M. Long, TimesNet: Temporal 2D-variation modeling for general time series analysis, preprint, arXiv: 221002186. |
| [17] |
F. Yang, X. Fu, Q. Yang, Z. Chu, Decomposition strategy and attention-based long short-term memory network for multi-step ultra-short-term agricultural power load forecasting, Expert Syst. Appl., 238 (2024), 122226. https://doi.org/10.1016/j.eswa.2023.122226 doi: 10.1016/j.eswa.2023.122226
|
| [18] |
T. Donoghue, M. Haller, E. J. Peterson, P. Varma, P. Sebastian, R. Gao, et al., Parameterizing neural power spectra into periodic and aperiodic components, Nat. Neurosci., 23 (2020), 1655–1665. https://doi.org/10.1038/s41593-020-00744-x doi: 10.1038/s41593-020-00744-x
|
| [19] | H. Huang, L. Lin, R. Tong, H. Hu, Q. Zhang, Y. Iwamoto, et al., Unet 3+: A full-scale connected unet for medical image segmentation, in ICASSP 2020-2020 IEEE International Conference on Acoustics, Speech and Signal Processing (ICASSP), 2020, 1055–1059. https://doi.org/10.1109/ICASSP40776.2020.9053405 |
| [20] | T. Y. Lin, P. Dollár, R. Girshick, K. He, B. Hariharan, S. Belongie, Feature pyramid networks for object detection, in Proceedings of the IEEE Conference on Computer Vision and Pattern Recognition (CVPR), (2017), 2117–2125. |
| [21] |
B. H. Chen, Y. S. Tseng, J. L. Yin, Gaussian-adaptive bilateral filter, IEEE Signal Process. Lett., 27 (2020), 1670–1674. https://doi.org/10.1109/LSP.2020.3024990 doi: 10.1109/LSP.2020.3024990
|
| [22] |
Z. Ni, C. Zhang, M. Karlsson, S. Gong, A study of deep learning-based multi-horizon building energy forecasting, Energy Build., 203 (2024), 113810. https://doi.org/10.1016/j.enbuild.2023.113810 doi: 10.1016/j.enbuild.2023.113810
|
| [23] |
J. R. Lanzante, Testing for differences between two distributions in the presence of serial correlation using the Kolmogorov–Smirnov and Kuiper's tests, Int. J. Climatol., 41 (2021), 6314–6323. https://doi.org/10.1002/joc.7196 doi: 10.1002/joc.7196
|


Figures(19) / Tables(4)

Lihe Liang, Jinying Cui, Juanjuan Zhao, Yan Qiang, Qianqian Yang. Ultra-short-term forecasting model of power load based on fusion of power spectral density and Morlet wavelet[J]. Mathematical Biosciences and Engineering, 2024, 21(2): 3391-3421. doi: 10.3934/mbe.2024150


 DownLoad: