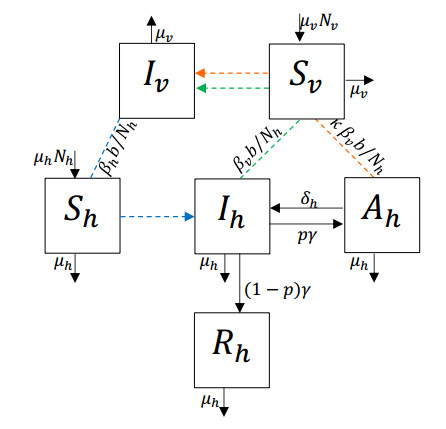
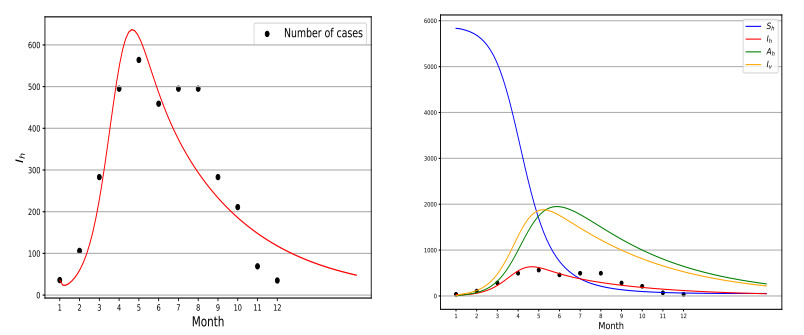
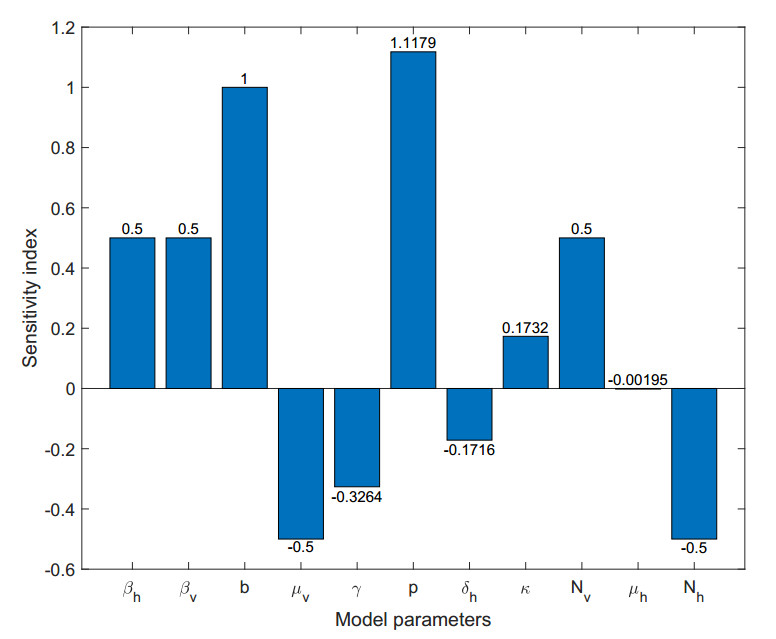
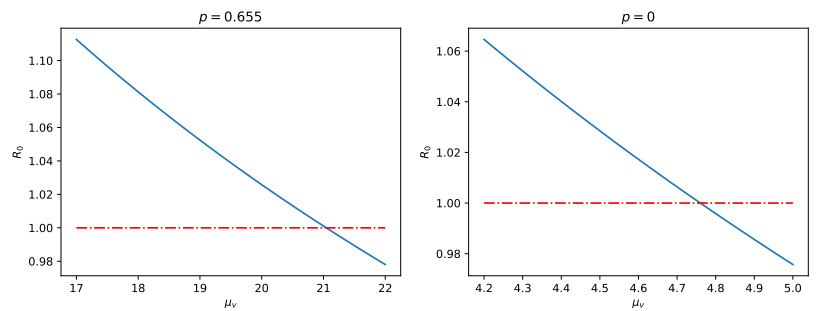
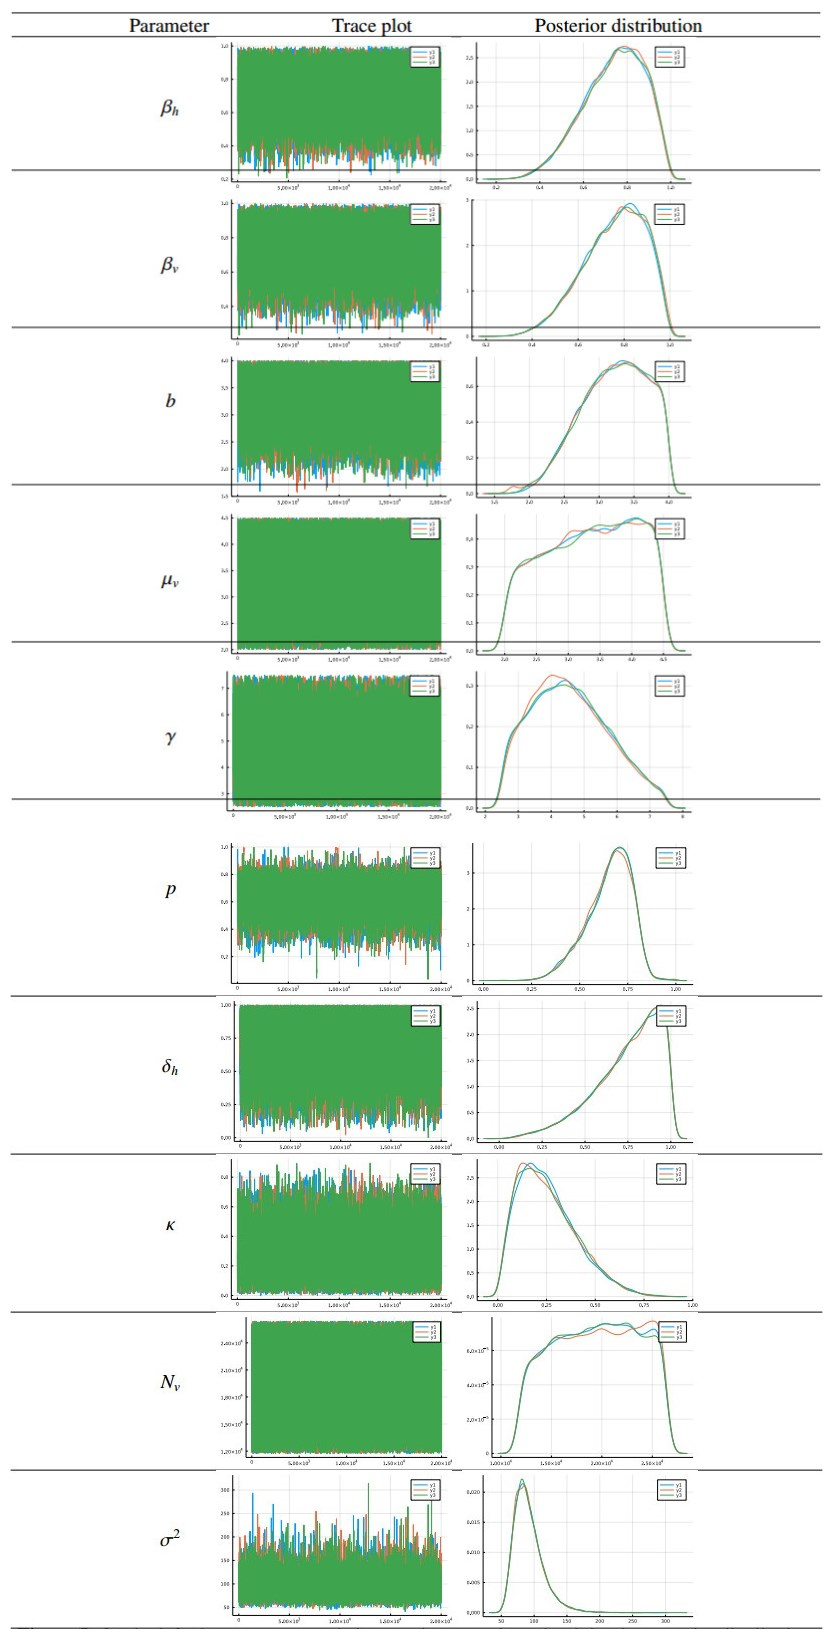
Chikungunya is a vector-borne viral disease transmitted by Aedes aegypti and Aedes albopictus mosquitoes. It does not have any specific treatment, and there is no vaccine. Recent epidemiological data have indicated that a relapse of the infection can occur within three months of the initial infection; however, until now, mathematical models for the spread of the disease have not considered this factor. We propose a mathematical model for the transmission of the Chikungunya virus that considers relapse. We calculated the basic reproductive number $ (R_0) $ of the disease by using the next-generation operator method. We proved the existence of a forward bifurcation. We determined the existence and the global stability of the equilibrium points by using the Lyapunov function method. We fitted the model to data from an outbreak in 2015 in Acapulco, Mexico to estimate the model parameters and $ R_0 $ with the Bayesian approach via a Hamiltonian Monte Carlo method. In the local sensitivity analysis, we found that the fraction of infected individuals who become asymptomatic has a strong impact on the basic reproductive number and makes some control measures insufficient. The impact of the fraction of infected individuals who become asymptomatic should be considered in Chikungunya control strategies.
Citation: María Guadalupe Vázquez-Peña, Cruz Vargas-De-León, Jorge Fernando Camacho-Pérez, Jorge Velázquez-Castro. Analysis and Bayesian estimation of a model for Chikungunya dynamics with relapse: An outbreak in Acapulco, Mexico[J]. Mathematical Biosciences and Engineering, 2023, 20(10): 18123-18145. doi: 10.3934/mbe.2023805
Chikungunya is a vector-borne viral disease transmitted by Aedes aegypti and Aedes albopictus mosquitoes. It does not have any specific treatment, and there is no vaccine. Recent epidemiological data have indicated that a relapse of the infection can occur within three months of the initial infection; however, until now, mathematical models for the spread of the disease have not considered this factor. We propose a mathematical model for the transmission of the Chikungunya virus that considers relapse. We calculated the basic reproductive number $ (R_0) $ of the disease by using the next-generation operator method. We proved the existence of a forward bifurcation. We determined the existence and the global stability of the equilibrium points by using the Lyapunov function method. We fitted the model to data from an outbreak in 2015 in Acapulco, Mexico to estimate the model parameters and $ R_0 $ with the Bayesian approach via a Hamiltonian Monte Carlo method. In the local sensitivity analysis, we found that the fraction of infected individuals who become asymptomatic has a strong impact on the basic reproductive number and makes some control measures insufficient. The impact of the fraction of infected individuals who become asymptomatic should be considered in Chikungunya control strategies.

| [1] | R. C. Rivera-Ávila, Fiebre chikungunya en México: Caso confirmado y apuntes para la respuesta epidemiológica, (Spanish) [Chikungunya fever in Mexico: confirmed case and notes on the epidemiologic response], Salud Pública de México, 56 (2014), 402–404. |
| [2] |
S. Yactayo, J. E. Staples, V. Millot, L. Cibrelus, P. Ramon-Pardo, Epidemiology of Chikungunya in the Americas, J. Infect. Diseases, 214 (2016), S441–S445. https://doi.org/10.1093/infdis/jiw390 doi: 10.1093/infdis/jiw390

|
| [3] |
Y. Dumont, F. Chiroleu, C. Domerg, On a temporal model for the Chikungunya disease: modeling, theory and numerics, Math. Biosci., 213 (2008), 80–91. https://doi.org/10.1016/j.mbs.2008.02.008 doi: 10.1016/j.mbs.2008.02.008
|
| [4] |
Y. Dumont, F. Chiroleu, Vector control for the Chikungunya disease, Math. Biosci. Eng., 7 (2010), 313–345. https://doi.org/10.3934/mbe.2010.7.313 doi: 10.3934/mbe.2010.7.313
|
| [5] |
D. Ruiz-Moreno, I. S. Vargas, K. E. Olson, L. C. Harrington, Modeling dynamic introduction of Chikungunya virus in the United States, PLoS Negl. Trop. Diseases, 6 (2012), e1918. https://doi.org/10.1371/journal.pntd.0001918 doi: 10.1371/journal.pntd.0001918
|
| [6] |
G. C. González-Parra, D. F. Aranda, B. Chen-Charpentier, M. Díaz-Rodríguez, J. E. Castellanos, Mathematical modeling and characterization of the spread of Chikungunya in Colombia, Math. Comput. Appl., 24 (2019), 6. https://doi.org/10.3390/mca24010006 doi: 10.3390/mca24010006
|
| [7] |
H. Abboubakar, A. K. Guidzavaï, J. Yangla, I. Damakoa, R. Mouangue, Mathematical modeling and projections of a vector-borne disease with optimal control strategies: A case study of the Chikungunya in Chad, Chaos Solit. Fract., 150 (2021), 111197. https://doi.org/10.1016/j.chaos.2021.111197 doi: 10.1016/j.chaos.2021.111197
|
| [8] |
E. Couturier, F. Guillemin, M. Mura, L. León, J.M. Virion, M.J. Letort, et al., Impaired quality of life after Chikungunya virus infection: a 2-year follow-up study, Rheumatology, 51 (2012), 1315–1322. https://doi.org/10.1093/rheumatology/kes015 doi: 10.1093/rheumatology/kes015
|
| [9] |
F. Simon, P. Parola, M. Grandadam, S. Fourcade, M. Oliver, P. Brouqui, et al., Chikungunya infection: An emerging rheumatism among travelers returned from Indian Ocean islands: report of 47 cases, Medicine, 86 (2007), 123–137. https://doi.org/10.1097/md/0b013e31806010a5 doi: 10.1097/md/0b013e31806010a5
|
| [10] |
F. Staikowsky, K. Le Roux, I. Schuffenecker, P. Laurent, P. Grivard, A. Develay, et al., Retrospective survey of Chikungunya disease in Reunion Island hospital staff, Epidemiol. Infect., 136 (2008), 196–206. https://doi.org/10.1017/S0950268807008424 doi: 10.1017/S0950268807008424
|
| [11] |
G. Borgherini, P. Poubeau, A. Jossaume, A. Gouix, L. Cotte, A. Michault, et al., Persistent arthralgia associated with Chikungunya virus: A study of 88 adult patients on Reunion Island, Clin. Infect. Diseases, 47 (2008), 469–475. https://doi.org/10.1086/590003 doi: 10.1086/590003
|
| [12] |
I. X. de la Cruz-Castro, E. Nava-Aguilera, A. Morales-Pérez, Á. F. Betanzos-Reyes, M. Flores-Moreno, L. Morales-Nava, et al., Factors associated with Chikungunya relapse in Acapulco, Mexico: A cross-sectional study, Vector-Borne Zoonotic Diseases, 20 (2020), 782–787. http://doi.org/10.1089/vbz.2020.2615 doi: 10.1089/vbz.2020.2615
|
| [13] |
P. van den Driessche, J. Watmough, Reproduction numbers and sub-threshold endemic equilibria for compartmental models of disease transmission, Math. Biosci., 180 (2002), 29–48. https://doi.org/10.1016/S0025-5564(02)00108-6 doi: 10.1016/S0025-5564(02)00108-6
|
| [14] |
C. Castillo-Chávez, B. Song, Dynamical models of tuberculosis and their applications, Math. Biosci. Eng., 1 (2004), 361–404. https://doi.org/10.3934/mbe.2004.1.361 doi: 10.3934/mbe.2004.1.361
|
| [15] | J. La Salle, S. Lefschetz, Stability by Liapunov's Direct Method with Applications, Academic Press, (1961). |
| [16] |
A. Korobeinikov, Lyapunov functions and global properties for SEIR and SEIS epidemic models, Math. Med. Biol., 21 (2004), 75–83. https://doi.org/10.1093/imammb/21.2.75 doi: 10.1093/imammb/21.2.75
|
| [17] | C. Vargas-De-León, J.A. Castro-Hernández, Local and global stability of host-vector disease models, Foro-Red-Mat: Revista Electrónica de Contenido Matemático, 25 (2008), 1–9. |
| [18] |
C. Vargas-De-León, Global analysis of a delayed vector-bias model for malaria transmission with incubation period in mosquitoes, Math. Biosci. Eng., 9 (2012), 165–174. https://doi.org/10.3934/mbe.2012.9.165 doi: 10.3934/mbe.2012.9.165
|
| [19] |
A. Li-Martín, R. Reyes-Carreto, C. Vargas-De-León, Dynamics of a dengue disease transmission model with two-stage structure in the human population, Math. Biosci. Eng., 20 (2023), 955–974. https://doi.org/10.3934/mbe.2023044 doi: 10.3934/mbe.2023044
|
| [20] |
A. Korobeinikov, Global properties of basic virus dynamics models, Bull. Math. Biol., 66 (2004), 879–883. https://doi.org/10.1016/j.bulm.2004.02.001 doi: 10.1016/j.bulm.2004.02.001
|
| [21] | Consejo Nacional de Población, Indicadores Demográficos de México de 1950 a 2050 (Spanish) [National Population Council, Demographic Indicators of Mexico from 1950 to 2050], 2022. |
| [22] | D. Cole, Parameter redundancy and identifiability, CRC Press, Taylor & Francis Group, (2020). |
| [23] |
M. D. Hoffman, A. Gelman, The No-U-Turn sampler: adaptively setting path lengths in Hamiltonian Monte Carlo, J. Machine Learn. Res., 15 (2014), 1593–1623. https://doi.org/10.48550/arXiv.1111.4246 doi: 10.48550/arXiv.1111.4246
|
| [24] |
A. Gelman, D.B. Rubin, Inference from iterative simulation using multiple sequences, Statistical Science, 7 (1992), 457–472. https://doi.org/10.1214/ss/1177011136 doi: 10.1214/ss/1177011136
|
| [25] |
C. Rackauckas, Q. Nie, DifferentialEquations.jl–a performant and feature-rich ecosystem for solving differential equations in Julia, J. Open Res. Software, 5 (2017), 1–5. https://doi.org/10.5334/jors.151 doi: 10.5334/jors.151
|
| [26] | H. Ge, K. Xu, Z. Ghahramani, Turing: A language for flexible probabilistic inference, in International Conference on Artificial Intelligence and Statistics, 84 (2018), 1682–1690. https://proceedings.mlr.press/v84/ge18b.html |
| [27] |
J. Bezanson, A. Edelman, S. Karpinski, V. B. Shah, Julia: A fresh approach to numerical computing, SIAM Rev., 59 (2017), 65–98. https://doi.org/10.1137/141000671 doi: 10.1137/141000671
|
| [28] | A.L. Lloyd, Sensitivity of model-based epidemiological parameter estimation to model assumptions, in Mathematical and Statistical Estimation Approaches in Epidemiology, Springer, (2009), 123–141. https://doi.org/10.1007/978-90-481-2313-1_6 |
| [29] | J. Yangla, H. Abboubakar, E. Dangbe, R. Yankoulo, A. A. A. Ari, I. Damakoa, et al., Fractional dynamics of a Chikungunya transmission model Sci. African, (2023), e01812. https://doi.org/10.1016/j.sciaf.2023.e01812 |
| [30] |
N. Haider, F. Vairo, G. Ippolito, A. Zumla, R. A. Kock, Basic reproduction number of Chikungunya virus transmitted by Aedes mosquitoes, Emerg. Infect. Diseases, 26 (2020), 2429–2431. https://doi.org/10.3201/eid2610.190957 doi: 10.3201/eid2610.190957
|
Figures(5) / Tables(2)

María Guadalupe Vázquez-Peña, Cruz Vargas-De-León, Jorge Fernando Camacho-Pérez, Jorge Velázquez-Castro. Analysis and Bayesian estimation of a model for Chikungunya dynamics with relapse: An outbreak in Acapulco, Mexico[J]. Mathematical Biosciences and Engineering, 2023, 20(10): 18123-18145. doi: 10.3934/mbe.2023805


 DownLoad: