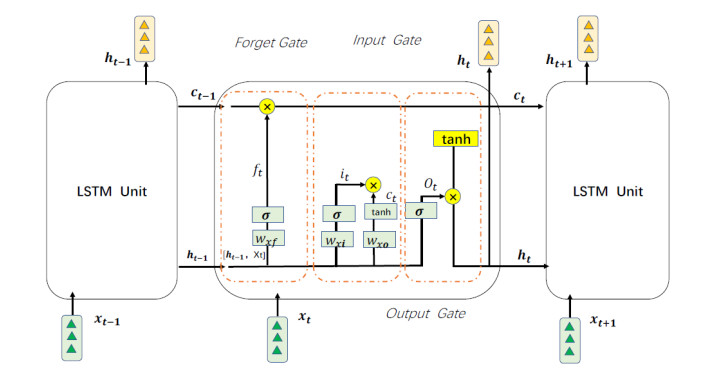
With the rapid development of e-commerce, express delivery has been chosen and accepted by consumers, and a large number of express packages have resulted in serious waste of resources and environmental pollution. Because of the irregularity of online goods purchases by users in real life, logistics parks are unable to accurately judge the recycling needs of various regions. In order to solve this problem, we propose an improved empirical mode decomposition (IEMD) algorithm combined with a long-short-term memory (LSTM) network to deal with the addresses and categories in logistics data, analyze the distribution of recyclable logistics waste in the logistics park service area and in the express recycling station within the logistics park, judge the value of recyclable logistics waste, optimize the best path for recycling vehicles and improve the success rate of logistics waste recycling. In order to better research and verify the IEMD-LSTM prediction model, we model and simulate the algorithm behavior of the express waste packaging recycling prediction model system, and compare it with other classification methods through specific logistics data experiments. The prediction accuracy, stability and advantages of the four algorithms are analyzed and compared, and the application reliability of the algorithm proposed in this paper to the logistics waste recycling process is verified. The application in the actual express logistics packaging recycling case shows the feasibility and effectiveness of the waste recycling scheme proposed in this paper.
Citation: Shujuan Liu, Hui Jin, Yanbiao Di. A strategy for predicting waste production and planning recycling paths in e-logistics based on improved EMD-LSTM[J]. Mathematical Biosciences and Engineering, 2023, 20(9): 17569-17588. doi: 10.3934/mbe.2023780
With the rapid development of e-commerce, express delivery has been chosen and accepted by consumers, and a large number of express packages have resulted in serious waste of resources and environmental pollution. Because of the irregularity of online goods purchases by users in real life, logistics parks are unable to accurately judge the recycling needs of various regions. In order to solve this problem, we propose an improved empirical mode decomposition (IEMD) algorithm combined with a long-short-term memory (LSTM) network to deal with the addresses and categories in logistics data, analyze the distribution of recyclable logistics waste in the logistics park service area and in the express recycling station within the logistics park, judge the value of recyclable logistics waste, optimize the best path for recycling vehicles and improve the success rate of logistics waste recycling. In order to better research and verify the IEMD-LSTM prediction model, we model and simulate the algorithm behavior of the express waste packaging recycling prediction model system, and compare it with other classification methods through specific logistics data experiments. The prediction accuracy, stability and advantages of the four algorithms are analyzed and compared, and the application reliability of the algorithm proposed in this paper to the logistics waste recycling process is verified. The application in the actual express logistics packaging recycling case shows the feasibility and effectiveness of the waste recycling scheme proposed in this paper.

| [1] |
S. Hochreiter, J. Schmidhuber, Long short-term memory, Neural Comput., 9 (1997), 1735–1780. https://doi.org/10.1162/neco.1997.9.8.1735 doi: 10.1162/neco.1997.9.8.1735

|
| [2] | M. Roondiwala, H. Patel, S. Varma, Predicting stock prices using LSTM, Int. J. Sci. Res., 6 (2017), 1754–1756. |
| [3] |
H. Palangi, L. Deng, Y. Shen, J. Gao, X. He, J. Chen, et al., Deep sentence embedding using long short-term memory networks: Analysis and application to information retrieval, IEEE/ACM Trans. Audio Speech Lang. Process., 24 (2016), 694–707. https://doi.org/10.1109/TASLP.2016.2520371 doi: 10.1109/TASLP.2016.2520371
|
| [4] |
H. Palangi, R. Ward, L. Deng, Distributed compressive sensing: A deep learning approach, IEEE Trans. Signal Process., 64 (2016), 4504–4518, 2016. https://doi.org/10.1109/TSP.2016.2557301 doi: 10.1109/TSP.2016.2557301
|
| [5] |
F. R. McDougall, J. P. Hruska, Report: The use of Life Cycle Inventory tools to support an integrated approach to solid waste management, Waste Manage. Res., 18 (2000), 590–594. https://doi.org/10.1034/j.1399-3070.2000.00159.x doi: 10.1034/j.1399-3070.2000.00159.x
|
| [6] |
U. Arena, M. L. Mastellone, F. Perugini, The environmental performance of alternative solid waste management options: A life cycle assessment study, Chem. Eng. J., 96 (2003), 207–222. https://doi.org/10.1016/j.cej.2003.08.019 doi: 10.1016/j.cej.2003.08.019
|
| [7] |
J. Bautista, J. Pereira, Modeling the problem of locating collection areas for urban waste management: An application to the metropolitan area of Barcelona, Omega, 34 (2006), 617–629. https://doi.org/10.1016/j.omega.2005.01.013 doi: 10.1016/j.omega.2005.01.013
|
| [8] |
O. Eriksson, M. C. Reich, B. Frostell, A. Björklund, G. Assefa, J. O. Sundqvist, et al., Municipal solid waste management from a systems perspective, J. Cleaner Prod., 13 (2005), 241–252. https://doi.org/10.1016/j.jclepro.2004.02.018 doi: 10.1016/j.jclepro.2004.02.018
|
| [9] |
K. Polat, S. S. Durduran, Subtractive clustering attribute weighting (SCAW) to discriminate the traffic accidents on Konya-Afyonkarahisar highway in Turkey with the help of GIS: A case study, Adv. Eng. Software, 42 (2011), 491–500. https://doi.org/10.1016/j.advengsoft.2011.04.001 doi: 10.1016/j.advengsoft.2011.04.001
|
| [10] |
Y. Sun, M. G. Genton, Adjusted functional boxplots for spatio-temporal data visualization and outlier detection, Environmetrics, 23 (2012), 54–64. https://doi.org/10.1002/env.1136 doi: 10.1002/env.1136
|
| [11] |
J. M. Chiou, Y. C. Zhang, W. H. Chen, C. W. Chang, A functional data approach to missing value imputation and outlier detection for traffic flow data, Transportmetrica B: Transport Dyn., 2 (2014), 106–129. https://doi.org/10.1080/21680566.2014.892847 doi: 10.1080/21680566.2014.892847
|
| [12] |
P. Jin, S. Parker, J. Fang, B. Ran, C. M. Walton, Freeway recurrent bottleneck identification algorithms considering detector data quality issues, J. Transp. Eng., 138 (2012), 1205–1214. https://doi.org/10.1061/(ASCE)TE.1943-5436.0000424 doi: 10.1061/(ASCE)TE.1943-5436.0000424
|
| [13] |
R. Deb, A. W. C. Liew, Missing value imputation for the analysis of incomplete traffic accident data, Inf. Sci., 339 (2016), 274–289. https://doi.org/10.1016/j.ins.2016.01.018 doi: 10.1016/j.ins.2016.01.018
|
| [14] |
R. Deb, A. W. C. Liew, Noisy values detection and correction of traffic accident data, Inf. Sci., 476 (2019), 132–146. https://doi.org/10.1016/j.ins.2018.10.002 doi: 10.1016/j.ins.2018.10.002
|
| [15] |
R. Mao, Z. Chen, G. Hu, Robust temporal low-rank representation for traffic data recovery via fused lasso, IET Intel. Transport Syst., 15 (2021), 175–186. https://doi.org/10.1049/itr2.12010 doi: 10.1049/itr2.12010
|
| [16] |
H. Amazal, M. Kissi, A new big data feature selection approach for text classification, Sci. Program., 2021 (2021), 6645345. https://doi.org/10.1155/2021/6645345 doi: 10.1155/2021/6645345
|
| [17] |
D. Di Sarli, C. Gallicchio, A. Micheli, Text classification by untrained sentence embeddings, Intell. Artif., 14 (2020), 245–259. https://doi.org/10.3233/IA-200053 doi: 10.3233/IA-200053
|
| [18] |
P. Mehta, S. Chandra., Robustness and predictive performance of homogeneous ensemble feature selec-tion in text classification, Int. J. Inf. Retr. Res., 11 (2021), 75–89. https://doi.org/10.4018/IJIRR.2021010104 doi: 10.4018/IJIRR.2021010104
|
| [19] |
K. Fiok, W. Karwowski, E. Gutierrez-Franco, M. R. Davahli, M. Wilamowski, T. Ahram, et al., Text guide: Improving the quality of long text classification by a text selection method based on feature importance, IEEE Access, 9 (2021), 105439–105450. https://doi.org/10.1109/ACCESS.2021.3099758 doi: 10.1109/ACCESS.2021.3099758
|
| [20] |
E. Savku, G. W. Weber, A stochastic maximum principle for a markov regime-switching jump-diffusion model with delay and an application to finance, J. Optim. Theory Appl., 179 (2018), 696–721. https://doi.org/10.1007/s10957-017-1159-3 doi: 10.1007/s10957-017-1159-3
|
| [21] |
S. Kuter, Z. Akyurek, G. W. Weber, Retrieval of fractional snow covered area from MODIS data by multivariate adaptive regression splines, Remote Sens. Environ., 205 (2018), 236–252. https://doi.org/10.1016/j.rse.2017.11.021 doi: 10.1016/j.rse.2017.11.021
|
| [22] |
A. Özmen, E. Kropat, G. W. Weber, Robust optimization in spline regression models for multi-model regulatory networks under polyhedral uncertainty, Optimization, 66 (2017), 2135–2155. https://doi.org/10.1080/02331934.2016.1209672 doi: 10.1080/02331934.2016.1209672
|
| [23] |
Ö. N. Onak, Y. S. Dogrusoz, G. W. Weber, Evaluation of multivariate adaptive non-parametric reduced-order model for solving the inverse electrocardiography problem: A simulation study, Med. Biol. Eng. Comput., 57 (2019), 967–993. https://doi.org/10.1007/s11517-018-1934-9 doi: 10.1007/s11517-018-1934-9
|
| [24] |
A. Cevik, G. W. Weber, B. M. Eyuboglu, K. K. Oguz, Voxel-MARS: A method for early detection of Alzheimer's disease by classification of structural brain MRI, Ann. Oper. Res., 258 (2017), 31–57. https://doi.org/10.1007/s10479-017-2405-7 doi: 10.1007/s10479-017-2405-7
|
| [25] |
B. Kalaycı, A. Özmen, G. W. Weber, Mutual relevance of investor sentiment and finance by modeling coupled stochastic systems with MARS, Ann. Oper. Res., 295 (2020), 183–206. https://doi.org/10.1007/s10479-020-03757-8 doi: 10.1007/s10479-020-03757-8
|
| [26] |
P. Taylan, F. Yerlikaya-zkurt, B. Bilgi Uak, G. W. Weber, A new outlier detection method based on convex optimization: Application to diagnosis of Parkinson's disease, J. Appl. Stat., 48 (2021), 2421–2440. https://doi.org/10.1080/02664763.2020.1864815 doi: 10.1080/02664763.2020.1864815
|
| [27] |
R. Lotf, Z. Yadegari, S. H. Hosseini, A. H. Khameneh, E. B. Tirkolaee, G. W. Weber, A robust time-cost-quality-energy-environment trade-off with resource-constrained in project management: a case study for a bridge construction project, J. Ind. Manage. Optim., 18 (2020), 375–396. http://doi.org/10.3934/jimo.2020158 doi: 10.3934/jimo.2020158
|
| [28] |
S. Özöğür-Akyüz, B. C. Otar, P. K. Atas, Ensemble cluster pruning via convex-concave programming, Comput. Intell., 36 (2020), 297–319. https://doi.org/10.1111/coin.12267 doi: 10.1111/coin.12267
|
| [29] |
E. B. Tirkolaee, A. Goli, S. Mirjalili, Circular economy application in designing sustainable medical waste management systems, Environ. Sci. Pollut. Res. Int., 29 (2022), 79667–79668. https://doi.org/10.1007/s11356-022-20740-x doi: 10.1007/s11356-022-20740-x
|
| [30] |
R. Lotfi, K. Kheiri, A. Sadeghi, E. Babaee Tirkolaee, An extended robust mathematical model to project the course of COVID-19 epidemic in Iran, Ann. Oper. Res., 2022 (2022), 1–25. https://doi.org/10.1007/s10479-021-04490-6 doi: 10.1007/s10479-021-04490-6
|
| [31] |
M. Khalili, M. Karamouzian, N. Nasiri, S. Javadi, H. Sharifi, Epidemiological characteristics of COVID-19: A systematic review and meta-analysis, Epidemiol. Infect., 148 (2020), e130. https://doi.org/10.1017/S0950268820001430 doi: 10.1017/S0950268820001430
|
| [32] |
P. Wang, X. Chen, X. Zhang, Research on location of logistics distribution center based on k-means clustering algorithm, Secur. Commun. Netw., 2022 (2022), 2546429. https://doi.org/10.1155/2022/2546429 doi: 10.1155/2022/2546429
|
| [33] |
R. Bobbili, V. Madhu, A machine learning model for failure of perforated plates under impact, Mech. Based Des. Struct. Mach., 50 (2022), 2582–2590. https://doi.org/10.1080/15397734.2020.1763184 doi: 10.1080/15397734.2020.1763184
|
| [34] |
C. Li, Construction of the reverse resource recovery system of e-waste based on DLRNN, Comput. Intell. Neurosci., 2021 (2021), 2143235. https://doi.org/10.1155/2021/2143235 doi: 10.1155/2021/2143235
|
| [35] |
M. K. Lim, Y. Li, X. Song, Exploring customer satisfaction in cold chain logistics using a text mining approach, Ind. Manage. Data. Syst., 121 (2021), 2426–2449. https://doi.org/10.1108/IMDS-05-2021-0283 doi: 10.1108/IMDS-05-2021-0283
|
| [36] |
K. Cao, A machine learning-based approach to railway logistics transport path optimization, Math. Probl. Eng., 2022 (2022), 1691215. https://doi.org/10.1155/2022/1691215 doi: 10.1155/2022/1691215
|
| [37] |
A. Mohammadi-Balani, M. D. Nayeri, A. Azar, M. Taghizadeh-Yazdi, Golden eagle optimizer: A nature-inspired metaheuristic algorithm, Comput. Ind. Eng., 152 (2021), 107050. https://doi.org/10.1016/j.cie.2020.107050 doi: 10.1016/j.cie.2020.107050
|
| [38] |
L. Abualigah, M. Abd Elaziz, P. Sumari, Z. W. Geem, A. H. Gandomi, Reptile Search Algorithm (RSA): A nature-inspired meta-heuristic optimizer, Expert Syst. Appl., 191 (2022), 116158. https://doi.org/10.1016/j.eswa.2021.116158 doi: 10.1016/j.eswa.2021.116158
|
| [39] |
J. W. Wang, W. H. Ip, R. R. Muddada, J. L. Huang, W. J. Zhang, On Petri net implementation of proactive resilient holistic supply chain networks, Int. J. Adv. Manuf. Technol., 69 (2013), 427–437. https://doi.org/10.1007/s00170-013-5022-x doi: 10.1007/s00170-013-5022-x
|
| [40] |
J. Wang, R. Dou, R. R. Muddada, W. Zhang, Management of a holistic supply chain network for proactive resilience: Theory and case study, Comput. Ind. Eng., 125 (2018), 668–677. https://doi.org/10.1016/j.cie.2017.12.021 doi: 10.1016/j.cie.2017.12.021
|


Figures(8) / Tables(3)

Shujuan Liu, Hui Jin, Yanbiao Di. A strategy for predicting waste production and planning recycling paths in e-logistics based on improved EMD-LSTM[J]. Mathematical Biosciences and Engineering, 2023, 20(9): 17569-17588. doi: 10.3934/mbe.2023780


 DownLoad: