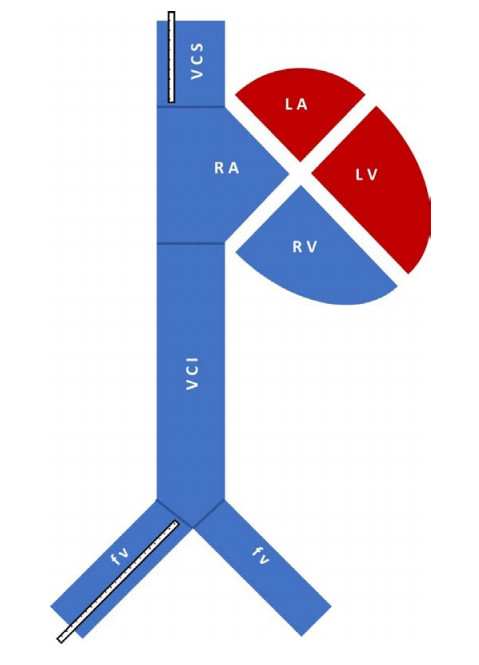
Transpulmonary thermodilution (TPTD) is usually performed by jugular indicator injection. In clinical practice, femoral venous access is often used instead, resulting in substantial overestimation of global end-diastolic volume index (GEDVI). A correction formula compensates for that. The objective of this study is to first evaluate the efficacy of the currently implemented correction function and then further improve this formula.
The performance of the established correction formula was investigated in our prospectively collected dataset of 98 TPTD measurements from 38 patients with both, jugular and femoral venous access. Subsequently, a new correction formula was developed: cross validation revealed the favourite covariate combination and a general estimating equation provided the final version, which was tested in a retrospective validation on an external dataset.
Investigating the current correction function revealed a considerable reduction of bias compared to no correction. Concerning the objective of formula development, the covariate combination of GEDVI obtained after femoral indicator injection, age and body surface area is even favoured, when compared to the parameters of the previously published correction formula, as a further reduction of mean absolute error (68 vs. 61 ml/m2), a better correlation (0.90 vs. 0.91) and an increased adjusted R2 (0.72 vs 0.78) is noticed in the cross validation results. Of particular clinical importance is, that more measurements were correctly assigned to the same GEDVI category (decreased / normal / increased) using the revised formula, compared with the gold standard of jugular indicator injection (72.4 vs. 74.5%). In a retrospective validation, the newly developed formula showed a greater reduction of bias (to 2 vs. 6 %) than the currently implemented formula.
The currently implemented correction function partly compensates for GEDVI overestimation. Applying the new correction formula on GEDVI measured after femoral indicator administration enhances the informative value and reliability of this preload parameter.
Citation: Hannah Schuster, Bernhard Haller, Sengül Sancak, Johanna Erber, Roland M. Schmid, Tobias Lahmer, Sebastian Rasch. Transpulmonary thermodilution: A revised correction formula for global end-diastolic volume index derived after femoral indicator injection[J]. Mathematical Biosciences and Engineering, 2023, 20(6): 9876-9890. doi: 10.3934/mbe.2023433
Transpulmonary thermodilution (TPTD) is usually performed by jugular indicator injection. In clinical practice, femoral venous access is often used instead, resulting in substantial overestimation of global end-diastolic volume index (GEDVI). A correction formula compensates for that. The objective of this study is to first evaluate the efficacy of the currently implemented correction function and then further improve this formula.
The performance of the established correction formula was investigated in our prospectively collected dataset of 98 TPTD measurements from 38 patients with both, jugular and femoral venous access. Subsequently, a new correction formula was developed: cross validation revealed the favourite covariate combination and a general estimating equation provided the final version, which was tested in a retrospective validation on an external dataset.
Investigating the current correction function revealed a considerable reduction of bias compared to no correction. Concerning the objective of formula development, the covariate combination of GEDVI obtained after femoral indicator injection, age and body surface area is even favoured, when compared to the parameters of the previously published correction formula, as a further reduction of mean absolute error (68 vs. 61 ml/m2), a better correlation (0.90 vs. 0.91) and an increased adjusted R2 (0.72 vs 0.78) is noticed in the cross validation results. Of particular clinical importance is, that more measurements were correctly assigned to the same GEDVI category (decreased / normal / increased) using the revised formula, compared with the gold standard of jugular indicator injection (72.4 vs. 74.5%). In a retrospective validation, the newly developed formula showed a greater reduction of bias (to 2 vs. 6 %) than the currently implemented formula.
The currently implemented correction function partly compensates for GEDVI overestimation. Applying the new correction formula on GEDVI measured after femoral indicator administration enhances the informative value and reliability of this preload parameter.

| [1] |
J. Bouchard, S. B. Soroko, G. M. Chertow, J. Himmelfarb, T. A. Ikizler, E. P. Paganini, et al., Fluid accumulation, survival and recovery of kidney function in critically ill patients with acute kidney injury, Kidney Int., 76 (2009), 422–427. https://doi.org/10.1038/ki.2009.159 doi: 10.1038/ki.2009.159

|
| [2] |
M. L. Malbrain, P. E. Marik, I. Witters, C. Cordemans, A. W. Kirkpatrick, D. J. Roberts, et al., Fluid overload, de-resuscitation, and outcomes in critically ill or injured patients: A systematic review with suggestions for clinical practice, Anaesthesiol. Intensive Ther., 46 (2014), 361–380. https://doi.org/10.5603/ait.2014.0060 doi: 10.5603/ait.2014.0060
|
| [3] |
X. Monnet, J.-L. Teboul, Transpulmonary thermodilution: advantages and limits, Critical Care, 21 (2017), 147. https://doi.org/10.1186/s13054-017-1739-5 doi: 10.1186/s13054-017-1739-5
|
| [4] |
M. Cecconi, D. De Backer, M. Antonelli, R. Beale, J. Bakker, C. Hofer, et al., Consensus on circulatory shock and hemodynamic monitoring. Task force of the European Society of Intensive Care Medicine, Intensive Care Med., 40 (2014), 1795–1815. https://doi.org/10.1007/s00134-014-3525-z doi: 10.1007/s00134-014-3525-z
|
| [5] |
S. G. Sakka, Hemodynamic Monitoring in the Critically Ill Patient - Current Status and Perspective, Front. Med., 2 (2015), 44. https://doi.org/10.3389/fmed.2015.00044 doi: 10.3389/fmed.2015.00044
|
| [6] |
M. R. Pinsky, Hemodynamic monitoring over the past 10 years, Crit. Care, 10 (2006), 117. https://doi.org/10.1186/cc3997 doi: 10.1186/cc3997
|
| [7] |
M. S. Goepfert, D. A. Reuter, D. Akyol, P. Lamm, E. Kilger, A. E. Goetz, Goal-directed fluid management reduces vasopressor and catecholamine use in cardiac surgery patients, Intensive Care Med., 33 (2007), 96–103. https://doi.org/10.1007/s00134-006-0404-2 doi: 10.1007/s00134-006-0404-2
|
| [8] |
W. Huber, A. Umgelter, W. Reindl, M. Franzen, C. Schmidt, S. von Delius, et al., Volume assessment in patients with necrotizing pancreatitis: a comparison of intrathoracic blood volume index, central venous pressure, and hematocrit, and their correlation to cardiac index and extravascular lung water index, Crit. Care Med., 36 (2008), 2348–2354. https://doi.org/10.1097/CCM.0b013e3181809928 doi: 10.1097/CCM.0b013e3181809928
|
| [9] |
P. E. Marik, R. Cavallazzi, T. Vasu, A. Hirani, Dynamic changes in arterial waveform derived variables and fluid responsiveness in mechanically ventilated patients: A systematic review of the literature, Crit. Care Med., 37 (2009), 2642–2647. https://doi.org/10.1097/CCM.0b013e3181a590da doi: 10.1097/CCM.0b013e3181a590da
|
| [10] |
P. E. Marik, M. Flemmer, W. Harrison, The risk of catheter-related bloodstream infection with femoral venous catheters as compared to subclavian and internal jugular venous catheters: A systematic review of the literature and meta-analysis, Crit. Care Med., 40 (2012), 2479–2485. https://doi.org/10.1097/CCM.0b013e318255d9bc doi: 10.1097/CCM.0b013e318255d9bc
|
| [11] |
K. S. Deshpande, C. Hatem, H. L. Ulrich, B. P. Currie, T. K. Aldrich, C. W. Bryan-Brown, et al., The incidence of infectious complications of central venous catheters at the subclavian, internal jugular, and femoral sites in an intensive care unit population, Crit. Care Med., 33 (2005), 13–20, discussion 234–235. https://doi.org/10.1097/01.ccm.0000149838.47048.60 doi: 10.1097/01.ccm.0000149838.47048.60
|
| [12] |
W. Huber, V. Phillip, J. Höllthaler, C. Schultheiss, B. Saugel, R. M. Schmid, Femoral indicator injection for transpulmonary thermodilution using the EV1000/VolumeView(®): Do the same criteria apply as for the PiCCO(®)?, J. Zhejiang University Sci. B, 17 (2016), 561–567. https://doi.org/10.1631/jzus.B1500244 doi: 10.1631/jzus.B1500244
|
| [13] |
S. Schmidt, T. H. Westhoff, C. Hofmann, J. H. Schaefer, W. Zidek, F. Compton, et al., Effect of the venous catheter site on transpulmonary thermodilution measurement variables, Crit. Care Med., 35 (2007), 783–786. https://doi.org/10.1097/01.Ccm.0000256720.11360.Fb doi: 10.1097/01.Ccm.0000256720.11360.Fb
|
| [14] |
B. Saugel, A. Umgelter, T. Schuster, V. Phillip, R. M. Schmid, W. Huber, Transpulmonary thermodilution using femoral indicator injection: a prospective trial in patients with a femoral and a jugular central venous catheter, Crit. Care (London, England), 14 (2010), R95–R95. https://doi.org/10.1186/cc9030 doi: 10.1186/cc9030
|
| [15] |
A. Beitz, H. Berbara, S. Mair, B. Henschel, T. Lahmer, S. Rasch, et al., Consistency of cardiac function index and global ejection fraction with global end-diastolic volume in patients with femoral central venous access for transpulmonary thermodilution: A prospective observational study, J. Clin. Monit. Comput., 31 (2017), 599–605. https://doi.org/10.1007/s10877-016-9880-2 doi: 10.1007/s10877-016-9880-2
|
| [16] |
H. Berbara, S. Mair, A. Beitz, B. Henschel, R. M. Schmid, W. Huber, Pulmonary vascular permeability index and global end-diastolic volume: are the data consistent in patients with femoral venous access for transpulmonary thermodilution: A prospective observational study, BMC Anesthesiol., 14 (2014), 81. https://doi.org/10.1186/1471-2253-14-81 doi: 10.1186/1471-2253-14-81
|
| [17] |
W. Huber, M. Eckmann, A. Gruber, I. Klein, F. Elkmann, K. Putko, et al., 227: Transpulmonary thermodilution with femoral indicator injection: a validation study of the PiCCO-2, Crit. Care Med., 48 (2020), 96. https://doi.org/10.1097/01.ccm.0000619264.29417.24 doi: 10.1097/01.ccm.0000619264.29417.24
|
| [18] |
P. M. Kapoor, V. Bhardwaj, A. Sharma, U. Kiran, Global end-diastolic volume an emerging preload marker vis-a-vis other markers - Have we reached our goal?, Ann. Card. Anaesth., 19 (2016), 699–704. https://doi.org/10.4103/0971-9784.191554 doi: 10.4103/0971-9784.191554
|
| [19] |
J. M. Bland, D. G. Altman, Measuring agreement in method comparison studies, Stat. Methods Med. Res., 8 (1999), 135–160. https://doi.org/10.1177/096228029900800204 doi: 10.1177/096228029900800204
|
| [20] |
L. U. Taniguchi, F. G. Zampieri, A. P. Nassar, Jr., Applicability of respiratory variations in stroke volume and its surrogates for dynamic fluid responsiveness prediction in critically ill patients: A systematic review of the prevalence of required conditions, Rev. Bras. Ter. Intensiva, 29 (2017), 70–76. https://doi.org/10.5935/0103-507x.20170011 doi: 10.5935/0103-507x.20170011
|
| [21] |
F. Michard, S. Alaya, V. Zarka, M. Bahloul, C. Richard, J. L. Teboul, Global end-diastolic volume as an indicator of cardiac preload in patients with septic shock, Chest, 124 (2003), 1900–1908. https://doi.org/10.1378/chest.124.5.1900 doi: 10.1378/chest.124.5.1900
|
| [22] |
M. Biais, H. de Courson, R. Lanchon, B. Pereira, G. Bardonneau, M. Griton, et al., Mini-fluid challenge of 100 ml of crystalloid predicts fluid responsiveness in the operating room, Anesthesiology, 127 (2017), 450–456. https://doi.org/10.1097/aln.0000000000001753 doi: 10.1097/aln.0000000000001753
|
| [23] |
H. D. Aya, A. Rhodes, I. Chis Ster, N. Fletcher, R. M. Grounds, M. Cecconi, Hemodynamic effect of different doses of fluids for a fluid challenge: A Quasi-randomized controlled study, Crit. Care Med., 45 (2017), e161–e168. https://doi.org/10.1097/ccm.0000000000002067 doi: 10.1097/ccm.0000000000002067
|


Figures(4) / Tables(3)

Hannah Schuster, Bernhard Haller, Sengül Sancak, Johanna Erber, Roland M. Schmid, Tobias Lahmer, Sebastian Rasch. Transpulmonary thermodilution: A revised correction formula for global end-diastolic volume index derived after femoral indicator injection[J]. Mathematical Biosciences and Engineering, 2023, 20(6): 9876-9890. doi: 10.3934/mbe.2023433


 DownLoad: