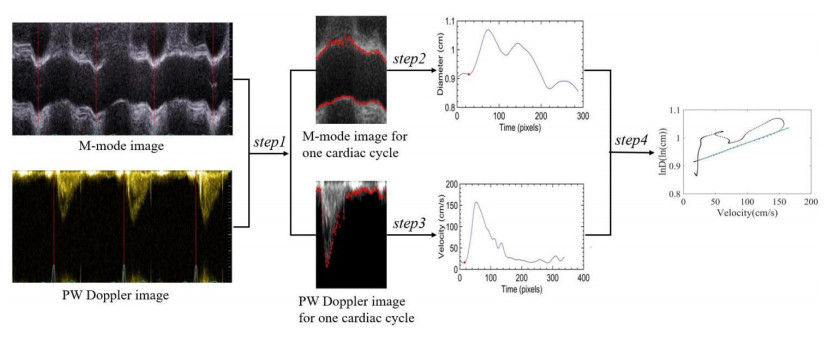
The original diameter velocity loop method (ln(D)U-loop) cannot accurately extract the blood vessel diameter waveform when the quality of ultrasound image data is not high (such as obesity, age, and the operation of the ultrasound doctor), so it is unable to measure the pulse wave velocity (PWV) of the ascending aorta. This study proposes a diameter waveform extraction method combining threshold, gradient filtering, and the center of gravity method. At the same time, the linear regression method of searching for the rising point of the systolic period is replaced by the optimal average of two linear regression methods. This method can also extract the diameter waveform with poor-quality images and obtain a more accurate PWV. In vivo experimental data from 17 (age 60.5 ± 9.2) elderly patients with cerebral infarction and 12 (age 32.5 ± 5.6) healthy young adults were used for processing, and the results showed that the mean PWV using the ln(D)U-loop method was 12.56 (SD = 3.47) ms−1 for patients with cerebral infarction and 6.81 (SD = 1.73) ms−1 for healthy young adults. The PWV results based on the Wilcoxon rank-sum test and calculated based on the improved ln(D)U-loop method were both statistically significant (p < 0.01). The agreement analysis (Bland–Altman analysis) between the QA-loop and ln(D)U-loop methods showed that the mean deviation of the measured PWV was 0.07 m/s and the standard deviation of the deviation was 1.18 m/s. The experimental results demonstrated the effectiveness of the improved ln(D)U-loop method proposed in this paper on poor-quality images. This study can improve the possibility of the ln(D)U-loop method being widely used in the clinical measurement of ascending aortic PWV.
Citation: Shuyan Liu, Peilin Li, Yuanhao Tan, Geqi Ding, Bo Peng. A robust local pulse wave imaging method based on digital image processing techniques[J]. Mathematical Biosciences and Engineering, 2023, 20(4): 6721-6734. doi: 10.3934/mbe.2023289
The original diameter velocity loop method (ln(D)U-loop) cannot accurately extract the blood vessel diameter waveform when the quality of ultrasound image data is not high (such as obesity, age, and the operation of the ultrasound doctor), so it is unable to measure the pulse wave velocity (PWV) of the ascending aorta. This study proposes a diameter waveform extraction method combining threshold, gradient filtering, and the center of gravity method. At the same time, the linear regression method of searching for the rising point of the systolic period is replaced by the optimal average of two linear regression methods. This method can also extract the diameter waveform with poor-quality images and obtain a more accurate PWV. In vivo experimental data from 17 (age 60.5 ± 9.2) elderly patients with cerebral infarction and 12 (age 32.5 ± 5.6) healthy young adults were used for processing, and the results showed that the mean PWV using the ln(D)U-loop method was 12.56 (SD = 3.47) ms−1 for patients with cerebral infarction and 6.81 (SD = 1.73) ms−1 for healthy young adults. The PWV results based on the Wilcoxon rank-sum test and calculated based on the improved ln(D)U-loop method were both statistically significant (p < 0.01). The agreement analysis (Bland–Altman analysis) between the QA-loop and ln(D)U-loop methods showed that the mean deviation of the measured PWV was 0.07 m/s and the standard deviation of the deviation was 1.18 m/s. The experimental results demonstrated the effectiveness of the improved ln(D)U-loop method proposed in this paper on poor-quality images. This study can improve the possibility of the ln(D)U-loop method being widely used in the clinical measurement of ascending aortic PWV.

| [1] |
M. Ezzati, Z. Obermeyer, I. Tzoulaki, B. M. Mayosi, P. Elliott, D. A. Leon, Contributions of risk factors and medical care to cardiovascular mortality trends, Nat. Rev. Cardiol., 12 (2015), 508–530. https://doi.org/10.1038/nrcardio.2015.82 doi: 10.1038/nrcardio.2015.82

|
| [2] | L. Y. Ma, W. W. Chen, R. L. Gao, L. S. Liu, M. L. Zhu, Y. J. Wang, et al., China cardiovascular diseases report 2018: An updated summary, J. Geriatr Cardiol., 17 (2020), 1–8. |
| [3] |
T. Pereira, C. Correia, J. Cardoso, Novel methods for pulse wave velocity measurement, J. Med. Biol. Eng., 35 (2015), 555–565. https://doi.org/10.1007/s40846-015-0086-8. doi: 10.1007/s40846-015-0086-8
|
| [4] | S. Zhang, L. Sun, H. Ju, Z. Bao, X. A. Zeng, S. Lin, Research advances and application of pulsed electric field on proteins and peptides in food, Food Res. Int., 139 (2021), 109914. |
| [5] |
S. Laurent, J. Cockcroft, L. Van Bortel, P. Boutouyrie, C. Giannattasio, D. Hayoz, et al., Expert consensus document on arterial stiffness: Methodological issues and clinical applications, Eur. Heart J., 27 (2006), 2588–2605. https://doi.org/10.1093/eurheartj/ehl254 doi: 10.1093/eurheartj/ehl254
|
| [6] |
B. Li, H. Gao, X. Li, Y. Liu, M. Wang, Correlation between Brachial-Ankle pulse wave velocity and arterial compliance and cardiovascular risk factors in elderly patients with arteriosclerosis, Hypertens. Res., 29 (2006), 309–314. https://doi.org/10.1291/hypres.29.309 doi: 10.1291/hypres.29.309
|
| [7] | H. L. Kim, S. H. Kim, Pulse wave velocity in atherosclerosis, Front. Cardiovasc. Med., 6 (2019), 41. |
| [8] | A. Jeevarethinam, S. Venuraju, A. Dumo, S. Ruano, V. S. Mehta, M. Rosenthal, et al., Relationship between carotid atherosclerosis and coronary artery calcification in asymptomatic diabetic patients: A prospective multicenter study, Clin. Cardiol., 40 (2017), 752–758. |
| [9] | W. Yang, Y. Wang, Y. Yu, L. Mu, F. Kong, J. Yang, et al., Establishing normal reference value of carotid ultrafast pulse wave velocity and evaluating changes on coronary slow flow, Int. J. Cardiovasc. Imaging, 36 (2020), 1931–1939. |
| [10] | A. Pribadi, T. A. T. Nasution, H. Zakaria, T. L. R. Mengko, Brachial-Ankle pulse wave velocity calculation methods based on oscillometric pressure measurement for arterial stiffness assessment, in 2018 2nd International Conference on Biomedical Engineering (IBIOMED), (2018), 1–6. https://doi.org/10.1109/IBIOMED.2018.8534778 |
| [11] |
Y. Li, C. Wang, M. Zhao, S. Yao, M. Wang, S. Zhang, et al., Effect of brachial-ankle pulse wave velocity combined with waist-to-hip ratio on cardiac and cerebrovascular events, Am. J. Med. Sci., 362 (2021), 135–142. https://doi.org/10.1016/j.amjms.2021.02.014 doi: 10.1016/j.amjms.2021.02.014
|
| [12] |
N. Piko, S. Bevc, R. Hojs, F. H. Naji, R. Ekart, The association between pulse wave analysis, carotid-femoral pulse wave velocity and peripheral arterial disease in patients with ischemic heart disease, BMC Cardiovasc. Disord., 21 (2021), 33. https://doi.org/10.1186/s12872-021-01859-0 doi: 10.1186/s12872-021-01859-0
|
| [13] | K. V. Raj, P. M. Nabeel, J. Joseph, Image-Free fast ultrasound for measurement of local pulse wave velocity: In vitro validation and in vivo feasibility, IEEE Trans. Ultrason. Ferroelectr. Freq. Control., 69 (2022), 2248–2256. |
| [14] |
J. Liu, K. Wang, H. Liu, H. Zhao, W. Huang, N. Zhao, et al., Cross-Sectional relationship between carotid-femoral pulse wave velocity and biomarkers in vascular-related diseases, Int. J. Hypertens., 2020 (2020), 6578731. https://doi.org/10.1155/2020/6578731 doi: 10.1155/2020/6578731
|
| [15] |
H. Ji, J. Xiong, S. Yu, C. Chi, B. Bai, J. Teliewubai, et al., Measuring the carotid to femoral pulse wave velocity (Cf-PWV) to evaluate arterial stiffness, Medicine, (2018). https://doi.org/10.3791/57083 doi: 10.3791/57083
|
| [16] |
C. J. Tang, P. Y. Lee, Y. H. Chuang, C. C. Huang, Measurement of local pulse wave velocity for carotid artery by using an ultrasound-based method, Ultrasonics, 102 (2020), 106064. https://doi.org/10.1016/j.ultras.2020.106064 doi: 10.1016/j.ultras.2020.106064
|
| [17] |
A. Tentolouris, I. Eleftheriadou, P. Grigoropoulou, A. Kokkinos, G. Siasos, I. Ntanasis-Stathopoulos, et al., The association between pulse wave velocity and peripheral neuropathy in patients with type 2 diabetes mellitus, J. Diabetes Its Complications, 31 (2017), 1624–1629. https://doi.org/10.1016/j.jdiacomp.2017.07.010 doi: 10.1016/j.jdiacomp.2017.07.010
|
| [18] |
X. Liu, J. Liu, X. Xu, L. Chun, J. Tang, Y. Deng, A robust detail preserving anisotropic diffusion for speckle reduction in ultrasound images, BMC Genomics, 12 (2011), S14. https://doi.org/10.1186/1471-2164-12-S5-S14 doi: 10.1186/1471-2164-12-S5-S14
|
| [19] |
J. Tang, S. Guo, Q. Sun, Y. Deng, D. Zhou, Speckle reducing bilateral filter for cattle follicle segmentation, BMC Genomics, 11 (2010), S9. https://doi.org/10.1186/1471-2164-11-S2-S9 doi: 10.1186/1471-2164-11-S2-S9
|
| [20] |
J. Luo, R. X. Li, E. E. Konofagou, Pulse wave imaging of the human carotid artery: An in vivo feasibility study, IEEE Trans. Ultrason. Ferroelectr. Freq. Control., 59 (2012), 174–181. https://doi.org/10.1109/TUFFC.2012.2170 doi: 10.1109/TUFFC.2012.2170
|
| [21] |
C. Huang, T. L. Ren, J. Luo, Effects of parameters on the accuracy and precision of ultrasound-based local pulse wave velocity measurement: A simulation study, IEEE Trans. Ultrason. Ferroelectr. Freq. Control., 61 (2014), 2001–2018. https://doi.org/10.1109/TUFFC.2014.006597 doi: 10.1109/TUFFC.2014.006597
|
| [22] |
G. Fiori, F. Fuiano, A. Scorza, S. Conforto, S. A. Sciuto, Non-Invasive methods for PWV measurement in blood vessel stiffness assessment, IEEE Rev. Biomed. Eng., 15 (2022), 169–183. https://doi.org/10.1109/RBME.2021.3092208 doi: 10.1109/RBME.2021.3092208
|
| [23] | M. Negoita, A. D. Hughes, K. H. Parker, A. W. Khir, Non-invasive technique for determining local pulse wave velocity in humans ascending aorta, Comput. Cardiol., 1–4. https://doi.org/10.22489/CinC.2017.218-036 |
| [24] |
M. Negoita, A. D. Hughes, K. H. Parker, A. W. Khir, A method for determining local pulse wave velocity in human ascending aorta from sequential ultrasound measurements of diameter and velocity, Physiol. Meas., 39 (2018), 114009. https://doi.org/10.1088/1361-6579/aae8a0 doi: 10.1088/1361-6579/aae8a0
|
| [25] |
S. I. Rabben, N. Stergiopulos, L. R. Hellevik, O. A. Smiseth, S. Slørdahl, S. Urheim, et al., An ultrasound-based method for determining pulse wave velocity in superficial arteries, J. Biomech., 37 (2004), 1615–1622. https://doi.org/10.1016/j.jbiomech.2003.12.031 doi: 10.1016/j.jbiomech.2003.12.031
|
| [26] | J. Feng, A. W. Khir, Determination of wave speed and wave separation in the arteries using diameter and velocity, J. Biomech., 43 (2010), 455–462. |
| [27] | H. Qun, Using linear array CCD for long distance diffraction alignment measurment, Opt. Technol., (1999). |
| [28] |
A. A. Tijsseling, A. W. Anderson, Johannes von Kries and the History of Water Hammer, J. Hydraul. Eng., 133 (2007), 1–8. https://doi.org/10.1061/(ASCE)0733-9429(2007)133:1(1) doi: 10.1061/(ASCE)0733-9429(2007)133:1(1)
|
| [29] |
J. R. Womersley, Method for the calculation of velocity, rate of flow and viscous drag in arteries when the pressure gradient is known, J. Phys., 127 (1955), 553–563. https://doi.org/10.1113/jphysiol.1955.sp005276 doi: 10.1113/jphysiol.1955.sp005276
|
| [30] |
D. W. Holdsworth, C. J. Norley, R. Frayne, D. A. Steinman, B. K. Rutt, Characterization of common carotid artery blood-flow waveforms in normal human subjects, Phys. Meas., 20 (1999), 219–240. https://doi.org/10.1088/0967-3334/20/3/301 doi: 10.1088/0967-3334/20/3/301
|


Figures(8) / Tables(1)

Shuyan Liu, Peilin Li, Yuanhao Tan, Geqi Ding, Bo Peng. A robust local pulse wave imaging method based on digital image processing techniques[J]. Mathematical Biosciences and Engineering, 2023, 20(4): 6721-6734. doi: 10.3934/mbe.2023289


 DownLoad: