Nowadays online collective actions are pervasive, such as the rumor spreading on the Internet. The observed curves take on the S-shape, and we focus on evolutionary dynamics for S- shape curves of online rumor spreading. For agents, key factors, such as internal aspects, external aspects, and hearing frequency jointly determine whether to spread it. Agent-based modeling is applied to capture micro-level mechanism of this S-shape curve. We have three findings: (a) Standard S-shape curves of spreading can be obtained if each agent has the zero threshold; (b) Under zero-mean thresholds, as heterogeneity (SD) grows from zero, S-shape curves with longer right tails can be obtained. Generally speaking, stronger heterogeneity comes up with a longer duration; and (c) Under positive mean thresholds, the spreading curve is two-staged, with a linear stage (first) and nonlinear stage (second), but not standard S-shape curves either. From homogeneity to heterogeneity, the spreading S-shaped curves have longer right tail as the heterogeneity grows. For the spreading duration, stronger heterogeneity usually brings a shorter duration. The effects of heterogeneity on spreading curves depend on different situations. Under both zero and positive-mean thresholds, heterogeneity leads to S-shape curves. Hence, heterogeneity enhances the spreading with thresholds, but it may postpone the spreading process with homogeneous thresholds.
Citation: Peng Lu, Rong He, Dianhan Chen. Exploring S-shape curves and heterogeneity effects of rumor spreading in online collective actions[J]. Mathematical Biosciences and Engineering, 2022, 19(3): 2355-2380. doi: 10.3934/mbe.2022109
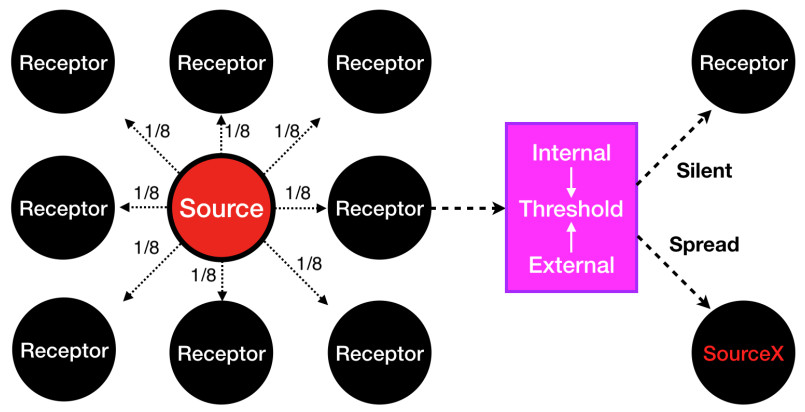
Nowadays online collective actions are pervasive, such as the rumor spreading on the Internet. The observed curves take on the S-shape, and we focus on evolutionary dynamics for S- shape curves of online rumor spreading. For agents, key factors, such as internal aspects, external aspects, and hearing frequency jointly determine whether to spread it. Agent-based modeling is applied to capture micro-level mechanism of this S-shape curve. We have three findings: (a) Standard S-shape curves of spreading can be obtained if each agent has the zero threshold; (b) Under zero-mean thresholds, as heterogeneity (SD) grows from zero, S-shape curves with longer right tails can be obtained. Generally speaking, stronger heterogeneity comes up with a longer duration; and (c) Under positive mean thresholds, the spreading curve is two-staged, with a linear stage (first) and nonlinear stage (second), but not standard S-shape curves either. From homogeneity to heterogeneity, the spreading S-shaped curves have longer right tail as the heterogeneity grows. For the spreading duration, stronger heterogeneity usually brings a shorter duration. The effects of heterogeneity on spreading curves depend on different situations. Under both zero and positive-mean thresholds, heterogeneity leads to S-shape curves. Hence, heterogeneity enhances the spreading with thresholds, but it may postpone the spreading process with homogeneous thresholds.

| [1] | J. Ma, D. Li, Z. Tian, Rumor spreading in online social networks by considering the bipolar social reinforcement, Phys. A., 447 (2016), 108-115. https://doi.org/10.1016/j.physa.2015.12.005 |
| [2] | J. Lee, Y. Choi, Informed public against false rumor in the social media era: Focusing on social media dependency, Telemat. Inform., 35 (2018), 1071-1081. https://doi.org/10.1016/j.tele.2017.12.017 |
| [3] | Y. Hu, Q. Pan, W. Hou, M. He, Rumor spreading model considering the proportion of wisemen in the crowd, Phys. A., 505 (2018), 1084-1094. https://doi.org/10.1016/j.physa.2018.04.056 |
| [4] | Q. Wang, X. Yang, W. Xi, Effects of group arguments on rumor belief and transmission in online communities: An information cascade and group polarization perspective. Inf. Manage., 55 (2017), 441-449. https://doi.org/10.1016/j.im.2017.10.004 |
| [5] | M. Ostilli, E. Yoneki, I. X. Leung, J. F. Mendes, P. Lió, J. Crowcroft, Statistical mechanics of rumour spreading in network communities, Proc. Comp. Sci., 1 (2010), 2331-2339. https://doi.org/10.1016/j.procs.2010.04.262 |
| [6] | L. Zhao, Q. Wang, J. Cheng, Y. Chen, J. Wang, W. Huang, Rumor spreading model with consideration of forgetting mechanism: A case of online blogging Live Journal, Phys. A., 390 (2011), 2619-2625. https://doi.org/10.1016/j.physa.2011.03.010 |
| [7] | D. Li, J. Ma, How the government's punishment and individual's sensitivity affect the rumor spreading in online social networks, Phys. A., 469 (2017), 284-292. https://doi.org/10.1016/j.physa.2016.11.033 |
| [8] | E. Sahafizadeh, B. T. Ladani, The impact of group propagation on rumor spreading in mobile social networks, Phys. A., 506 (2018), 412-423. https://doi.org/10.1016/j.physa.2018.04.038 |
| [9] | J. Ma, H. Zhu, Rumor diffusion in heterogeneous networks by considering the individuals' subjective judgment and diverse characteristics, Phys. A., 499 (2018), 276-287. https://doi.org/10.1016/j.physa.2018.02.037 |
| [10] | C. Pan, L. X. Yang, X. Yang, Y. Wu, Y. Y. Tang, An effective rumor-containing strategy, Phys. A., 500 (2018), 80-91. https://doi.org/10.1016/j.physa.2018.02.025 |
| [11] | L. Wang, G. Song, Global stability of a two-mediums rumor spreading model with media coverage, Phys. A., 482 (2017), 757-771. https://doi.org/10.1016/j.physa.2017.04.027 |
| [12] | N. Zhang, H. Huang, B. Su, J. Zhao, B. Zhang, Dynamic 8-state ICSAR rumor propagation model considering official rumor refutation, Phys. A., 415 (2014), 333-346. https://doi.org/10.1016/j.physa.2014.07.023 |
| [13] | D. Centola, The spread of behavior in an online social network experiment, Science, 329 (2010), 1194-1197. https://doi.org/10.1126/science.1185231 |
| [14] | T. Schelling, Micromotives and macrobehavior, Norton Press, 2005. |
| [15] | D. M. Centola, Homophily, networks, and critical mass: Solving the start-up problem in large group collective action, Ration. Soc., 25 (2013), 3-40. https://doi.org/10.1177/1043463112473734 |
| [16] | M. Van Zomeren, C. W. Leach, R. Spears, Does group efficacy increase group identification? Resolving their paradoxical relationship, J. Exp. Soc. Psychol., 46 (2010), 1055-1060. https://doi.org/10.1016/j.jesp.2010.05.006 |
| [17] | L. Zhao, H. Cui, X. Qiu, X. Wang, J. Wang, SIR rumor spreading model in the new media age, Phys. A., 392 (2013), 995-1003. https://doi.org/10.1016/j.physa.2012.09.030 |
| [18] | L. Zhu, Y. Wang, Rumor diffusion model with spatio-temporal diffusion and uncertainty of behavior decision in complex social networks, Phys. A., 502 (2018), 29-39. https://doi.org/10.1016/j.physa.2018.02.060 |
| [19] | Y. Tanaka, Y. Sakamoto, T. Matsuka, Transmission of rumor and criticism in twitter after the great japan earthquake, Social Science Electronic Publishing, 2012 |
| [20] | J. Shin, L. Jian, K. Driscoll, F. Bar, Political rumoring on twitter during the 2012 us presidential election: rumor diffusion and correction, Social Science Electronic Publishing, 2016 |
| [21] | O. Oh, M. Agrawal, R. H. Rao, Community intelligence and social media services: a rumor theoretic analysis of tweets during social crises, Mis Quart., 37 (2013), 407-426. https://doi.org/10.25300/misq/2013/37.2.05 |
| [22] | J. Lee, M. Agrawal, H. R. Rao, Message diffusion through social network service: the case of rumor and non-rumor related tweets during boston bombing 2013, Inform. Syst. Front., 17 (2015), 997-1005. https://doi.org/10.1007/s10796-015-9568-z |
| [23] | S. Hamidian, M. Diab, Rumor identification and belief investigation on Twitter, in Proceedings of the 7th Workshop on computational approaches to subjectivity, sentiment and social media analysis, (2016), 3-8. |
| [24] | M. Mai, A. Nadamoto, E. Aramaki, How do rumors spread during a crisis?: analysis of rumor expansion and disaffirmation on twitter after 3.11 in Japan, Int. J. Web Inf. Syst., 10 (2014), 394-412. https://doi.org/10.1108/IJWIS-04-2014-0015 |
| [25] | R. Escalante, M. Odehnal, A deterministic mathematical model for the spread of two rumors, Afrika. Mat., 31(2020), 315-331. https://doi.org/10.1007/s13370-019-00726-8 |
| [26] | A. Y. Chua, S. Banerjee, To share or not to share: The role of epistemic belief in online health rumors, Int. J. Med. Inform., 108 (2017), 36-41. https://doi.org/10.1016/j.ijmedinf.2017.08.010 |
| [27] | Y. Hu, Q. Pan, W. Hou, M. He, Rumor spreading model with the different attitudes towards rumors, Phys. A., 502 (2018), 331-344. https://doi.org/10.1016/j.physa.2018.02.096 |
| [28] | L. A. Huo, P. Huang, X. Fang, An interplay model for authorities' actions and rumor spreading in emergency event, Phys. A., 390 (2011), 3267-3274. https://doi.org/10.1016/j.physa.2011.05.008 |
| [29] | K. Ji, J. Liu, G. Xiang, Anti-rumor dynamics and emergence of the timing threshold on complex network, Phys. A., 411 (2014), 87-94. https://doi.org/10.1016/j.physa.2014.06.013 |
| [30] | W. Li, S. Tang, S. Pei, S. Yan, S. Jiang, X. Teng, et al., The rumor diffusion process with emerging independent spreaders in complex networks, Phys. A., 397 (2014), 121-128. https://doi.org/10.1016/j.physa.2013.11.021 |
| [31] | U. Merlone, D. Radi, Reaching consensus on rumors, Phys. A., 406 (2014), 260-271. https://doi.org/10.1016/j.physa.2014.03.048 |
| [32] | L. L. Xia, G. P. Jiang, B. Song, Y. R. Song, Rumor spreading model considering hesitating mechanism in complex social networks, Phys. A., 437 (2015), 295-303. https://doi.org/10.1016/j.physa.2015.05.113 |
| [33] | V. Giorno, S. Spina, Rumor spreading models with random denials, Phys. A., 461 (2016), 569-576. https://doi.org/10.1016/j.physa.2016.06.070 |
| [34] | R. Zhang, D. Li, Rumor propagation on networks with community structure, Phys. A., 483 (2017), 375-385. https://doi.org/10.1016/j.physa.2017.05.006 |
| [35] | L. Zhu, Y. Wang, Rumor spreading model with noise interference in complex social networks, Phys. A., 469 (2017), 750-760. https://doi.org/10.1016/j.physa.2016.11.119 |
| [36] |
L. A. Huo, C. Ma, Dynamical analysis of rumor spreading model with impulse vaccination and time delay, Phys. A., 471 (2017), 653-665. doi: 10.1016/j.physa.2016.12.024. doi: 10.1016/j.physa.2016.12.024

|
| [37] | M. Jia, H. Ruan, Z. Zhang, How rumors fly, J. Bus. Res., 72 (2017), 33-45. https://doi.org/10.1016/j.jbusres.2016.11.010 |
| [38] | R. Y. Tian, Y. J. Liu, Isolation, insertion, and reconstruction: Three strategies to intervene in rumor spread based on super network model, Decis. Support Syst., 67 (2014), 121-130. https://doi.org/10.1016/j.dss.2014.09.001 |
| [39] | L. Zhao, J. Wang, Y. Chen, Q. Wang, J. Cheng, H. Cui, SIHR rumor spreading model in social networks, Phys. A., 391 (2012), 2444-2453. https://doi.org/10.1016/j.physa.2011.12.008 |
| [40] | L. Zhao, W. Xie, H. O. Gao, X. Qiu, X. Wang, S. Zhang, A rumor spreading model with variable forgetting rate, Phys. A., 392 (2013), 6146-6154. https://doi.org/10.1016/j.physa.2013.07.080 |
| [41] | L. Zhao, X. Qiu, X. Wang, J. Wang, Rumor spreading model considering forgetting and remembering mechanisms in inhomogeneous networks, Phys. A., 392 (2013), 987-994. https://doi.org/10.1016/j.physa.2012.10.031 |
| [42] | L. Zhao, X. Wang, X. Qiu, J. Wang, A model for the spread of rumors in Barrat-Barthelemy-Vespignani (BBV) networks, Phys. A., 392 (2013), 5542-5551. https://doi.org/10.1016/j.physa.2013.07.012 |
| [43] | S. Han, F. Zhuang, Q. He, Z. Shi, X. Ao, Energy model for rumor propagation on social networks, Phys. A., 394 (2014), 99-109. https://doi.org/10.1016/j.physa.2013.10.003 |
| [44] | K. Afassinou, Analysis of the impact of education rate on the rumor spreading mechanism, Phys. A., 414 (2014), 43-52. https://doi.org/10.1016/j.physa.2014.07.041 |
| [45] | J. Wang, L. Zhao, R. Huang, SIRaRu rumor spreading model in complex networks, Phys. A., 398 (2014), 43-55. https://doi.org/10.1016/j.physa.2013.12.004 |
| [46] | Y. Zan, J. Wu, P. Li, Q. Yu, SICR rumor spreading model in complex networks: Counterattack and self-resistance, Phys. A., 405 (2014), 159-170. https://doi.org/10.1016/j.physa.2014.03.021 |
| [47] | D. Li, J. Ma, Z. Tian, H. Zhu, An evolutionary game for the diffusion of rumor in complex networks, Phys. A., 433 (2015), 51-58. https://doi.org/10.1016/j.physa.2015.03.080 |
| [48] | R. Y. Tian, X. F. Zhang, Y. J. Liu, SSIC model: A multi-layer model for intervention of online rumors spreading, Phys. A., 427 (2015), 181-191. https://doi.org/10.1016/j.physa.2015.02.008 |
| [49] | Z. Qian, S. Tang, X. Zhang, Z. Zheng, The independent spreaders involved SIR rumor model in complex networks, Phys. A., 429 (2015), 95-102. https://doi.org/10.1016/j.physa.2015.02.022 |
| [50] | N. Song, Dynamical interplay between the dissemination of scientific knowledge and rumor spreading in emergency, Phys. A., 461(2016), 73-84. https://doi.org/10.1016/j.physa.2016.05.028 |
| [51] | Z. J. Zhao, Y. M. Liu, K. X. Wang, An analysis of rumor propagation based on propagation force, Phys. A., 443 (2016), 263-271. https://doi.org/10.1016/j.physa.2015.09.060 |
| [52] | R. Jie, J. Qiao, G. Xu, Y. Meng, A study on the interaction between two rumors in homogeneous complex networks under symmetric conditions, Phys. A., 454 (2016), 129-142. https://doi.org/10.1016/j.physa.2016.02.048 |
| [53] |
S. Hosseini, M. A. Azgomi, A model for malware propagation in scale-free networks based on rumor spreading process. Comput. Netw., 108 (2016), 97-107. doi: 10.1016/j.comnet.2016.08.010 doi: 10.1016/j.comnet.2016.08.010
|
| [54] | X. Qiu, L. Zhao, J. Wang, X. Wang, Q. Wang, Effects of time-dependent diffusion behaviors on the rumor spreading in social networks. Phys. Lett. A, 380 (2016), 2054-2063. https://doi.org/10.1016/j.physleta.2016.04.025 |
| [55] | Q. Liu, T. Li, M. Sun, The analysis of an SEIR rumor propagation model on heterogeneous network, Phys. A., 469 (2017), 372-380. https://doi.org/10.1016/j.physa.2016.11.067 |
| [56] | Y. Zhang, Y. Su, L. Weigang, , H. Liu, Rumor and authoritative information propagation model considering super spreading in complex social networks, Phys. A., 506 (2018), 395-411. https://doi.org/10.1016/j.physa.2018.04.082 |
| [57] | Y. Zan, DSIR double-rumors spreading model in complex networks, Phys. A., 110 (2018), 191-202. https://doi.org/10.1016/j.chaos.2018.03.021 |
| [58] | Y. Cheng, C. Liu, F. Ding, Dynamic analysis of rumor spreading model for considering active network nodes and nonlinear spreading rate, Phys. A., 506 (2018), 24-35. https://doi.org/10.1016/j.physa.2018.03.063 |
| [59] | O. Oh, P. Gupta, M. Agrawal, H. R. Rao, ICT mediated rumor beliefs and resulting user actions during a community crisis, Gov. Inform. Q., 35 (2018), 243-258. https://doi.org/10.1016/j.giq.2018.03.006 |
| [60] | W. Chen, Y. Zhang, C. K. Yeo, C. T. Lau, B. S. Lee, Unsupervised rumor detection based on users' behaviors using neural networks, Pattern Recogn. Lett., 105 (2017), 226-233. https://doi.org/10.1016/j.patrec.2017.10.014 |
| [61] | F. Jia, G. Lv, Dynamic analysis of a stochastic rumor propagation model, Phys. A., 490 (2018), 613-623. https://doi.org/10.1016/j.physa.2017.08.125 |
| [62] | J. Jia, W. Wu, A rumor transmission model with incubation in social networks, Phys. A., 491 (2018), 453-462. https://doi.org/10.1016/j.physa.2017.09.063 |
| [63] | H. L. Liu, C. Ma, B. B. Xiang, M. Tang, H. F. Zhang, Identifying multiple influential spreaders based on generalized closeness centrality, Phys. A., 492 (2018), 2237-2248. https://doi.org/10.1016/j.physa.2017.11.138 |
| [64] | Y. Zhang, J. Zhu, Stability analysis of I2S2R rumor spreading model in complex networks, Phys. A., 503 (2018), 862-881. https://doi.org/10.1016/j.physa.2018.02.087 |
| [65] | S. Dong, F. H. Fan, Y. C. Huang, Studies on the population dynamics of a rumor-spreading model in online social networks, Phys. A., 492 (2018), 10-20. https://doi.org/10.1016/j.physa.2017.09.077 |
| [66] | A. Zubiaga, E. Kochkina, M. Liakata, R. Procter, M. Lukasik, K. Bontcheva, et al., Discourse-aware rumour stance classification in social media using sequential classifiers, Inf. Process. Manage., 54 (2018), 273-290. https://doi.org/10.1016/j.ipm.2017.11.009 |
| [67] | J. Wang, L. Zhao, R. Huang, 2SI2R rumor spreading model in homogeneous networks, Phys. A., 413 (2014), 153-161. https://doi.org/10.1016/j.physa.2014.06.053 |
| [68] | R. Escalante, M. Odehnal, . Prediction of trending topics using ANFIS and deterministic models, preprint, arXiv: 1709.07535. |
| [69] |
S. Tarrow, National politics and collective action: Recent theory and research in Western Europe and the United States, Annu. Rev. Sociol., 14 (1988), 421-440. doi: 10.1146/annurev.so.14.080188.002225 doi: 10.1146/annurev.so.14.080188.002225
|
| [70] | X. Zhao, J. Wang, Dynamical model about rumor spreading with medium, Discrete Dyn. Nat. Soc., 2013 (2013). https://doi.org/10.1155/2013/586867 |
| [71] | D. Trpevski, W. K. Tang, L. Kocarev, Model for rumor spreading over networks. Phys. Rev. E Stat. Nonlinear Soft Matter Phys., 81 (2010), 056102. https://doi.org/10.1103/PhysRevE.81.056102 |
| [72] | W. Ruigrok, W. Amann, H. Wagner, The internationalization-performance relationship at swiss firms: a test of the s-shape and extreme degrees of internationalization, Manage. Int. Rev., 47 (2007), 349-368. https://doi.org/10.1007/s11575-007-0020-6 |
| [73] | A. Flache, M. W. Macy, Stochastic collusion and the power law of learning: a general reinforcement learning model of cooperation, J. Conflict Resolut., 46 (2002), 629-653. https://doi.org/10.1177/002200202236167 |
| [74] | M. W. Macy, Learning theory and the logic of critical mass, Am. Sociol. Rev., 55 (1990), 809-826. https://doi.org/10.2307/2095747 |
| [75] | Y. H. Guan, L. Lv, R. Duan, Y. H. Ji, The brain image segmentation by markov field and normal distribution curve, in International Congress on Image and Signal Processing, IEEE, (2009), 1-5. https://doi.org/10.1109/CISP.2009.5303479 |
| [76] | M. Granovetter, Threshold models of collective behavior, Am. J. Sociol., 83 (1978), 1420-1443. |
| [77] | H. J. Li, L. Wang, Multi-scale asynchronous belief percolation model on multiplex networks, New J. Phys., 21 (2019). |
| [78] | Z. L. Hu, L. Wang, C. B. Tang, Locating the source node of diffusion process in cyber-physical networks via minimum observers, Chaos An Interdiscip. J. Nonlinear Sci., 29 (2019), 063117. https://doi.org/10.1063/1.5092772 |
| [79] | L. Wang, J. T. Wu, Characterizing the dynamics underlying global spread of epidemics, Nat. Commun., 9 (2018), 1-11. https://doi.org/10.1038/s41467-017-02344-z |
| [80] | J. Wang, L.Wang, X. Li, Identifying spatial invasion of pandemics on metapopulation networks via anatomizing arrival history, IEEE T. Cybernetics, 46 (2015), 2782-2795. https://doi.org/10.1109/tcyb.2015.2489702 |
| [81] | Z. Wang, L. Wang, A. Szolnoki, M. Perc, Evolutionary games on multilayer networks: a colloquium, Eur. Phys. J. B., 88 (2015), 1-15. https://doi.org/10.1140/epjb/e2015-60270-7 |
| [82] | Z. Wang, D. W. Zhao, L. Wang, G. Q. Sun, Z. Jin, Immunity of multiplex networks via acquaintance vaccination, Epl, 112 (2015), 6. https://doi.org/10.1209/0295-5075/112/48002 |
| [83] | D. He, R. Lui, L. Wang, C. K. Tse, L.Yang, L. Stone, Global spatio-temporal patterns of influenza in the post-pandemic era, Sci. Rep., 5 (2015), 11013. https://doi.org/10.1038/srep11013 |
| [84] | Z.Wang, M. A. Andrews, Z. X. Wu, L. Wang, C. T. Bauch, Coupled disease-behavior dynamics on complex networks: A review, Phys. Life Rev., 15 (2015), 1-29. https://doi.org/10.1016/j.plrev.2015.07.006 |
| [85] | D. Zhao, L.Wang, S. Li, Z. Wang, L. Wang, B. Gao, Immunization of epidemics in multiplex networks, Plos One, 9 (2014). https://doi.org/10.1371/journal.pone.0112018 |
| [86] | L. Wang, X. Li, Spatial epidemiology of networked metapopulation: an overview, Chin. Sci. Bull., 59 (2014), 3511-3522. https://doi.org/10.1007/s11434-014-0499-8 |
| [87] | Z. Wang, Y. Liu, L. Wang, Y. Zhang, Z. Wang, Freezing period strongly impacts the emergence of a global consensus in the voter model, Sci. Rep., 4 (2014). https://doi.org/10.1038/srep03597 |
| [88] | L. Wang, Y. Zhang, Z. Wang, X. Li, The impact of human location-specific contact pattern on the sir epidemic transmission between populations, Int. J. Bifurcat. Chaos, 23 (2013). https://doi.org/10.1142/s0218127413500958 |
| [89] | L. Wang, Z. Wang, Y. Zhang, X. Li, How human location-specific contact patterns impact spatial transmission between populations?, Sci. Rep., 3 (2013), 1-10. https://doi.org/10.1038/srep01468 |
| [90] | H. F. Zhang, Z. X. Wu, X. K. Xu, M. Small, L. Wang, B. H. Wang, Impacts of subsidy policies on vaccination decisions in contact networks, Phys. Rev. E, 88 (2013). https://doi.org/10.1103/PhysRevE.88.012813 |
| [91] | G. Q. Zhang, Q. B. Sun, L. Wang, Noise-induced enhancement of network reciprocity in social dilemmas. Chaos Solitons Fractals, 51 (2013), 31-35. https://doi.org/10.1016/j.chaos.2013.03.003 |
| [92] | L. Wang, Y. Zhang, T. Y. Huang, X. Li, Estimating the value of containment strategies in delaying the arrival time of an influenza pandemic: A case study of travel restriction and patient isolatio, Phys. Rev. E, 86 (2012), 5. https://doi.org/10.1103/PhysRevE.86.032901 |
| [93] | Y. Zhang, L.Wang, Y. Q. Zhang, X. Li, Towards a temporal network analysis of interactive WiFi users, Epl, 98(2012), 6. https://doi.org/10.1209/0295-5075/98/68002 |
| [94] | L. Wang, X. Li, Y. Q. Zhang, Y. Zhang, K. Zhang, Evolution of scaling emergence in large-scale spatial epidemic spreading, Plos One, 6 (2011), 11. https://doi.org/10.1371/journal.pone.0021197 |
| [95] | Y. Q. Wang, X. Y. Yang, Y. L. Han, X. A. Wang, Rumor spreading model with trust mechanism in complex social networks, Commun. Theor. Phys., 59 (2013), 510-516. https://doi.org/10.1088/0253-6102/59/4/21 |
| [96] | H. Huang, A war of (mis) information: The political effects of rumors and rumor rebuttals in an authoritarian country, Brit. J Polit. Sci., 47 (2017), 283-311. https://doi.org/10.1017/S0007123415000253 |
| [97] | A. J. Berinsky, Rumors and health care reform: experiments in political misinformation, Brit. J. Polit. Sci., 47 (2017), 241-262. https://doi.org/10.1017/s0007123415000186 |
| [98] | S. Tisue, U. Wilensky, NetLogo: Design and implementation of a multi-agent modeling environment, Proc. Agent, 2004 (2004), 7-9 |
| [99] | U. Wilensky, W. Rand, An introduction to agent-based modeling: modeling natural, social, and engineered complex systems with NetLogo, Mit Press, 2015. |
| [100] | Q. Wang, H. Wang, Z. Zhang, Y. Li, Y. Liu, M. Perc, Heterogeneous investments promote cooperation in evolutionary public goods games, Phys. A., 502 (2018), 570-575. https://doi.org/10.1016/j.physa.2018.02.140 |
| [101] | M. A. Amaral, L. Wardil, M. Perc, J. K. L. D. Silva, Evolutionary mixed games in structured populations: cooperation and the benefits of heterogeneity, Phys. Rev. E, 93 (2016), 042304. https://doi.org/10.1103/PhysRevE.93.042304 |
| [102] | M. Perc, Does strong heterogeneity promote cooperation by group interactions?, New J. Phys., 13 (2011), 123027-123037. https://doi.org/10.1088/1367-2630/13/12/123027 |
| [103] | Z. Wang, Heterogeneous aspirations promote cooperation in the prisoner's dilemma game, Plos One, 5 (2010), e15117. https://doi.org/10.1371/journal.pone.0015117 |
| [104] | V. Mahadevan, W. Li, V. Bhalodia, N. Vasconcelos, Anomaly detection in crowded scenes, in 2010 IEEE Computer Society Conference on Computer Vision and Pattern Recognition, 2010. https://doi.org/10.1109/CVPR.2010.5539872 |
| [105] | T. Wang, Z. Miao, Yuxin Chen, Y. Zhou, G. C. Shan, H. Snoussi., AED-net: An abnormal event detection network, Engineering, 5 (2019), 930-939. https://doi.org10.1016/j.eng.2019.02.008 |


Figures(9) / Tables(2)

Peng Lu, Rong He, Dianhan Chen. Exploring S-shape curves and heterogeneity effects of rumor spreading in online collective actions[J]. Mathematical Biosciences and Engineering, 2022, 19(3): 2355-2380. doi: 10.3934/mbe.2022109


 DownLoad: