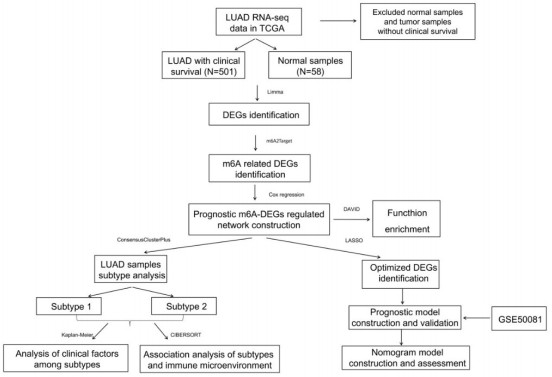
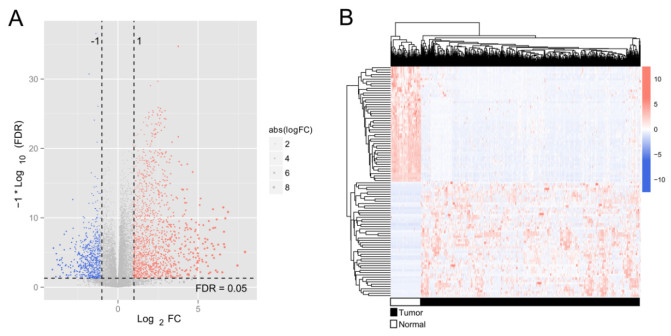
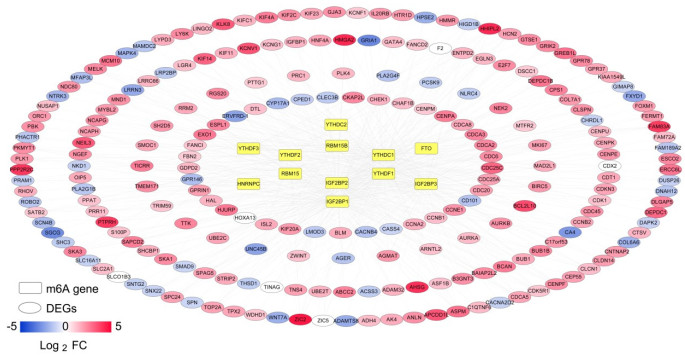
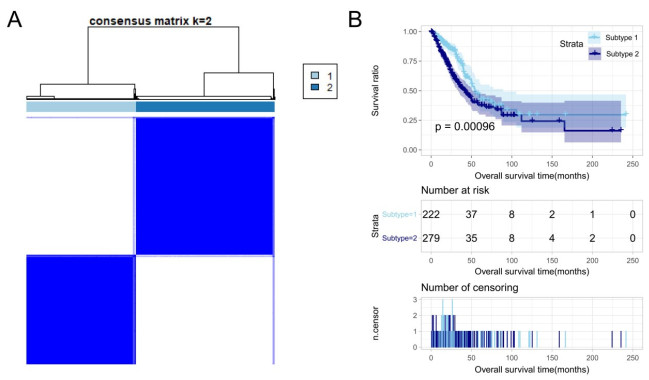
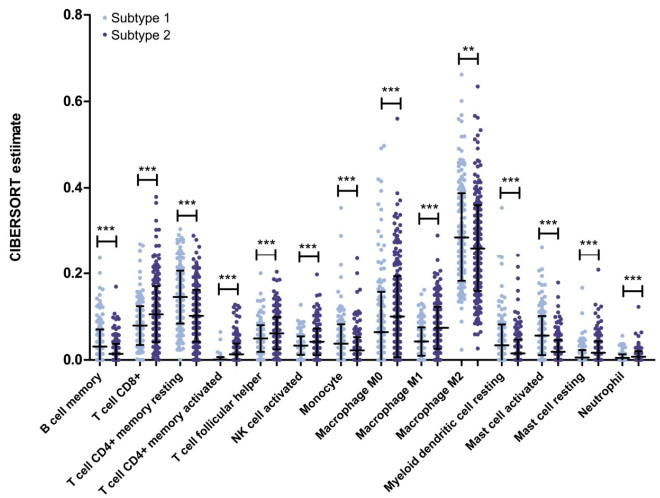
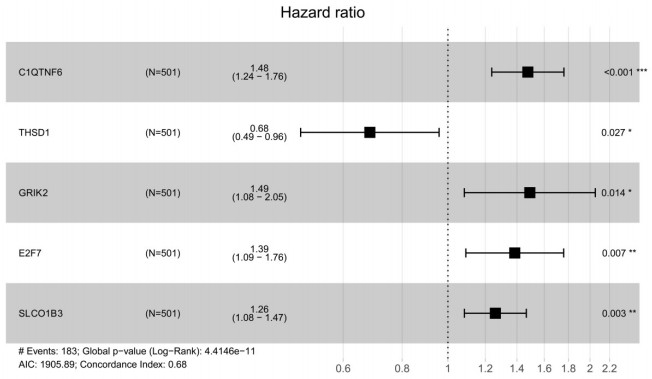
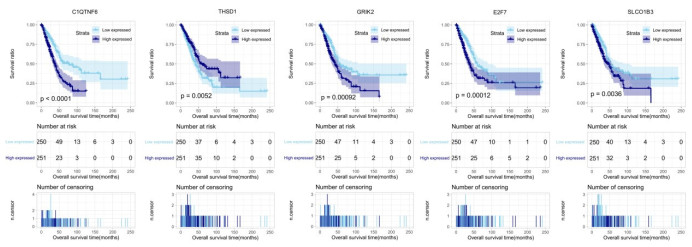
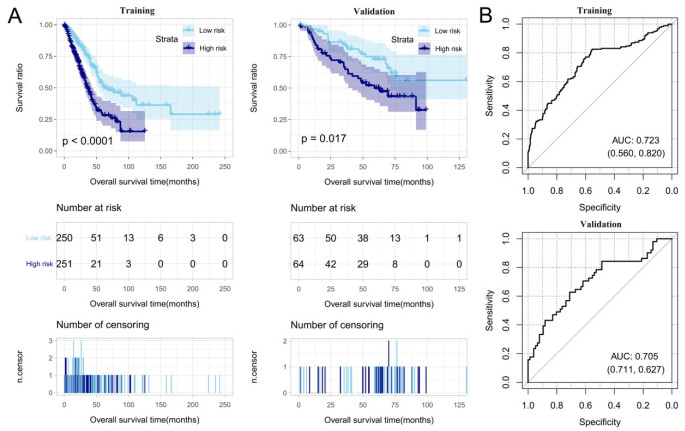
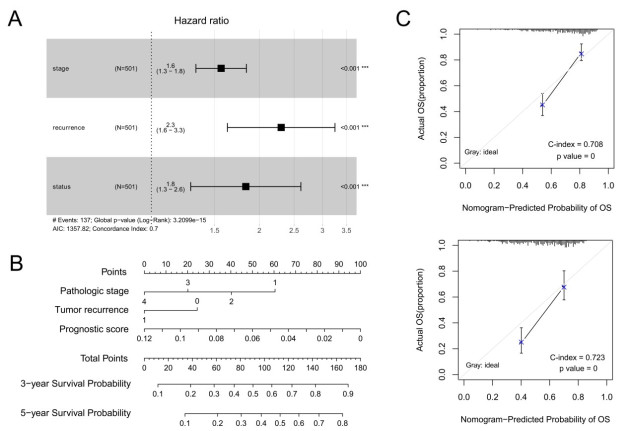
Purpose: Lung adenocarcinoma (LUAD) is a highly lethal subtype of primary lung cancer with a poor prognosis. N6-methyladenosine (m6A), the most predominant form of RNA modification, regulates biological processes and has critical prognostic implications for LUAD. Our study aimed to mine potential target genes of m6A regulators to explore their biological significance in subtyping LUAD and predicting survival. Methods: Using gene expression data from TCGA database, candidate target genes of m6A were predicted from differentially expressed genes (DEGs) in tumor based on M6A2 Target database. The survival-related target DEGs identified by Cox-regression analysis was used for consensus clustering analysis to subtype LUAD. Uni-and multi-variable Cox regression analysis and LASSO Cox-PH regression analysis were used to select the optimal prognostic genes for constructing prognostic score (PS) model. Nomogram encompassing PS score and independent prognostic factors was built to predict 3-year and 5-year survival probability. Results: We obtained 2429 DEGs in tumor tissue, within which, 1267 were predicted to m6A target genes. A prognostic m6A-DEGs network of 224 survival-related target DEGs was established. We classified LUAD into 2 subtypes, which were significantly different in OS time, clinicopathological characteristics, and fractions of 12 immune cell types. A PS model of five genes (C1QTNF6, THSD1, GRIK2, E2F7 and SLCO1B3) successfully split the training set or an independent GEO dataset into two subgroups with significantly different OS time (p < 0.001, AUC = 0.723; p = 0.017, AUC = 0.705).A nomogram model combining PS status, pathologic stage, and recurrence was built, showing good performance in predicting 3-year and 5-year survival probability (C-index = 0.708, 0.723, p-value = 0). Conclusion: Using candidate m6A target genes, we obtained two molecular subtypes and designed a reliable five-gene PS score model for survival prediction in LUAD.
Citation: Xiao Chu, Weiqing Wang, Zhaoyun Sun, Feichao Bao, Liang Feng. An N6-methyladenosine and target genes-based study on subtypes and prognosis of lung adenocarcinoma[J]. Mathematical Biosciences and Engineering, 2022, 19(1): 253-270. doi: 10.3934/mbe.2022013
Purpose: Lung adenocarcinoma (LUAD) is a highly lethal subtype of primary lung cancer with a poor prognosis. N6-methyladenosine (m6A), the most predominant form of RNA modification, regulates biological processes and has critical prognostic implications for LUAD. Our study aimed to mine potential target genes of m6A regulators to explore their biological significance in subtyping LUAD and predicting survival. Methods: Using gene expression data from TCGA database, candidate target genes of m6A were predicted from differentially expressed genes (DEGs) in tumor based on M6A2 Target database. The survival-related target DEGs identified by Cox-regression analysis was used for consensus clustering analysis to subtype LUAD. Uni-and multi-variable Cox regression analysis and LASSO Cox-PH regression analysis were used to select the optimal prognostic genes for constructing prognostic score (PS) model. Nomogram encompassing PS score and independent prognostic factors was built to predict 3-year and 5-year survival probability. Results: We obtained 2429 DEGs in tumor tissue, within which, 1267 were predicted to m6A target genes. A prognostic m6A-DEGs network of 224 survival-related target DEGs was established. We classified LUAD into 2 subtypes, which were significantly different in OS time, clinicopathological characteristics, and fractions of 12 immune cell types. A PS model of five genes (C1QTNF6, THSD1, GRIK2, E2F7 and SLCO1B3) successfully split the training set or an independent GEO dataset into two subgroups with significantly different OS time (p < 0.001, AUC = 0.723; p = 0.017, AUC = 0.705).A nomogram model combining PS status, pathologic stage, and recurrence was built, showing good performance in predicting 3-year and 5-year survival probability (C-index = 0.708, 0.723, p-value = 0). Conclusion: Using candidate m6A target genes, we obtained two molecular subtypes and designed a reliable five-gene PS score model for survival prediction in LUAD.

| [1] |
B. C. Bade, C. S. D. Cruz, Lung cancer 2020: epidemiology, etiology, and prevention, Clin. Chest. Med., 41 (2020), 1-24. doi: 10.1016/j.ccm.2019.10.001. doi: 10.1016/j.ccm.2019.10.001

|
| [2] |
B. D. Hutchinson, G. S. Shroff, M. T. Truong, J. P. Ko, Spectrum of lung adenocarcinoma, Semin. Ultrasound CT MR, 40 (2019), 255-264. doi: 10.1053/j.sult.2018.11.009. doi: 10.1053/j.sult.2018.11.009
|
| [3] |
T. V. Denisenko, I. N. Budkevich, B. Zhivotovsky, Cell death-based treatment of lung adenocarcinoma, Cell Death Dis., 9 (2018), 117. doi: 10.1038/s41419-017-0063-y. doi: 10.1038/s41419-017-0063-y
|
| [4] |
F. R. Hirsch, G. V. Scagliotti, J. L. Mulshine, R. Kwon, W. J. C. Jr, Y. Wu, et al., Lung cancer: current therapies and new targeted treatments, Lancet, 389 (2017), 299-311. doi: 10.1016/S0140-6736(16)30958-8. doi: 10.1016/S0140-6736(16)30958-8
|
| [5] |
L. He, H. Li, A. Wu, Y. Peng, G. Shu, G. Yin, Functions of N6-methyladenosine and its role in cancer, Mol. Cancer, 18 (2019), 176. doi: 10.1186/s12943-019-1109-9. doi: 10.1186/s12943-019-1109-9
|
| [6] |
D. Dai, H. Wang, L. Zhu, H. Jin, X. Wang, N6-methyladenosine links RNA metabolism to cancer progression, Cell Death Dis., 9 (2018), 124.doi: 10.1038/s41419-017-0129-x. doi: 10.1038/s41419-017-0129-x
|
| [7] |
Y. Li, J. Gu, F. Xu, Q. Zhu, Y. Chen, D. Ge, et al., Molecular characterization, biological function, tumor microenvironment association and clinical significance of m6A regulators in lung adenocarcinoma, Brief Bioinform., 22 (2020), bbaa225. doi: 10.1093/bib/bbaa225. doi: 10.1093/bib/bbaa225
|
| [8] |
Y. Zhang, X. Liu, L. Liu, J. Li, Q. Hu, R. Sun, Expression and prognostic significance of m6A-related genes in lung adenocarcinoma, Med. Sci. Monit., 26 (2020), e919644.doi: 10.12659/MSM.919644. doi: 10.12659/MSM.919644
|
| [9] |
F. Li, H. Wang, H. Huang, L. Zhang, D. Wang, Y. Wan, m6A RNA methylation regulators participate in the malignant progression and have clinical prognostic value in lung adenocarcinoma, Front. Genet., 11 (2020), 994. doi: 10.3389/fgene.2020.00994. doi: 10.3389/fgene.2020.00994
|
| [10] |
H. Wang, X. Zhao, Z. Lu, m6A RNA methylation regulators act as potential prognostic biomarkers in lung adenocarcinoma, Front. Genet., 12 (2021), 622233. doi: 10.3389/fgene.2021.622233. doi: 10.3389/fgene.2021.622233
|
| [11] |
J. Zhu, M. Wang, D. Hu, Deciphering N6-methyladenosine-related genes signature to predict survival in lung adenocarcinoma, Biomed Res. Int., 2020 (2020), 2514230. doi: 10.1155/2020/2514230. doi: 10.1155/2020/2514230
|
| [12] |
C. Gao, J. Zhuang, H. Li, C. Liu, C. Zhou, L. Liu, et al., Gene signatures of 6-methyladenine regulators in women with lung adenocarcinoma and development of a risk scoring system: a retrospective study using the cancer genome atlas database, Aging (Albany NY), 13 (2021), 3957-3968. doi: 10.18632/aging.202364. doi: 10.18632/aging.202364
|
| [13] |
Y. Liu, X. Guo, M. Zhao, H. Ao, X. Leng, M. Liu, et al., Contributions and prognostic values of m6A RNA methylation regulators in non-small-cell lung cancer, J. Cell. Physiol., 235 (2020), 6043-6057. doi: 10.1002/jcp.29531. doi: 10.1002/jcp.29531
|
| [14] |
E. Clough, T. Barrett, The gene expression omnibus database, Methods Mol. Biol., 1418 (2016), 93-110. doi: 10.1007/978-1-4939-3578-9_5. doi: 10.1007/978-1-4939-3578-9_5
|
| [15] |
S. D. Der, J. Sykes, M. Pintilie, C. Q. Zhu, D. Strumpf, N. Liu, et al., Validation of a histology-independent prognostic gene signature for early-stage, non-small-cell lung cancer including stage IA patients, J. Thorac. Oncol., 9 (2014), 59-64. doi: 10.1097/jto.0000000000000042. doi: 10.1097/jto.0000000000000042
|
| [16] |
S. Deng, H. Zhang, K. Zhu, X. Li, Y. Ye, R. Li, et al., M6A2target: a comprehensive database for targets of m6A writers, erasers and readers, Brief. Bioinform., 22 (2020). doi: 10.1093/bib/bbaa055. doi: 10.1093/bib/bbaa055
|
| [17] |
M. Kohl, S. Wiese, B. Warscheid, Cytoscape: software for visualization and analysis of biological networks, Methods Mol. Biol. (Clifton, N. J.), 696 (2011), 291-303. doi: 10.3390/ijms18091880. doi: 10.3390/ijms18091880
|
| [18] |
M. D. Wilkerson, D. N. Hayes, ConsensusClusterPlus: a class discovery tool with confidence assessments and item tracking, Bioinformatics, 26 (2010), 1572-1573. doi: 10.1093/bioinformatics/btq170. doi: 10.1093/bioinformatics/btq170
|
| [19] |
B. Chen, M. S. Khodadoust, C. L. Liu, A. M. Newman, A. A. Alizadeh, Profiling tumor infiltrating immune cells with CIBERSORT, Methods Mol. Biol., 1711 (2018), 243-259. doi: 10.1007/978-1-4939-7493-1_12. doi: 10.1007/978-1-4939-7493-1_12
|
| [20] |
S. Huang, C. Yee, T. Ching, H. Yu, L. X. Garmire, A novel model to combine clinical and pathway-based transcriptomic information for the prognosis prediction of breast cancer, PLoS Comput. Biol., 10 (2014), e1003851. doi: 10.1371/journal.pcbi.1003851. doi: 10.1371/journal.pcbi.1003851
|
| [21] |
S. Wang, L. Yang, B. Ci, M. Maclean, D. E. Gerber, G. Xiao, Development and validation of a nomogram prognostic model for SCLC patients, J. Thorac. Oncol., 13 (2018), 1338-1348. doi: 10.1016/j.jtho.2018.05.037. doi: 10.1016/j.jtho.2018.05.037
|
| [22] |
E. Longato, M. Vettoretti, B. Di Camillo, A practical perspective on the concordance index for the evaluation and selection of prognostic time-to-event models, J. Biomed. Inform., 108 (2020), 103496. doi: 10.1016/j.jbi.2020.103496. doi: 10.1016/j.jbi.2020.103496
|
| [23] |
M. E. Ritchie, B. Phipson, D. Wu, Y. Hu, C. W. Law, W. Shi, Limma powers differential expression analyses for RNA-sequencing and microarray studies, Nucleic Acids Res., 43 (2015), e47-e47. doi: 10.1093/nar/gkv007. doi: 10.1093/nar/gkv007
|
| [24] |
L. Yang, L. Xu, Q. Wang, M. Wang, G. An, Dysregulation of long non-coding RNA profiles in human colorectal cancer and its association with overall survival, Oncol. Lett., 12 (2016), 4068-4074. doi: 10.3892/ol.2016.5138. doi: 10.3892/ol.2016.5138
|
| [25] |
P. Wang, Y. Wang, B. Hang, X. Zou, J. H. Mao, A novel gene expression-based prognostic scoring system to predict survival in gastric cancer, Oncotarget, 7 (2016), 55343-55351. doi: 10.18632/oncotarget.10533. doi: 10.18632/oncotarget.10533
|
| [26] |
Z. Zhang, M. W. Kattan, Drawing nomograms with R: applications to categorical outcome and survival data, Ann. Transl. Med., 5 (2017). doi: 10.21037/atm.2017.04.01. doi: 10.21037/atm.2017.04.01
|
| [27] |
Q. Lan, P. Y. Liu, J. Haase, J. L. Bell, S. Hüttelmaier, T. Liu, The critical role of RNA m6A methylation in cancer, Cancer Res., 79 (2019), 1285-1292. doi: 10.1158/0008-5472.CAN-18-2965. doi: 10.1158/0008-5472.CAN-18-2965
|
| [28] |
R. Xu, G. Pang, Q. Zhao, L. Yang, S. Chen, L. Jiang, The momentous role of N6-methyladenosine in lung cancer, J. Cell. Physiol., 236 (2021), 3244-3256. doi: 10.1002/jcp.30136. doi: 10.1002/jcp.30136
|
| [29] |
S. Ma, C. Chen, X. Ji, J. Liu, Q. Zhou, G. Wang, et al., The interplay between m6A RNA methylation and noncoding RNA in cancer, J. Hematol. Oncol., 12 (2019), 121. doi: 10.1186/s13045-019-0805-7. doi: 10.1186/s13045-019-0805-7
|
| [30] |
Q. Wang, M. Li, M. Yang, Y. Yang, F. Song, W. Zhang, et al., Analysis of immune-related signatures of lung adenocarcinoma identified two distinct subtypes: implications for immune checkpoint blockade therapy, Aging (Albany NY), 12 (2020), 3312-3339. doi: 10.18632/aging.102814. doi: 10.18632/aging.102814
|
| [31] |
M. Han, B. Wang, M. Zhu, Y. Zhang, C1QTNF6 as a novel biomarker regulates cellular behaviors in A549 cells and exacerbates the outcome of lung adenocarcinoma patients, in vitro Cell. Dev. Biol. Animal, 55 (2019), 614-621. doi: 10.1007/s11626-019-00377-w. doi: 10.1007/s11626-019-00377-w
|
| [32] |
W. Zhang, Y. Shen, G. Feng, Predicting the survival of patients with lung adenocarcinoma using a four-gene prognosis risk model, Oncol. Lett., 18 (2019), 535-544. doi: 10.3892/ol.2019.10366. doi: 10.3892/ol.2019.10366
|
| [33] |
W. Zhang, G. Feng, C1QTNF6 regulates cell proliferation and apoptosis of NSCLC in vitro and in vivo, Biosci. Rep., 41 (2021). doi: 10.1042/BSR20201541. doi: 10.1042/BSR20201541
|
| [34] |
C. S. Wu, Y. J. Lu, H. P. Li, C. Hsueh, C. Y. Lu, Y. Leu, et al., Glutamate receptor, ionotropic, kainate 2 silencing by DNA hypermethylation possesses tumor suppressor function in gastric cancer, Int. J. Cancer, 126 (2010), 2542-2552. doi: 10.1002/ijc.24958. doi: 10.1002/ijc.24958
|
| [35] |
R. Inoue, Y. Hirohashi, H. Kitamura, S. Nishida, A. Murai, A. Takaya, GRIK2 has a role in the maintenance of urothelial carcinoma stem-like cells, and its expression is associated with poorer prognosis, Oncotarget, 8 (2017), 28826-28839. doi: 10.18632/oncotarget.16259. doi: 10.18632/oncotarget.16259
|
| [36] |
L. Di Stefano, M. R. Jensen, K. Helin, E2F7, a novel E2F featuring DP-independent repression of a subset of E2F-regulated genes, Embo J., 22 (2003), 6289-6298. doi: 10.1093/emboj/cdg613. doi: 10.1093/emboj/cdg613
|
| [37] |
N. S. Moon, N. Dyson, E2F7 and E2F8 keep the E2F family in balance, Dev. Cell., 14 (2008), 1-3. doi: 10.1016/j.devcel.2007.12.017. doi: 10.1016/j.devcel.2007.12.017
|
| [38] |
X. Wu, Z. Sui, H. Zhang, Y. Wang, Z. Yu, Integrated analysis of lncRNA-mediated ceRNA network in lung adenocarcinoma, Front. Oncol., 10 (2020), 554759. doi: 10.3389/fonc.2020.554759. doi: 10.3389/fonc.2020.554759
|
| [39] |
B. Hagenbuch, P. J. Meier, The superfamily of organic anion transporting polypeptides, Biochim. Bioph. Acta, 1609 (2003), 1-18. doi: 10.1016/s0005-2736(02)00633-8. doi: 10.1016/s0005-2736(02)00633-8
|
| [40] |
T. Tang, G. Wang, S. Liu, Z, Zhang, C. Liu, F. Li, et al., Highly expressed SLCO1B3 inhibits the occurrence and development of breast cancer and can be used as a clinical indicator of prognosis, Sci. Rep., 11 (2021), 631. doi: 10.1038/s41598-020-80152-0. doi: 10.1038/s41598-020-80152-0
|
| [41] |
H. Hase, M. Aoki, K. Matsumoto, S. Nakai, T. Nagata, A. Takeda, et al., Cancer type-SLCO1B3 promotes epithelial-mesenchymal transition resulting in the tumour progression of non-small cell lung cancer, Oncol. Rep., 45 (2021), 309-316. doi: 10.3892/or.2020.7839. doi: 10.3892/or.2020.7839
|
| [42] |
M. Nagai, T. Furihata, S. Matsumoto, S. Ishii, S. Motohashi, I. Yoshino, et al., Identification of a new organic anion transporting polypeptide 1B3 mRNA isoform primarily expressed in human cancerous tissues and cells, Biochem. Bioph. Res. Commun., 418 (2012), 818-823. doi: 10.1016/j.bbrc.2012.01.115. doi: 10.1016/j.bbrc.2012.01.115
|
| [43] |
J. M. Ko, P. L. Chan, W. L. Yau, H. K. Chan, K. C. Chan, Z. Y. Yu, et al., Monochromosome transfer and microarray analysis identify a critical tumor-suppressive region mapping to chromosome 13q14 and THSD1 in esophageal carcinoma, Mol. Cancer Res., 6 (2008), 592-603. doi: 10.1158/1541-7786.MCR-07-0154. doi: 10.1158/1541-7786.MCR-07-0154
|
| [44] |
W. He, D. Ju, Z. Jie, A. Zhang, X. Xing, Q. Yang, Aberrant CpG-methylation affects genes expression predicting survival in lung adenocarcinoma, Cancer Med., 7 (2018), 5716-5726. doi: 10.1002/cam4.1834. doi: 10.1002/cam4.1834
|
| [45] |
A. D. Patterson, F. J. Gonzalez, G. H. Perdew, J. M. Peters, Molecular regulation of carcinogenesis: friend and foe, Toxicol. Sci., 165 (2018), 277-283. doi: 10.1093/toxsci/kfy185. doi: 10.1093/toxsci/kfy185
|
Figures(9) / Tables(5)

Xiao Chu, Weiqing Wang, Zhaoyun Sun, Feichao Bao, Liang Feng. An N6-methyladenosine and target genes-based study on subtypes and prognosis of lung adenocarcinoma[J]. Mathematical Biosciences and Engineering, 2022, 19(1): 253-270. doi: 10.3934/mbe.2022013


 DownLoad: