Segmentation and visualization of liver vessel is a key task in preoperative planning and computer-aided diagnosis of liver diseases. Due to the irregular structure of liver vessel, accurate liver vessel segmentation is difficult. This paper proposes a method of liver vessel segmentation based on an improved V-Net network. Firstly, a dilated convolution is introduced into the network to make the network can still enlarge the receptive field without reducing down-sampling and save detailed spatial information. Secondly, a 3D deep supervision mechanism is introduced into the network to speed up the convergence of the network and help the network learn semantic features better. Finally, inter-scale dense connections are designed in the decoder of the network to prevent the loss of high-level semantic information during the decoding process and effectively integrate multi-scale feature information. The public datasets 3Dircadb were used to perform liver vessel segmentation experiments. The average dice and sensitivity of the proposed method reached 71.6 and 75.4%, respectively, which are higher than those of the original network. The experimental results show that the improved V-Net network can automatically and accurately segment labeled or even other unlabeled liver vessels from the CT images.
Citation: Jinzhu Yang, Meihan Fu, Ying Hu. Liver vessel segmentation based on inter-scale V-Net[J]. Mathematical Biosciences and Engineering, 2021, 18(4): 4327-4340. doi: 10.3934/mbe.2021217
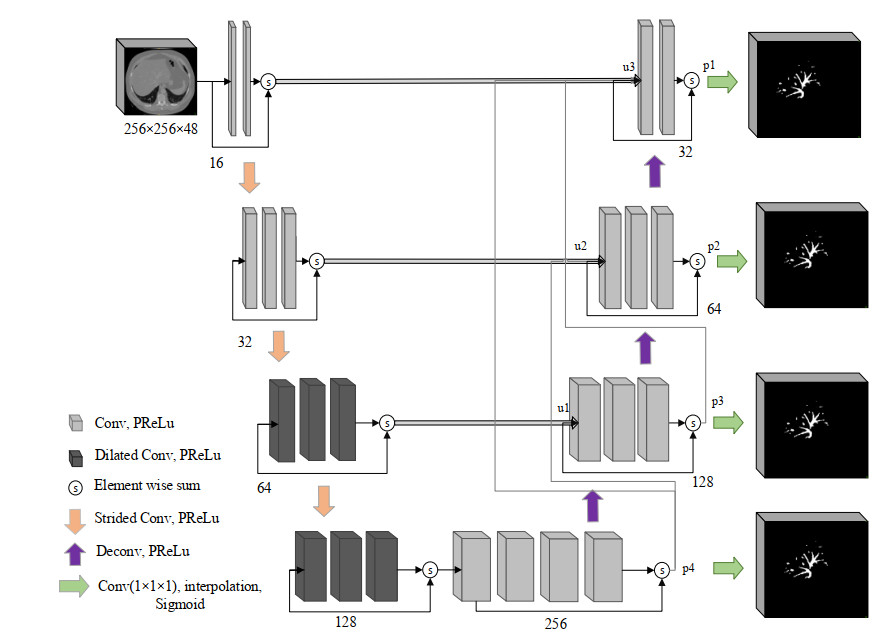
Segmentation and visualization of liver vessel is a key task in preoperative planning and computer-aided diagnosis of liver diseases. Due to the irregular structure of liver vessel, accurate liver vessel segmentation is difficult. This paper proposes a method of liver vessel segmentation based on an improved V-Net network. Firstly, a dilated convolution is introduced into the network to make the network can still enlarge the receptive field without reducing down-sampling and save detailed spatial information. Secondly, a 3D deep supervision mechanism is introduced into the network to speed up the convergence of the network and help the network learn semantic features better. Finally, inter-scale dense connections are designed in the decoder of the network to prevent the loss of high-level semantic information during the decoding process and effectively integrate multi-scale feature information. The public datasets 3Dircadb were used to perform liver vessel segmentation experiments. The average dice and sensitivity of the proposed method reached 71.6 and 75.4%, respectively, which are higher than those of the original network. The experimental results show that the improved V-Net network can automatically and accurately segment labeled or even other unlabeled liver vessels from the CT images.

| [1] | W. Chen, R. Zheng, P. D. Baade, S. Zhang, H. Zeng, F. Bray, et al., Cancer statistics in China, 2015, CA A Cancer J. Clin., 66 (2016), 115-132. |
| [2] |
H. W. Huang, Influence of blood vessel on the thermal lesion formation during radiofrequency ablation for liver tumors, Med. Phys., 40 (2013), 073303. doi: 10.1118/1.4811135

|
| [3] |
S. Moccia, E. D. Momi, S. E. Hadji, L. S. Mattos, Blood vessel segmentation algorithms-review of methods, datasets, and evaluation metrics, Comput. Methods Programs Biomed., 158 (2018), 71-91. doi: 10.1016/j.cmpb.2018.02.001
|
| [4] |
D. A. Oliveira, R. Q. Feitosa, M. M. Correia, Segmentation of liver, its vessels and lesions from CT images for surgical planning, Biomed. Eng. Online, 10 (2011), 30. doi: 10.1186/1475-925X-10-30
|
| [5] |
Y. Chi, J. Liu, S. K. Venkatesh, S. Huang, J. Zhou, Q. Tian, et al., Segmentation of liver vasculature from contrast enhanced CT images using context-based voting, IEEE Trans. Biomed. Eng., 58 (2011), 2144-2153. doi: 10.1109/TBME.2010.2093523
|
| [6] |
A. Foruzan, R. Zoroofi, Y. Sato, M. Hori, A Hessian-based filter for vascular segmentation of noisy hepatic CT scans, Int. J. Comput. Assisted Radiol. Surg., 7 (2012), 199-205. doi: 10.1007/s11548-011-0640-y
|
| [7] | J. Li, M. Zhang, Y. Gao, Vessel segmentation of liver CT images by hessian-based enhancement, in International Conference on Image and Graphics, (2019), 442-445. |
| [8] | H. Zhang, P. Bai, X. Min, Q. Liu, Y. Ren, H. Li, et al., Hepatic vessel segmentation based on an improved 3D region growing algorithm, J. Phys., 1486 (2020), 032038. |
| [9] |
Y. Z. Zeng, Y. Q. Zhao, P. Tang, M. Liao, Y. X. Liang, S. H. Liao, et al., Liver vessel segmentation and identification based on oriented flux symmetry and graph cuts, Comput. Methods Programs Biomed., 150 (2017), 31-39. doi: 10.1016/j.cmpb.2017.07.002
|
| [10] |
S. Cetin, G. Unal, A higher-order tensor vessel tractography for segmentation of vascular structures, IEEE Trans. Med. Imaging, 34 (2015), 2172-2185. doi: 10.1109/TMI.2015.2425535
|
| [11] |
Y. Z. Zeng, S. H. Liao, P. Tang, Y. Q. Zhao, M. Liao, Y. Chen, et al., Automatic liver vessel segmentation using 3D region growing and hybrid active contour model, Comput. Biol. Med., 97 (2018), 63-73. doi: 10.1016/j.compbiomed.2018.04.014
|
| [12] | T. Kitrungrotsakul, X. H. Han, Y. Iwamoto, A. H. Foruzan, L. Lin, Y. W. Chen, Robust hepatic vessel segmentation using multi deep convolution network, in Medical Imaging 2017: Biomedical Applications in Molecular, Structural, and Functional Imaging. International Society for Optics and Photonics, (2017), 1013711. |
| [13] | O. Ronneberger, P. Fischer, T. Brox, U-Net: Convolutional networks for biomedical image segmentation, in Proceedings of International Conference on Medical Image Computing and Computer-Assisted Intervention, (2015), 234-241. |
| [14] | Ö. Çiçek, A. Abdulkadir, S. S. Lienkamp, T. Brox, O. Ronneberger, 3D U-Net: Learning dense volumetric segmentation from sparse annotation, in Medical Image Computing and Computer- assisted Intervention-MICCAI 2016: 19th International Conference, (2016), 424-432. |
| [15] | F. Milletari, N. Navab, S. A. Ahmadi, V-Net: Fully convolutional neural networks for volumetric medical image segmentation, in Fourth International Conference on 3D Vision (3DV), (2016), 565-571. |
| [16] | W. Yu, B. Fang, Y. Liu, M. Gao, S. Zheng, Y. Wang, Liver vessels segmentation based on 3d residual U-NET, in International Conference on Image Processing (ICIP), (2019), 250-254. |
| [17] | M. Xu, Y. Wang, Y. Chi, X. Hua, Training liver vessel segmentation deep neural networks on noisy labels from contrast CT imaging, in 2020 IEEE 17th International Symposium on Biomedical Imaging (ISBI), Iowa City, (2020), 1552-1555. |
| [18] |
Q. Huang, J. Sun, H. Ding, X. Wang, G. Wang, Robust liver vessel extraction using 3D U-Net with variant dice loss function, Comput. Biol. Med., 101 (2018), 153-162. doi: 10.1016/j.compbiomed.2018.08.018
|
| [19] | Q. Dou, H. Chen, Y. Jin, L. Yu, J. Qin, P. A. Heng, 3D deeply supervised network for automatic liver segmentation from CT volumes, in Medical Image Computing and Computer-Assisted Intervention-MICCAI 2016-19th International Conference, (2016), 149-157. |
| [20] | F. Isensee, J. Petersen, A. Klein, D. Zimmerer, P. F. Jaeger, S. Kohl, et al., nnU-Net: Self-adapting framework for U-Net-based medical image segmentation, preprint, arXiv: 1809.10486. |
| [21] |
A. Pepe, J. Li, M. R. Pissarczyk, C. Gsaxner, C. Xiaojun, G. A. Holzapfel, et al., Detection, segmentation, simulation and visualization of aortic dissections: A review, Med. Image Anal., 65 (2020), 101773. doi: 10.1016/j.media.2020.101773
|


Figures(7) / Tables(3)

Jinzhu Yang, Meihan Fu, Ying Hu. Liver vessel segmentation based on inter-scale V-Net[J]. Mathematical Biosciences and Engineering, 2021, 18(4): 4327-4340. doi: 10.3934/mbe.2021217


 DownLoad: