Medical science heavily depends on image acquisition and post-processing for accurate diagnosis and treatment planning. The introduction of noise degrades the visual quality of the medical images during the capturing process, which may result in false perception. Therefore, medical image enhancement is an essential topic of research for the improvement of image quality. In this paper, a clustering-based contrast enhancement technique is presented for computed tomography (CT) images. Our approach uses the recursive splitting of data into clusters targeting the maximum error reduction in each cluster. This leads to grouping similar pixels in every cluster, maximizing inter-cluster and minimizing intra-cluster similarities. A suitable number of clusters can be chosen to represent high precision data with the desired bit-depth. We use 256 clusters to convert 16-bit CT scans to 8-bit images suitable for visualization on standard low dynamic range displays. We compare our method with several existing contrast enhancement algorithms and show that the proposed technique provides better results in terms of execution efficiency and quality of enhanced images.
Citation: Anam Mehmood, Ishtiaq Rasool Khan, Hassan Dawood, Hussain Dawood. A non-uniform quantization scheme for visualization of CT images[J]. Mathematical Biosciences and Engineering, 2021, 18(4): 4311-4326. doi: 10.3934/mbe.2021216
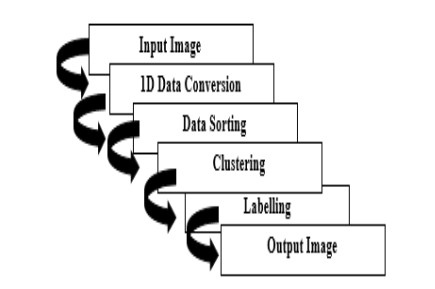
Medical science heavily depends on image acquisition and post-processing for accurate diagnosis and treatment planning. The introduction of noise degrades the visual quality of the medical images during the capturing process, which may result in false perception. Therefore, medical image enhancement is an essential topic of research for the improvement of image quality. In this paper, a clustering-based contrast enhancement technique is presented for computed tomography (CT) images. Our approach uses the recursive splitting of data into clusters targeting the maximum error reduction in each cluster. This leads to grouping similar pixels in every cluster, maximizing inter-cluster and minimizing intra-cluster similarities. A suitable number of clusters can be chosen to represent high precision data with the desired bit-depth. We use 256 clusters to convert 16-bit CT scans to 8-bit images suitable for visualization on standard low dynamic range displays. We compare our method with several existing contrast enhancement algorithms and show that the proposed technique provides better results in terms of execution efficiency and quality of enhanced images.

| [1] |
J. Hu, J. Lu, Y. P. Tan, Sharable and individual multi-view metric learning, IEEE Transact. Pattern Anal. Machine Intell., 40 (2018), 2281-2288. doi: 10.1109/TPAMI.2017.2749576

|
| [2] | Z. Al-Ameen, S. Al-Ameen, G. Sulong, Latest methods of image enhancement and restoration for computed tomography: A concise review, Appl. Med. Inform., 36 (2015), 1-12. |
| [3] |
B. Subramani, M. Veluchamy, Fuzzy gray level difference histogram equalization for medical image enhancement, J. Med. Syst., 44 (2020), 1-10. doi: 10.1007/s10916-019-1451-x
|
| [4] |
D. Y. Johnson, A. E. Farjat, F. Vernuccio, L. M. Hurwitz, R. C. Nelson, D. Marin, Evaluation of intraindividual contrast enhancement variability for determining the maximum achievable consistency in CT, Am. J. Roentgenol., 214 (2020), 18-23. doi: 10.2214/AJR.19.21628
|
| [5] |
X. Li, T. Li, H. Zhao, Y. Dou, C. Pang, Medical image enhancement in F-shift transformation domain, Health Inform. Sci. Syst., 7 (2019), 1-8. doi: 10.1007/s13755-018-0062-0
|
| [6] |
L. Jiang, S. Ye, X. Yang, X. Ma, L. Lu, A. Ahmad, G. Jeon, An adaptive anchored neighborhood regression method for medical image enhancement, Multimed. Tools Appl. 79 (2020), 10533-10550. doi: 10.1007/s11042-019-08353-y
|
| [7] |
Y. Zhou, J. Ye, Y. Du, F. R. Sheykhahmad, New improved optimized method for medical image enhancement based on modified shark smell optimization algorithm, Sens. Imag. 21 (2020), 1-22. doi: 10.1007/s11220-019-0262-y
|
| [8] | P. Senthil, M. Suganya, I. Baidari, S. P. Sajjan, Enhancement Sushisen algorithms in images analysis technologies to increase computerized tomography images, Int. J. Inform. Technol., (2020), 1-13. |
| [9] | V. N. Prudhvi Raj, Denoising of medical images using total variational method, Signal Image Process. Int. J., 3 (2012), 131-142. |
| [10] | A. Saha, F. I. Tushar, K. Faryna, V. M. D'Anniballe, R. Hou, M. A. Mazurowski, et al., Weakly supervised 3D classification of chest CT using aggregated multi-resolution deep segmentation features, Med. Imag. 2020 Computer-Aid. Diagn., 11314 (2020), 1131408. |
| [11] |
H. Moradmand, S. Setayeshi, A. R. Karimian, M. Sirous, M. E. Akbari, Comparing the performance of image enhancement methods to detect microcalcification clusters in digital mammography, Iran. J. Cancer Prevent., 5 (2012), 61-68. doi: 10.1158/1940-6207.CAPR-11-0337
|
| [12] | A. F. M. Hani, D. Kumar, A. S. Malik, R. Razak, Physiological assessment of in vivo human knee articular cartilage using sodium MR imaging at 1.5T, Magnet. Reson. Imag., 31 (2013), 1059-1067. |
| [13] |
C. M. Chen, C. C. Chen, M. C. Wu, G. Horng, H. C. Wu, S. H. Hsueh, H. Y. Ho, Automatic contrast enhancement of brain MR images using hierarchical correlation histogram analysis, J. Med. Biol. Eng., 35 (2015), 724-734. doi: 10.1007/s40846-015-0096-6
|
| [14] |
Y. Duan, J. Lu, Z. Wang, J. Feng, J. Zhou, Learning deep binary descriptor with multi-quantization, IEEE Transact. Pattern Anal. Mach.Intell., 41 (2019), 1924-1938. doi: 10.1109/TPAMI.2018.2858760
|
| [15] |
R. Chouhan, P. K. Biswas, R. K. Jha, Enhancement of low-contrast images by internal noise-induced Fourier coefficient rooting, Signal Image Video Process., 9 (2015), 255-263. doi: 10.1007/s11760-015-0812-2
|
| [16] | D. J. Vincent, V. S. Hari, A. Muhammed Reshin, Edge enhancement and noise smoothening of CT images with anisotropic diffusion filter and unsharp masking, IEEE Recent Advances in Intelligent Computational Systems, (2018), 55-59. |
| [17] | F. Kallel, A. Ben Hamida, A new adaptive gamma correction based algorithm using DWT-SVD for non-contrast CT image enhancement, IEEE Transact. Nanobiosci., 16 (2017), 666-675. |
| [18] | Y. W. Chen, C. T. Shih, H. H. Lin, K. S. Chuang, Physical model-based contrast enhancement of computed tomography images: Contrast enhancement of computed tomography, IEEE International Conference on Bioinformatics and Bioengineering, (2016), 238-241. |
| [19] | R. Rajendran, S. Agaian, K. Panetta, P. Rad, A Novel Technique to Enhance Low Resolution CT and Magnetic Resonance Images in Cloud, IEEE International Conference on Smart Cloud, SmartCloud, (2016), 73-78. |
| [20] |
N. Otsu, A threshold selection method from gray-level histograms, IEEE Transact. Syst. Man. Cybern., SMC-9 (1979), 62-66. doi: 10.1109/TSMC.1979.4310076
|
| [21] | A. Kaur, A. Girdhar, N. Kanwal, Region of interest based contrast enhancement techniques for CT images, International Conference on Computational Intelligence and Communication Technology (CICT), (2016), 60-63. |
| [22] |
H. T. Wu, J. Huang, Y. Q. Shi, A reversible data hiding method with contrast enhancement for medical images, J. Visual Commun. Image Represent., 31 (2015), 146-153. doi: 10.1016/j.jvcir.2015.06.010
|
| [23] | S. H. Malik, T. A. Lone, S. M. K. Quadri, Contrast enhancement and smoothing of CT images for diagnosis, International Conference on Computing for Sustainable Global Development, (2015), 2214-2219. |
| [24] | T. Y. Yangdai, L. Zhang, Weighted Retinex algorithm based on histogram for dental CT image enhancement, IEEE Nuclear Science Symposium and Medical Imaging Conference, (2014), 1-4. |
| [25] | V. T. An, N. T. Hai, Enhancement of CT image using image fusion, International Conference on Advanced Technologies for Communications, (2013), 574-579. |
| [26] | T. L. Tan, K. S. Sim, A. K. Chong, Contrast enhancement of CT brain images for detection of ischemic stroke, International Conference on Biomedical Engineering, (2012), 385-388. |
| [27] | A. K. Bhandari, M. Gadde, A. Kumar, G. K. Singh, Comparative analysis of different wavelet filters for low contrast and brightness enhancement of multispectral remote sensing images, International Conference on Machine Vision and Image Processing, (2012), 81-86. |
| [28] |
M. Sundaram, K. Ramar, N. Arumugam, G. Prabin, Histogram modified local contrast enhancement for mammogram images, Appl. Soft Comput. J., 11 (2011), 5809-5816. doi: 10.1016/j.asoc.2011.05.003
|
| [29] | B. Ganesan, G. Yamuna, S. K. Suman, Hybrid Contrast Enhancement Approach for Medical Image | Semantic Scholar, Proceedings on National Conference on Emerging Trends in Information & Communication Technology, (2013), 1-12. |
| [30] | R. A. L. Al-Juboori, Contrast enhancement of the mammographic image using Retinex with CLAHE methods, Iraqi J. Sci. 58 (2017), 327-336, |
| [31] | C. E. Kahn, J. A. Carrino, M. J. Flynn, D. J. Peck, S. C. Horii, DICOM and radiology: Past, present, and future, J. Am. College Radiol., 4 (2007), 652-657. |
| [32] |
C. Zhao, Z. Wang, H. Li, X. Wu, S. Qiao, J. Sun, A new approach for medical image enhancement based on luminance-level modulation and gradient modulation, Biomed. Signal Process. Control, 48 (2019), 189-196. doi: 10.1016/j.bspc.2018.10.008
|
| [33] | Y. Tang, J. Cai, L. Lu, A.P. Harrison, K. Yan, J. Xiao, et al., CT image enhancement using stacked generative adversarial networks and transfer learning for lesion segmentation improvement, Machine Learning in Medical Imaging (Lecture Notes in Computer Science), 11046, Springer Verlag, (2018), 46-54. |
| [34] | Q. Chen, Z. Yuan, C. Zhou, W. Zhang, M. Zhang, Y. Yang, et al., Low-dose dental CT image enhancement using a multiscale feature sensing network, Nuclear Instruments and Methods in Physics Research, Section A: Accelerators, Spectrometers, Detectors and Associated Equipment, 981 (2020), 164530. |
| [35] | R. Naseem, F. A. Cheikh, A. Beghdadi, O. J. Elle, F. Lindseth, Cross modality guided liver image enhancement of CT using MRI, European Workshop on Visual Information Processing, (2019), 46-51. |
| [36] | Z. Al-Ameen, G. Sulong, M. G. M. Johar, Enhancing the contrast of CT medical images by employing a novel image size dependent normalization technique, Int. J. Bio-Sci. Bio-Technol., 4 (2012), 63-68. |
| [37] |
A. Gandhamal, S. Talbar, S. Gajre, A. F. M. Hani, D. Kumar, Local gray level S-curve transformation - A generalized contrast enhancement technique for medical images, Computers Biol. Med., 83 (2017), 120-133. doi: 10.1016/j.compbiomed.2017.03.001
|
| [38] |
H. Li, X. Jia, L. Zhang, Clustering based content and color adaptive tone mapping, Computer Vision Image Understand. 168 (2018), 37-49. doi: 10.1016/j.cviu.2017.11.001
|
| [39] |
D. Völgyes, A. C. T. Martinsen, A. Stray-Pedersen, D. Waaler, M. Pedersen, A weighted histogram-based tone mapping algorithm for CT images, Algorithms, 11 (2018), 111. doi: 10.3390/a11080111
|
| [40] |
J. Kalpathy-Cramer, J. B. Freymann, J. S. Kirby, P. E. Kinahan, A. F. W. Prior, Quantitative imaging network: Data sharing and competitive algorithm validation leveraging the cancer imaging archive, Translat. Oncol., 7 (2014), 147-152. doi: 10.1593/tlo.13862
|
| [41] | M. H. Kim, J. Kautz, Consistent tone reproduction, IASTED Conference on Computer Graphics and Imaging, (2008), 152-159. |
| [42] |
I. R. Khan, S. Rahardja, M. M. Khan, M. M. Movania, F. Abed, A tone-mapping technique based on histogram using a sensitivity model of the human visual system, IEEE Transact. Industr. Electron., 65 (2018), 3469-3479. doi: 10.1109/TIE.2017.2760247
|
| [43] |
E. Reinhard, K. Devlin, Dynamic range reduction inspired by photoreceptor physiology, IEEE Transact. Visual. Computer Graph., 11 (2005), 13-24. doi: 10.1109/TVCG.2005.9
|
| [44] | T. Shibata, M. Tanaka, M. Okutomi, Gradient-Domain Image Reconstruction Framework with Intensity-Range and Base-Structure Constraints, IEEE Conference on Computer Vision and Pattern Recognition (CVPR), (2016), 2745-2753. |
| [45] | Z. Liang, J. Xu, D. Zhang, Z. Cao, L. Zhang, A Hybrid l1-l0 Layer Decomposition Model for Tone Mapping, IEEE Conference on Computer Vision and Pattern Recognition (CVPR), Jun. 2018, 4758-4766. |


Figures(9) / Tables(1)

Anam Mehmood, Ishtiaq Rasool Khan, Hassan Dawood, Hussain Dawood. A non-uniform quantization scheme for visualization of CT images[J]. Mathematical Biosciences and Engineering, 2021, 18(4): 4311-4326. doi: 10.3934/mbe.2021216


 DownLoad: