To investigate the biomechanical responses of the human cornea after small incision lenticule extraction (SMILE) procedures, especially their effects of SMILE surgery on stress and strain.
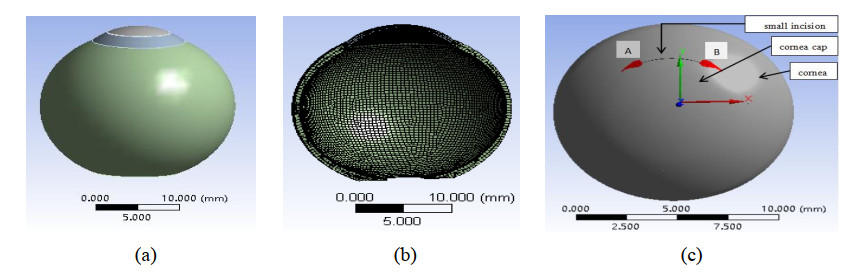
Based on finite element analysis, a three-dimensional (3D) model of the human eye was established to simulate SMILE refractive surgery procedures. Stress and strain values were calculated by inputting the intraocular pressure (IOP).
After SMILE refractive surgery procedures, the stress and strain of the anterior and posterior corneal surfaces were significantly increased. The equivalent stress and strain on the anterior and posterior corneal surfaces increased with increasing diopter and were concentrated in the central area, whereas the values of stress and strain at the incision site on the anterior surface of the cornea were approximately 0. Compared with the anterior corneal surface, the stress and strain of the posterior surface were larger. Increasing IOP caused an approximately linear change in stress and a nonlinear increase in corneal strain. In addition, we found that the incision sizes and direction had less of an influence on stress and strain. In summary, SMILE surgery increased the equivalent stress and strain on the human cornea.
The equivalent stress and strain of the anterior and posterior human corneal surfaces increased after SMILE refractive surgery; these increases were particularly noticeable on the posterior surface of the cornea.
Citation: Yinyu Song, Lihua Fang, Qinyue Zhu, Ruirui Du, Binhui Guo, Jiahui Gong, Jixia Huang. Biomechanical responses of the cornea after small incision lenticule extraction (SMILE) refractive surgery based on a finite element model of the human eye[J]. Mathematical Biosciences and Engineering, 2021, 18(4): 4212-4225. doi: 10.3934/mbe.2021211
To investigate the biomechanical responses of the human cornea after small incision lenticule extraction (SMILE) procedures, especially their effects of SMILE surgery on stress and strain.
Based on finite element analysis, a three-dimensional (3D) model of the human eye was established to simulate SMILE refractive surgery procedures. Stress and strain values were calculated by inputting the intraocular pressure (IOP).
After SMILE refractive surgery procedures, the stress and strain of the anterior and posterior corneal surfaces were significantly increased. The equivalent stress and strain on the anterior and posterior corneal surfaces increased with increasing diopter and were concentrated in the central area, whereas the values of stress and strain at the incision site on the anterior surface of the cornea were approximately 0. Compared with the anterior corneal surface, the stress and strain of the posterior surface were larger. Increasing IOP caused an approximately linear change in stress and a nonlinear increase in corneal strain. In addition, we found that the incision sizes and direction had less of an influence on stress and strain. In summary, SMILE surgery increased the equivalent stress and strain on the human cornea.
The equivalent stress and strain of the anterior and posterior human corneal surfaces increased after SMILE refractive surgery; these increases were particularly noticeable on the posterior surface of the cornea.

| [1] | J. Wang, X. Xun, D. O. Ophthalmology, S. G. Hospital, Environmental risk factors for myopia and advances in its control and prevention, Shanghai Med. Pharm. J., 38 (2017), 3-7. |
| [2] |
M. Kohlhaas, Corneal sensation after cataract and refractive surgery, J. Cataract Refract. Surg., 24 (1998), 1399-1409. doi: 10.1016/S0886-3350(98)80237-X

|
| [3] | D. Z. Reinstein, T. J. Archer, M. Gobbe, The Key characteristics of corneal refractive surgery: biomechanics, spherical aberration, and corneal sensitivity after SMILE, in Small Incision Lenticule Extraction (SMILE), Springer, Cham, (2015), 123-142. |
| [4] |
A. Gyldenkerne, A. Ivarsen, J. Hjortdal, Comparison of corneal shape changes and aberrations induced By FS-LASIK and SMILE for myopia, J. Refractive Surg., 31 (2015), 223-229. doi: 10.3928/1081597X-20150303-01
|
| [5] | P. Wei, G. P. Cheng, J. Zhang, A.L. Ng, Y. Wang, Changes in corneal volume at different areas and its correlation with corneal biomechanics after SMILE and FS-LASIK surgery, J. Ophthalmol., 2020 (2020), 1-7. |
| [6] | G. Scarcelli, S. H. Yun, Brillouin scanning microscopy in keratoconus, in Keratoconus: Recent Advances in Diagnosis and Treatment, Springer International Publishing, (2017), 167-173. |
| [7] |
N. Cartwright, J. R. Tyrer, P. D. Jaycock, J. Marshall, Effects of variation in depth and side cut angulations in LASIK and thin-flap LASIK using a femtosecond laser: a biomechanical study, J. Refractive Surg., 28 (2012), 419-425. doi: 10.3928/1081597X-20120518-07
|
| [8] | D. V. Franus, Change in the stress-strain state of the cornea after refractive surgery, in 2015 International Conference on Mechanics-Seventh Polyakhov's Reading, IEEE, (2015), 1-4. |
| [9] |
J. C. He, J. Gwiazda, F. Thorn, R. Held, Wave-front aberrations in the anterior corneal surface and the whole eye, J. Opt. Soc. Am. A, 20 (2003), 1155-1163. doi: 10.1364/JOSAA.20.001155
|
| [10] |
A. S. Roy, W. J. Dupps, Effects of altered corneal stiffness on native and postoperative LASIK corneal biomechanical behavior: a whole-eye finite element analysis, J. Refractive Surge., 25 (2009), 875-887. doi: 10.3928/1081597X-20090917-09
|
| [11] | K. J. Bathe, D. Chapelle, Computational Fluid And Solid Mechanics: the Finite Element Analysis of Shells- Fundamentals, Springer, 2003. |
| [12] | M. Á. Ariza-Gracia, J. F. Zurita, D. P. Pinero, J. F. Rodriguez, Coupled biomechanical response of the cornea assessed by non-contact tonometry, a simulation study, PLOS ONE, 10 (2015), e0121486. |
| [13] |
M. Kaliske, A formulation of elasticity and viscoelasticity for fibre reinforced material at small and finite strains, Comput. Methods Appl. Mech. Eng., 185 (2000), 225-243. doi: 10.1016/S0045-7825(99)00261-3
|
| [14] | K. Anderson, A. El-Sheikh, T. Newson, Application of structural analysis to the mechanical behaviour of the cornea, J. R. Soc. Interface, 1 (2004), 1742-5662. |
| [15] |
P. M. Pinsky, D. V. Datye, A microstructurally-based finite element model of the incised human cornea, J. Biomech., 24 (1991), 907-922. doi: 10.1016/0021-9290(91)90169-N
|
| [16] |
R. Shah, S. Shah, S. Sengupta, Results of small incision lenticule extraction: all-in-one femtosecond laser refractive surgery, J. Cataract Refractive Surg., 37 (2011), 127-137. doi: 10.1016/j.jcrs.2010.07.033
|
| [17] |
J. B. Randleman, B. Russell, M. A. Ward, K. P. Thompson, R. D. Stulting, Risk factors and prognosis for corneal ectasia after LASIK, Ophthalmology, 110 (2003), 267-275. doi: 10.1016/S0161-6420(02)01727-X
|
| [18] |
K. A. John, Comparison of corneal biomechanics after myopic small-incision lenticule extraction compared to LASIK: an ex vivo study, Clin. Ophthalmol., 12 (2018), 237-245. doi: 10.2147/OPTH.S153509
|
| [19] |
I. M. Osman, H. A. Helaly, M. Abdalla, M. A. Shousha, Corneal biomechanical changes in eyes with small incision lenticule extraction and laser assisted in situ keratomileusis, BMC Ophthalmol., 16 (2016), 123. doi: 10.1186/s12886-016-0304-3
|
| [20] | T. F. Peinado, D. P. Piñ ero, I. A. López, J. L. Alio, Correlation of both corneal surfaces in corneal ectasia after myopic LASIK, Optom. Vision Sci., 88 (2011), E539-E542. |
| [21] |
R. Grytz, K. Krishnan, R. Whitley, V. Libertiaux, J. C. Downs, A mesh-free approach to incorporate complex anisotropic and heterogeneous material properties into eye-specific finite element models, Comput. Methods Applied Mech. Eng., 358 (2020), 112654. doi: 10.1016/j.cma.2019.112654
|
| [22] |
J. G. Yu, F. J. Bao, Y. F. Feng, C. Whitford, A. Elsheikh, Assessment of corneal biomechanical behavior under posterior and anterior pressure, J. Refractive Surg., 29 (2013), 64-70. doi: 10.3928/1081597X-20121228-05
|
| [23] | L. Fang, The influence of the aspheric profiles for transition zone on optical performance of human eye after conventional ablation, J. Eur. Opt. Soc. Rapid Publ., 9 (1990). |
| [24] |
C. J. Roberts, W. J. Dupps, Biomechanics of corneal ectasia and biomechanical treatments, J. Cataract Refractive Surg., 40 (2014), 991-998. doi: 10.1016/j.jcrs.2014.04.013
|
| [25] |
M. Girard, W. J. Dupps, M. Baskaran, G. Scarcelli, S. H. Yun, H. A. Quigley, et al., Translating ocular biomechanics into clinical practice: current state and future prospects, Curr. Eye Res., 40 (2015), 1-18. doi: 10.3109/02713683.2014.914543
|
| [26] |
S. Ganesh, S. Brar, R. R. Arra, Refractive lenticule extraction small incision lenticule extraction: a new refractive surgery paradigm, Indian J. Ophthalmol., 66 (2018), 10-19. doi: 10.4103/ijo.IJO_761_17
|
| [27] |
W. Di, Y. Wang, L. Zhang, S. Wei, T. Xin, Corneal biomechanical effects: Small-incision lenticule extraction versus femtosecond laser-assisted laser in situ keratomileusis, J. Cataract Refractive Surg., 40 (2014), 954-962. doi: 10.1016/j.jcrs.2013.07.056
|
| [28] | M. Balidis, Biomechanical profile of refractive surgery procedures, Acta Ophthalmol., 97 (2019). |
| [29] |
P. J. Shih, I. J. Wang, W. F. Cai, J. Y. Yen, Biomechanical simulation of stress concentration and intraocular pressure in corneas subjected to myopic refractive surgical procedures, Sci. Rep., 7 (2017), 13906. doi: 10.1038/s41598-017-14293-0
|
| [30] | M. I. Cordero-Mendieta, E. Pinos-Vélez, R. Coronel-Berrezueta, Study of corneal biomechanics and modeling of Young's module in healthy and pathological corneas, in International Conference on Applied Human Factors and Ergonomics, Springer, Cham, (2020), 99-105. |
| [31] | N. T. Mohammad, F. Craig, G. Dipika, Finite element modelling of cornea mechanics: a review, Arq. Bras. Oftalmol., 77 (2014), 60-65. |


Figures(8)

Yinyu Song, Lihua Fang, Qinyue Zhu, Ruirui Du, Binhui Guo, Jiahui Gong, Jixia Huang. Biomechanical responses of the cornea after small incision lenticule extraction (SMILE) refractive surgery based on a finite element model of the human eye[J]. Mathematical Biosciences and Engineering, 2021, 18(4): 4212-4225. doi: 10.3934/mbe.2021211


 DownLoad: