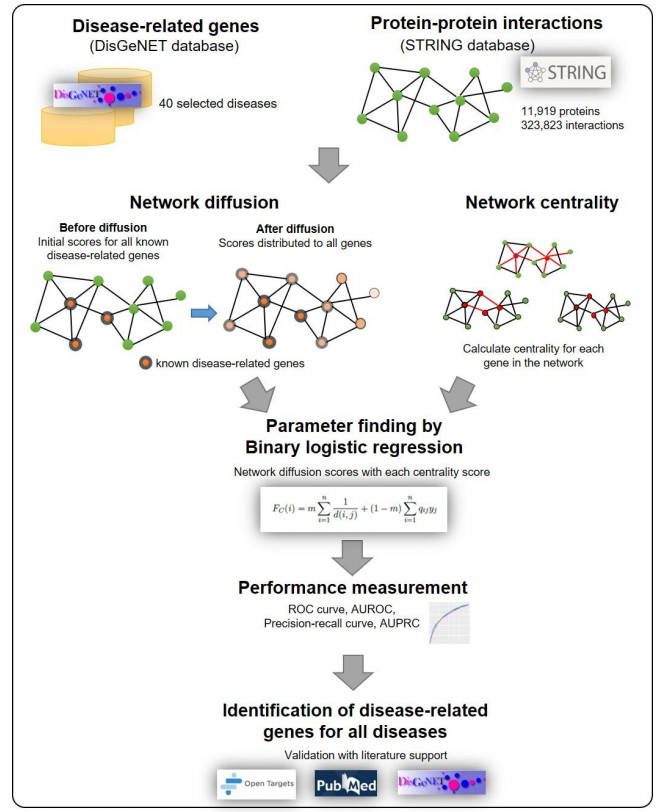
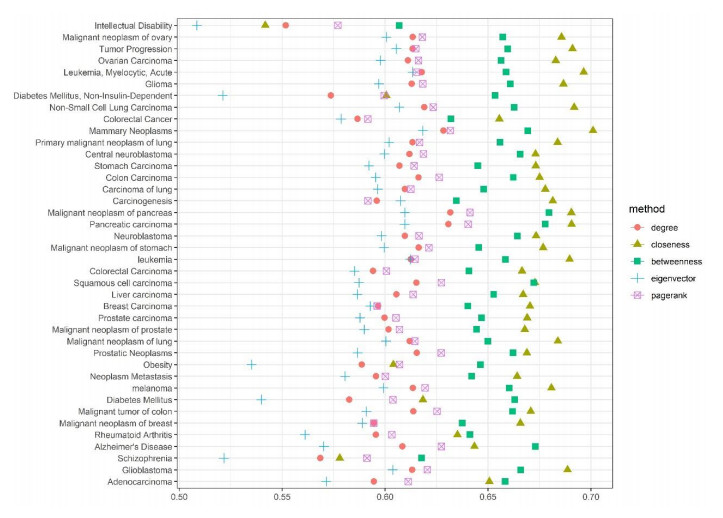
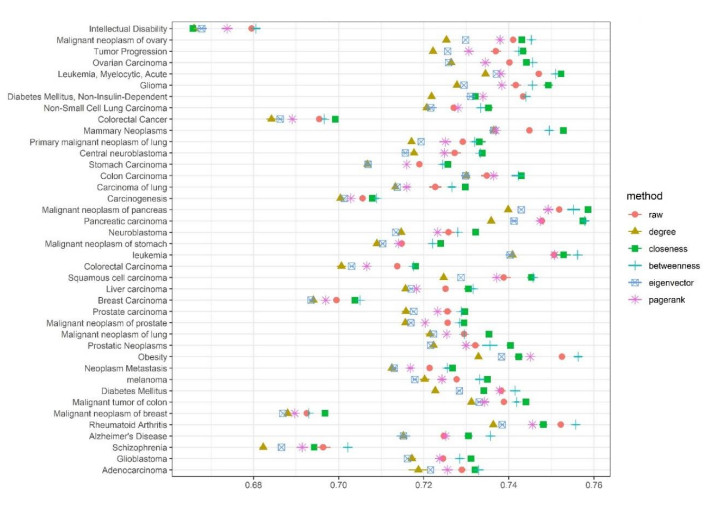
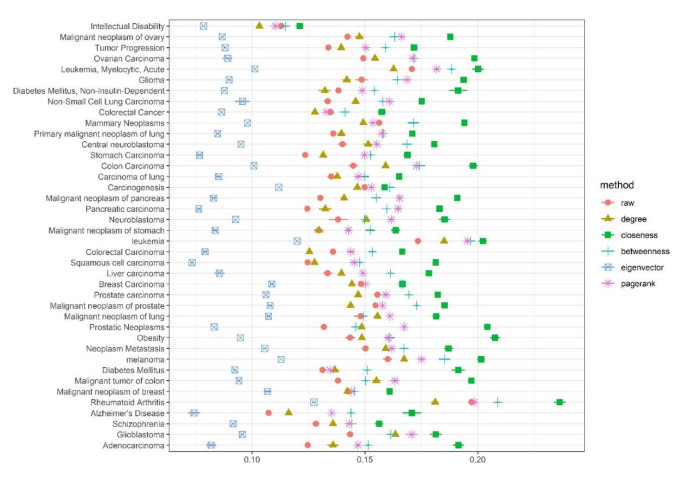
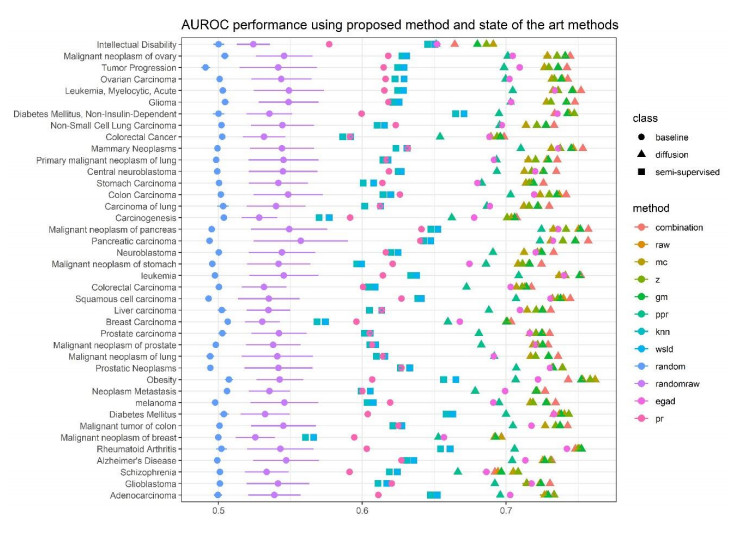
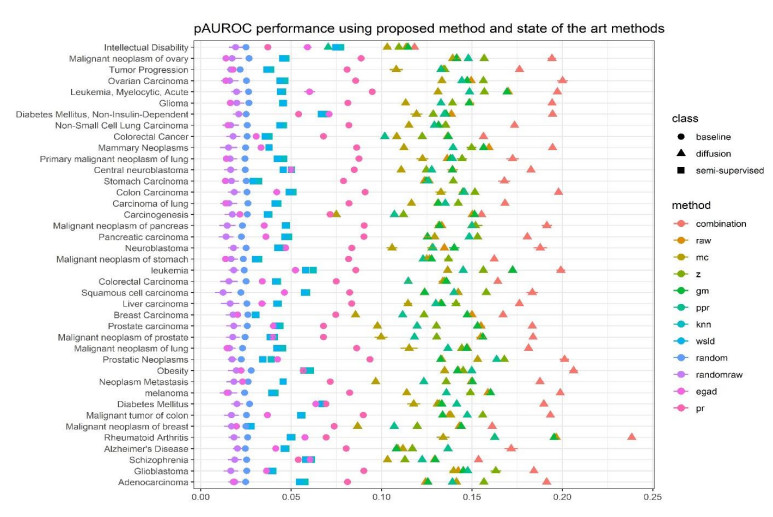
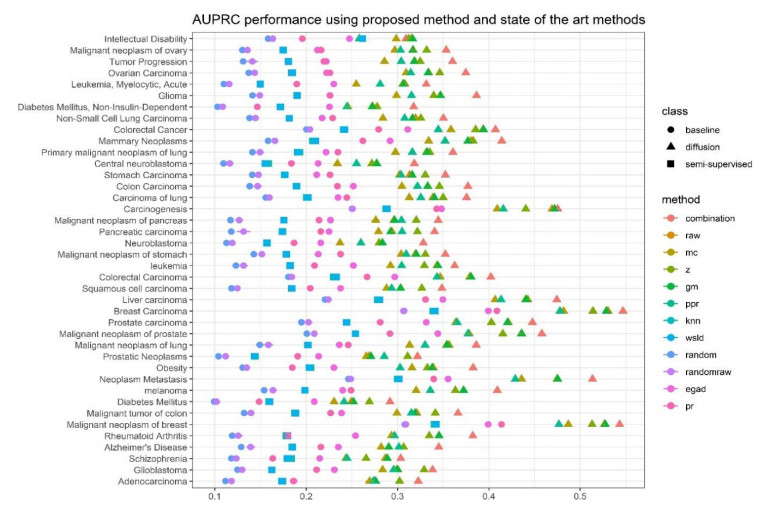
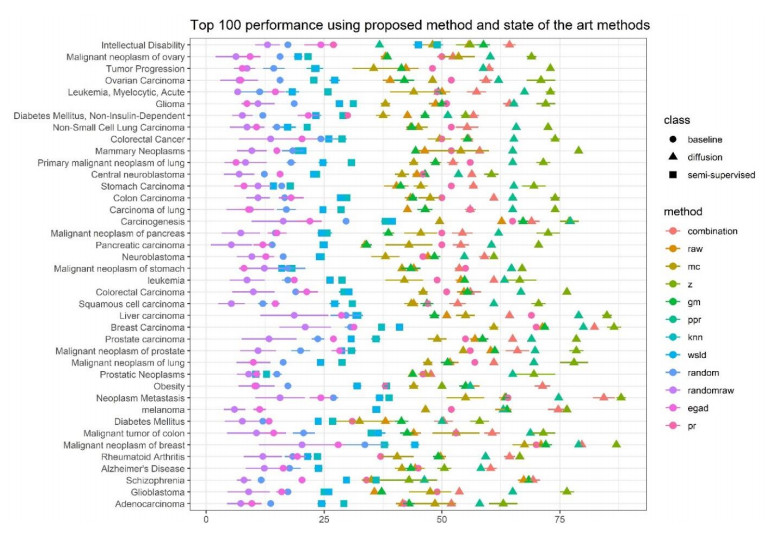
Disease-related gene prioritization is one of the most well-established pharmaceutical techniques used to identify genes that are important to a biological process relevant to a disease. In identifying these essential genes, the network diffusion (ND) approach is a widely used technique applied in gene prioritization. However, there is still a large number of candidate genes that need to be evaluated experimentally. Therefore, it would be of great value to develop a new strategy to improve the precision of the prioritization. Given the efficiency and simplicity of centrality measures in capturing a gene that might be important to the network structure, herein, we propose a technique that extends the scope of ND through a centrality measure to identify new disease-related genes. Five common centrality measures with different aspects were examined for integration in the traditional ND model. A total of 40 diseases were used to test our developed approach and to find new genes that might be related to a disease. Results indicated that the best measure to combine with the diffusion is closeness centrality. The novel candidate genes identified by the model for all 40 diseases were provided along with supporting evidence. In conclusion, the integration of network centrality in ND is a simple but effective technique to discover more precise disease-related genes, which is extremely useful for biomedical science.
Citation: Panisa Janyasupab, Apichat Suratanee, Kitiporn Plaimas. Network diffusion with centrality measures to identify disease-related genes[J]. Mathematical Biosciences and Engineering, 2021, 18(3): 2909-2929. doi: 10.3934/mbe.2021147
Disease-related gene prioritization is one of the most well-established pharmaceutical techniques used to identify genes that are important to a biological process relevant to a disease. In identifying these essential genes, the network diffusion (ND) approach is a widely used technique applied in gene prioritization. However, there is still a large number of candidate genes that need to be evaluated experimentally. Therefore, it would be of great value to develop a new strategy to improve the precision of the prioritization. Given the efficiency and simplicity of centrality measures in capturing a gene that might be important to the network structure, herein, we propose a technique that extends the scope of ND through a centrality measure to identify new disease-related genes. Five common centrality measures with different aspects were examined for integration in the traditional ND model. A total of 40 diseases were used to test our developed approach and to find new genes that might be related to a disease. Results indicated that the best measure to combine with the diffusion is closeness centrality. The novel candidate genes identified by the model for all 40 diseases were provided along with supporting evidence. In conclusion, the integration of network centrality in ND is a simple but effective technique to discover more precise disease-related genes, which is extremely useful for biomedical science.

| [1] |
A.-L. Barabási, N. Gulbahce, J. Loscalzo, Network medicine: A network-based approach to human disease, Nat. Rev. Genet., 12 (2011), 56-68. doi: 10.1038/nrg2918

|
| [2] |
M. Caldera, P. Buphamalai, F. Mueller, J. Menche, Interactome-based approaches to human disease, Curr. Opin. Syst. Biol., 3 (2017), 88-94. doi: 10.1016/j.coisb.2017.04.015
|
| [3] | E. K. Silverman, H. Schmidt, E. Anastasiadou, L. Altucci, M. Angelini, L. Badimon, et al., Molecular networks in network medicine: development and applications, Wiley Interdiscip. Rev. Syst. Biol. Med., 12 (2020), e1489. |
| [4] |
P. Paci, G. Fiscon, F. Conte, R.-S. Wang, L. Farina, J. Loscalzo, Gene co-expression in the interactome: moving from correlation toward causation via an integrated approach to disease module discovery, NPJ Syst. Biol. Appl., 7 (2021), 3. doi: 10.1038/s41540-020-00168-0
|
| [5] |
P. Paci, G. Fiscon, F. Conte, V. Licursi, J. Morrow, C. Hersh, et al., Integrated transcriptomic correlation network analysis identifies COPD molecular determinants, Sci. Rep., 10 (2020), 3361. doi: 10.1038/s41598-020-60228-7
|
| [6] |
G. Fiscon, F. Conte, V. Licursi, S. Nasi, P. Paci, Computational identification of specific genes for glioblastoma stem-like cells identity, Sci. Rep., 8 (2018), 7769. doi: 10.1038/s41598-018-26081-5
|
| [7] |
N. T. Doncheva, T. Kacprowski, M. Albrecht, Recent approaches to the prioritization of candidate disease genes, Wiley Interdiscip. Rev. Syst. Biol. Med., 4 (2012), 429-442. doi: 10.1002/wsbm.1177
|
| [8] |
A. Suratanee, K. Plaimas, Identification of inflammatory bowel disease-related proteins using a reverse k-nearest neighbor search, J. Bioinform. Comput. Biol., 12 (2014), 1450017. doi: 10.1142/S0219720014500176
|
| [9] | W. Guo, D.-M. Shang, J.-H. Cao, K. Feng, Y.-C. He, Y. Jiang, et al., Identifying and analyzing novel epilepsy-related genes using random walk with restart algorithm, Biomed. Res. Int., 2017 (2017), 1-14. |
| [10] |
S. D. Ghiassian, J. Menche, A.-L. Barabási, A DIseAse MOdule Detection (DIAMOnD) algorithm derived from a systematic analysis of connectivity patterns of disease proteins in the human interactome, PLoS Comput. Biol., 11 (2015), e1004120. doi: 10.1371/journal.pcbi.1004120
|
| [11] |
P. Paci, T. Colombo, G. Fiscon, A. Gurtner, G. Pavesi, L. Farina, SWIM: A computational tool to unveiling crucial nodes in complex biological networks, Sci. Rep., 7 (2017), 44797. doi: 10.1038/srep44797
|
| [12] |
S. Picart-Armada, S. J. Barrett, D. R. Wille, A. Perera-Lluna, A. Gutteridge, B. H. Dessailly, Benchmarking network propagation methods for disease gene identification, PLoS Comput. Biol., 15 (2019), e1007276. doi: 10.1371/journal.pcbi.1007276
|
| [13] |
D. Lancour, A. Naj, R. Mayeux, J. L. Haines, M. A. Pericak-Vance, G. D. Schellenberg, et al., One for all and all for one: Improving replication of genetic studies through network diffusion, PLoS Genet., 14 (2018), e1007306. doi: 10.1371/journal.pgen.1007306
|
| [14] |
S. Picart-Armada, W. K. Thompson, A. Buil, A. Perera-Lluna, diffuStats: An R package to compute diffusion-based scores on biological networks, Bioinformatics, 34 (2018), 533-534. doi: 10.1093/bioinformatics/btx632
|
| [15] |
E. Mosca, M. Bersanelli, M. Gnocchi, M. Moscatelli, G. Castellani, L. Milanesi, et al., Network diffusion-based prioritization of autism risk genes identifies significantly connected gene modules, Front. Genet., 8 (2017), 129. doi: 10.3389/fgene.2017.00129
|
| [16] |
M. Bersanelli, E. Mosca, D. Remondini, G. Castellani, L. Milanesi, Network diffusion-based analysis of high-throughput data for the detection of differentially enriched modules, Sci. Rep., 6 (2016), 34841. doi: 10.1038/srep34841
|
| [17] |
A. Hill, S. Gleim, F. Kiefer, F. Sigoillot, J. Loureiro, J. Jenkins, et al., Benchmarking network algorithms for contextualizing genes of interest, PLoS Comput. Biol., 15 (2019), e1007403. doi: 10.1371/journal.pcbi.1007403
|
| [18] |
A. Al-Aamri, K. Taha, Y. Al-Hammadi, M. Maalouf, D. Homouz, Analyzing a co-occurrence gene-interaction network to identify disease-gene association, BMC Bioinform., 20 (2019), 70. doi: 10.1186/s12859-019-2634-7
|
| [19] |
X. Zhao, Z.-P. Liu, Analysis of topological parameters of complex disease genes reveals the importance of location in a biomolecular network, Genes, 10 (2019), 143. doi: 10.3390/genes10020143
|
| [20] | S. Izudheen, E. S. Sajan, I. George, J. John, C. S. Attipetty, Effect of community structures in protein--protein interaction network in cancer protein identification, Curr. Sci., 118 (2020), 62. |
| [21] |
D. Szklarczyk, A. L. Gable, D. Lyon, A. Junge, S. Wyder, J. Huerta-Cepas, et al., STRING v11: Protein--protein association networks with increased coverage, supporting functional discovery in genome-wide experimental datasets, Nucleic Acids Res., 47 (2019), D607-D613. doi: 10.1093/nar/gky1131
|
| [22] | J. Pinero, N. Queralt-Rosinach, A. Bravo, J. Deu-Pons, A. Bauer-Mehren, M. Baron, et al., DisGeNET: A discovery platform for the dynamical exploration of human diseases and their genes. Database: the journal of biological databases and curation. 2015; 2015: bav028: Epub 2015/04/17. doi: 10.1093/database/bav028.PubMedPMID:25877637. |
| [23] | A. J. Smola, R. Kondor, Kernels and regularization on graphs, Learn. theory kernel Mach., Springer, (2003), 144-158. |
| [24] | P. Y. Chebotarev, E. Shamis, The matrix-forest theorem and measuring relations in small social Groups, arXiv, 58 (1997), 1505-1514. |
| [25] |
A.-L. Barabási, R. Albert, Emergence of scaling in random networks, Science, 286 (1999), 509. doi: 10.1126/science.286.5439.509
|
| [26] | L. Page, S. Brin, R. Motwani, T. Winograd, The PageRank citation ranking: Bringing order to the web, 1999, 1-17. |
| [27] | S. Ballouz, M. Weber, P. Pavlidis, J. Gillis, EGAD: Ultra-fast functional analysis of gene networks, Bioinformatics, 33 (2017), 612-614. |
| [28] |
G. Valentini, G. Armano, M. Frasca, J. Lin, M. Mesiti, M. Re, RANKS: A flexible tool for node label ranking and classification in biological networks, Bioinformatics, 32(2016), 2872-2874. doi: 10.1093/bioinformatics/btw235
|
| [29] | S. Mostafavi, D. Ray, D. Warde-Farley, C. Grouios, Q. Morris, GeneMANIA: A real-time multiple association network integration algorithm for predicting gene function, Genome Biol., 9 (2008), S4. |
| [30] |
S. Picart-Armada, F. Fernández-Albert, M. Vinaixa, M. A. Rodríguez, S. Aivio, T. H. Stracker, et al., Null diffusion-based enrichment for metabolomics data, PLoS One, 12 (2017), e0189012. doi: 10.1371/journal.pone.0177197
|
| [31] |
B. Jiang, K. Kloster, D. F. Gleich, M. Gribskov, AptRank: An adaptive PageRank model for protein function prediction on bi-relational graphs, Bioinformatics, 33 (2017), 1829-1836. doi: 10.1093/bioinformatics/btx029
|
| [32] |
Y. Zhang, R.-q. He, Y.-w. Dang, X.-l. Zhang, X. Wang, S.-n. Huang, et al., Comprehensive analysis of the long noncoding RNA HOXA11-AS gene interaction regulatory network in NSCLC cells, Cancer Cell Int., 16 (2016), 89. doi: 10.1186/s12935-016-0366-6
|
| [33] | K. Ge, J. Huang, W. Wang, M. Gu, X. Dai, Y. Xu, et al., Serine protease inhibitor kazal-type 6 inhibits tumorigenesis of human hepatocellular carcinoma cells via its extracellular action, Oncotarget, 8 (2016), 5965-5975. |
| [34] | J. Li, X. Wang, J. Yang, S. Zhao, T. Liu, L. Wang, Identification of hub genes in Hepatocellular Carcinoma related to progression and prognosis by weighted gene co-expression network analysis, Med. Sci. Monit, 26 (2020), e920854. |
| [35] |
Y. J. Sung, T.W. Winkler, L. de Las Fuentes, A. R. Bentley, M. R. Brown, A. T. Kraja, et al., A large-scale multi-ancestry genome-wide study accounting for smoking behavior identifies multiple significant loci for blood pressure, Am. J. Hum. Genet., 102 (2018), 375-400. doi: 10.1016/j.ajhg.2018.01.015
|
| [36] |
S. Pasquin, M. Sharma, J.-F. Gauchat, Ciliary neurotrophic factor (CNTF): New facets of an old molecule for treating neurodegenerative and metabolic syndrome pathologies, Cytokine Growth Factor Rev., 26 (2015), 507-515. doi: 10.1016/j.cytogfr.2015.07.007
|
| [37] |
C. Conejero-Goldberg, T. M. Hyde, S. Chen, U. Dreses-Werringloer, M. M. Herman, J. E. Kleinman, et al., Molecular signatures in post-mortem brain tissue of younger individuals at high risk for Alzheimer's disease as based on APOE genotype, Mol. Psychiatry, 16 (2011), 836-847. doi: 10.1038/mp.2010.57
|
| [38] |
Y. Hashimoto, M. Kurita, M. Matsuoka, Identification of soluble WSX-1 not as a dominant-negative but as an alternative functional subunit of a receptor for an anti-Alzheimer's disease rescue factor Humanin, Biochem. Biophys. Res. Commun., 389 (2009), 95-99. doi: 10.1016/j.bbrc.2009.08.095
|
| [39] |
Y. Hashimoto, M. Kurita, S. Aiso, I. Nishimoto, M. Matsuoka, Humanin inhibits neuronal cell death by interacting with a cytokine receptor complex or complexes Involving CNTF Receptor/WSX-1/gp130, Mol. Biol. Cell, 20 (2009), 2864-2873. doi: 10.1091/mbc.e09-02-0168
|
 mbe-18-03-147_supplementary_file.docx mbe-18-03-147_supplementary_file.docx |
 |
Figures(9) / Tables(5)

Panisa Janyasupab, Apichat Suratanee, Kitiporn Plaimas. Network diffusion with centrality measures to identify disease-related genes[J]. Mathematical Biosciences and Engineering, 2021, 18(3): 2909-2929. doi: 10.3934/mbe.2021147


 DownLoad: