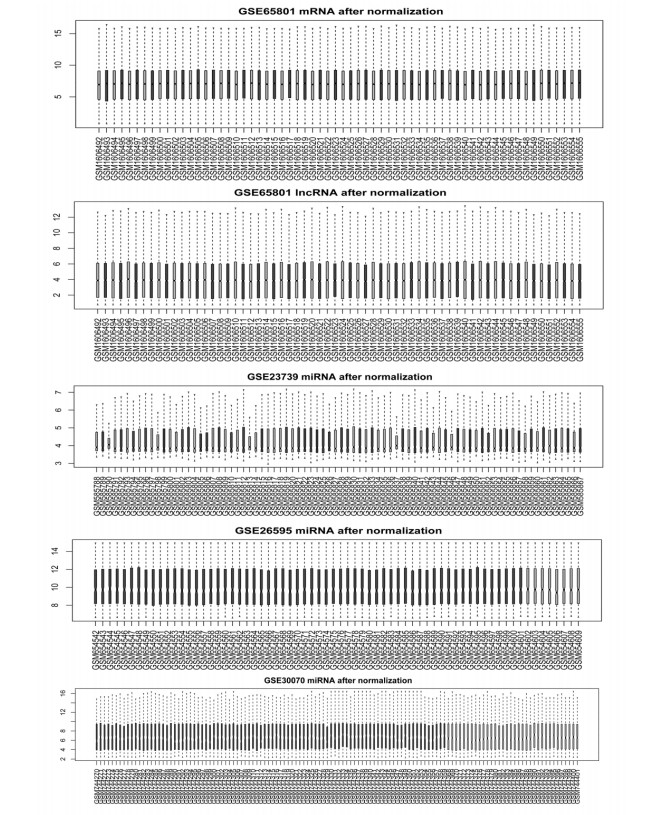
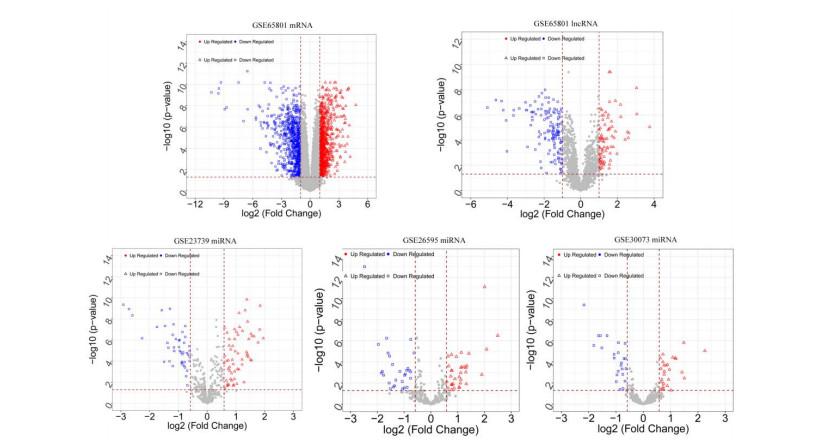
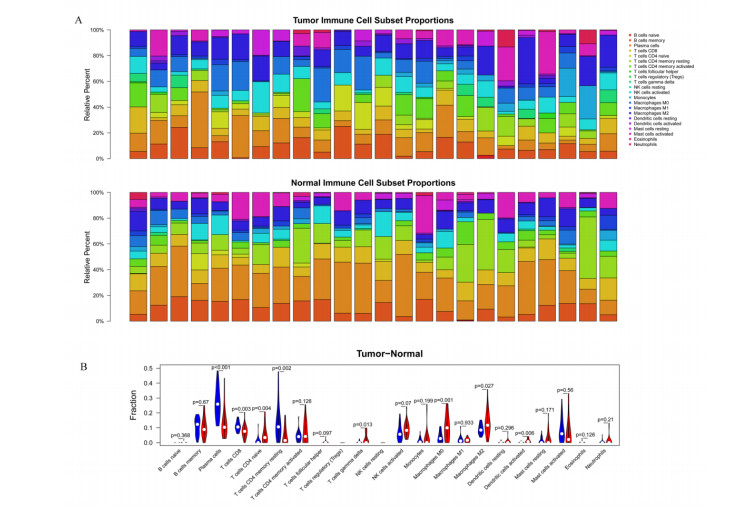
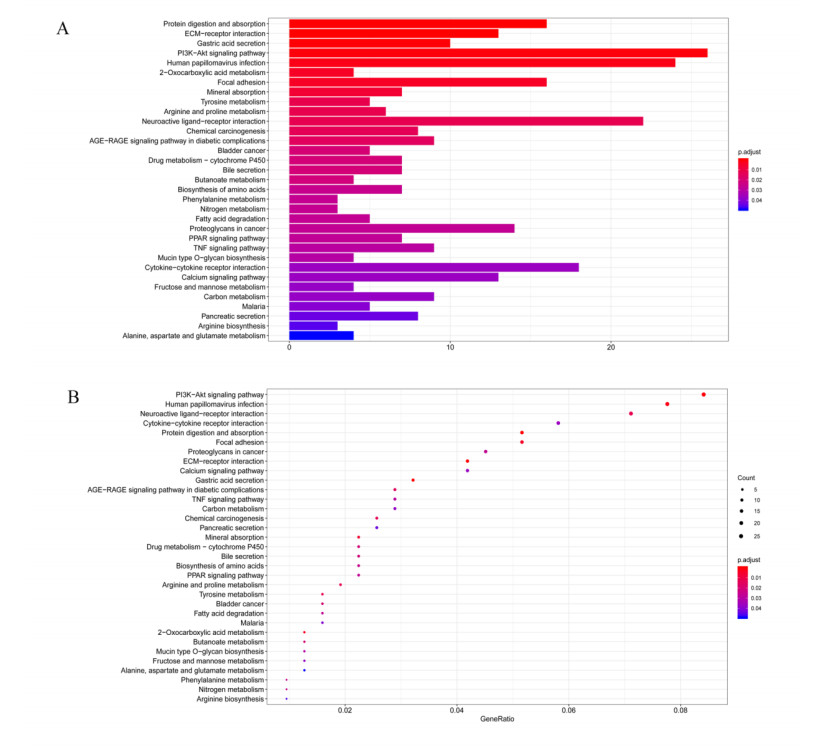
This study aimed to identify significant immune microenvironment-related competing endogenous RNA (CeRNA) regulatory axis in gastric cancer (GC). Analysis of differentially expressed mRNAs (DEmRNAs), miRNAs (DEmiRNAs), and lncRNAs (DElncRNAs) was performed for the microarray datasets. After abundance analysis of immune cell's infiltration, immune-related mRNAs and lncRNAs were obtained. Meanwhile, according to the Pearson correlation coefficient between immune-related mRNAs and lncRNAs, the co-expression mRNA-lncRNA pairs were screened. Furthermore, the target genes of co-existance miRNAs were predicted, and miRNA-lncRNA pairs were identified. Finally, the lncRNA-miRNA and miRNA-mRNA relationship regulated by the same miRNA was screened. Combining with the co-expression relationship between lncRNA and mRNA, the CeRNA network was constructed. In abundance analysis of immune cell's infiltration, a total of eight immune cells were obtained, in addition, 83 immune-related DElncRNAs and 705 immune-related DEmRNAs were screened. KEGG pathway enrichment analysis showed that these mRNAs were mainly involved in PI3K-Akt signaling pathway and human papillomavirus infection, while lncRNA were relevant to gastric acid secretion. A total of 25 miRNAs were significantly associated with immune-related mRNAs, such as hsa-miR-148a-3p, hsa-miR-17-5p, and hsa-miR-25-3p. From the mRNA-miRNA-lncRNA CeRNA network, we observed that AC104389.28─miR-17-5─SMAD5 axis and LINC01133─miR-17-5p─PBLD axis played a crucial role in the development of GC. Furthermore, resting memory CD4 T cells and plasma cells were closely associated with the pathogenesis of GC, and these immune cells might be affected by the key genes. The present study identified key genes that associated with immune microenvironment in GC, providing potential molecular targets for immunotherapy of GC.
Citation: Jie Chen, Jinggui Chen, Bo Sun, Jianghong Wu, Chunyan Du. Integrative analysis of immune microenvironment-related CeRNA regulatory axis in gastric cancer[J]. Mathematical Biosciences and Engineering, 2020, 17(4): 3953-3971. doi: 10.3934/mbe.2020219
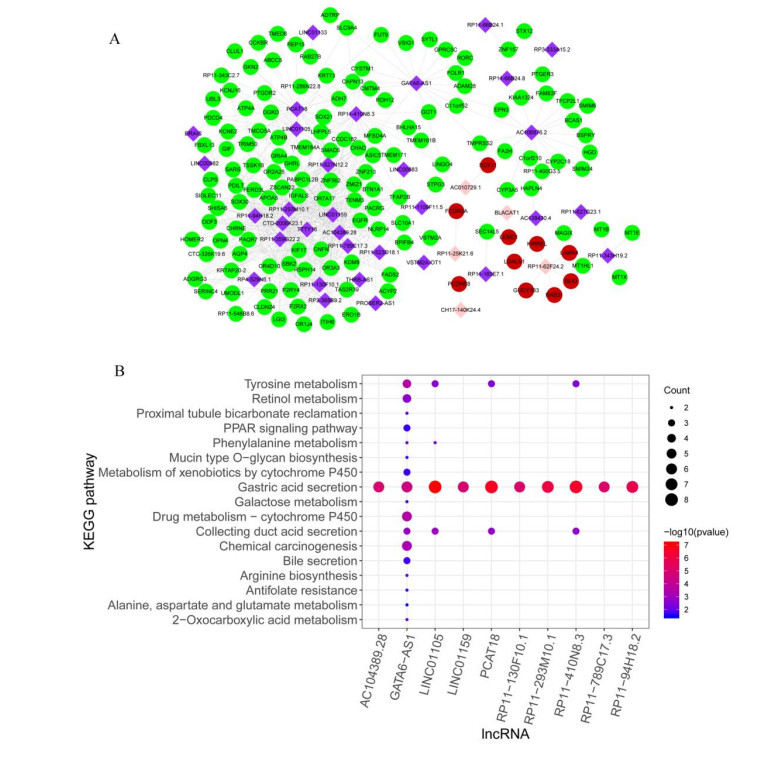
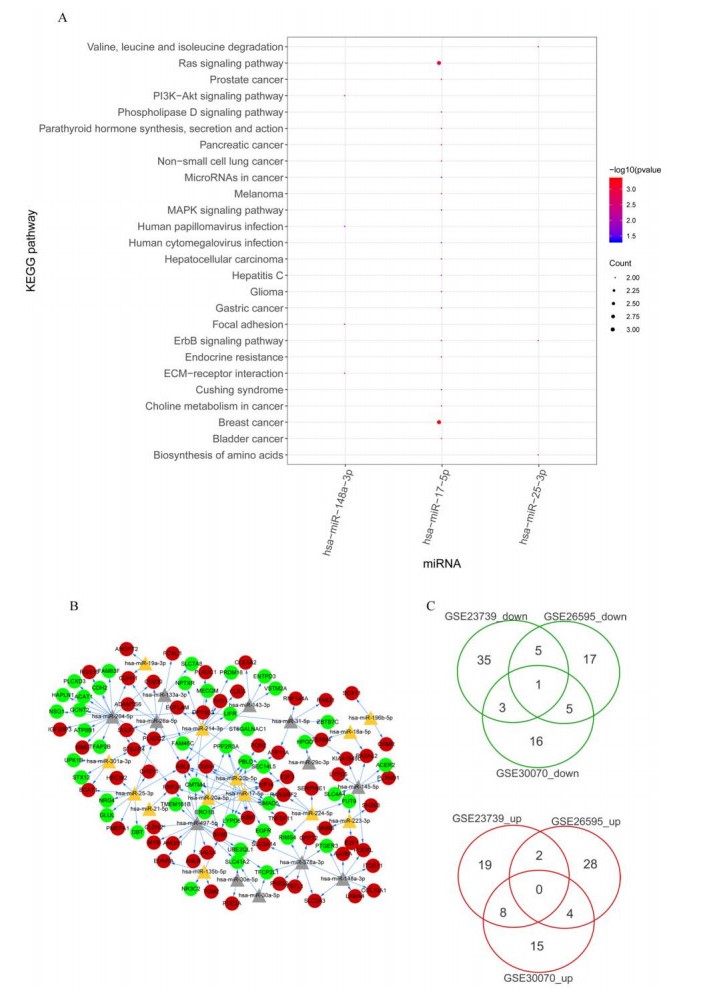
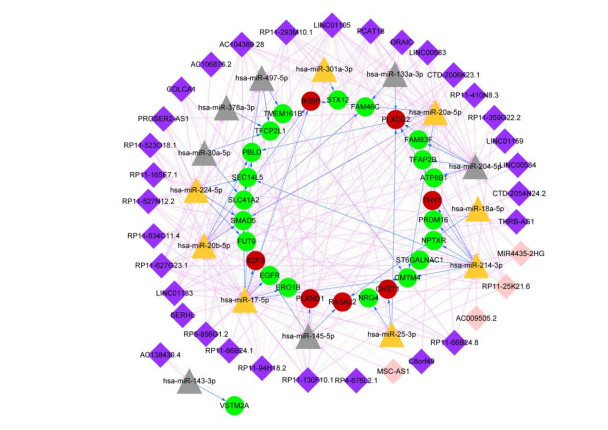
This study aimed to identify significant immune microenvironment-related competing endogenous RNA (CeRNA) regulatory axis in gastric cancer (GC). Analysis of differentially expressed mRNAs (DEmRNAs), miRNAs (DEmiRNAs), and lncRNAs (DElncRNAs) was performed for the microarray datasets. After abundance analysis of immune cell's infiltration, immune-related mRNAs and lncRNAs were obtained. Meanwhile, according to the Pearson correlation coefficient between immune-related mRNAs and lncRNAs, the co-expression mRNA-lncRNA pairs were screened. Furthermore, the target genes of co-existance miRNAs were predicted, and miRNA-lncRNA pairs were identified. Finally, the lncRNA-miRNA and miRNA-mRNA relationship regulated by the same miRNA was screened. Combining with the co-expression relationship between lncRNA and mRNA, the CeRNA network was constructed. In abundance analysis of immune cell's infiltration, a total of eight immune cells were obtained, in addition, 83 immune-related DElncRNAs and 705 immune-related DEmRNAs were screened. KEGG pathway enrichment analysis showed that these mRNAs were mainly involved in PI3K-Akt signaling pathway and human papillomavirus infection, while lncRNA were relevant to gastric acid secretion. A total of 25 miRNAs were significantly associated with immune-related mRNAs, such as hsa-miR-148a-3p, hsa-miR-17-5p, and hsa-miR-25-3p. From the mRNA-miRNA-lncRNA CeRNA network, we observed that AC104389.28─miR-17-5─SMAD5 axis and LINC01133─miR-17-5p─PBLD axis played a crucial role in the development of GC. Furthermore, resting memory CD4 T cells and plasma cells were closely associated with the pathogenesis of GC, and these immune cells might be affected by the key genes. The present study identified key genes that associated with immune microenvironment in GC, providing potential molecular targets for immunotherapy of GC.

| [1] | W. Tarupi, E. de Vries, P. Cueva, J. Yépez, Stagnation in decreasing gastric cancer incidence and mortality in quito: Time trend analysis, 1985-2013, J. Cancer Epidemiol., 2019 (2019), 1-10. |
| [2] |
F. Bray, J. Ferlay, I. Soerjomataram, R. L Siegel, L. A Torre, A. Jemal, Global cancer statistics 2018: GLOBOCAN estimates of incidence and mortality worldwide for 36 cancers in 185 countries, CA Cancer J. Clin., 68 (2018), 394-424. doi: 10.3322/caac.21492

|
| [3] | L. Yang, R. Zheng, N. Wang, Y. Yuan, S. Liu, H. Li, et al., Incidence and mortality of stomach cancer in China, 2014, Chinese J. Cancer Res., 30 (2018), 291-298. |
| [4] | Japanese Gastric Cancer Association, Japanese gastric cancer treatment guidelines 2014 (ver. 4), Gastric Cancer, 20 (2017), 1-19. |
| [5] |
C. Hamashima, Current issues and future perspectives of gastric cancer screening, World J. Gastroentero., 20 (2014), 13767-13774. doi: 10.3748/wjg.v20.i38.13767
|
| [6] | C. Mascaux, M. Angelova, A. Vasaturo, J. Beane, K. Hijazi, G. Anthoine, et al., Immune evasion before tumour invasion in early lung squamous carcinogenesis, Nature, 571 (2019), 570-575. |
| [7] |
G. Klein, E. Klein, Surveillance against tumors--is it mainly immunological?, Immunol. Lett., 100 (2005), 29-33. doi: 10.1016/j.imlet.2005.06.024
|
| [8] |
L. Hoenicke, L. Zender, Immune surveillance of senescent cells—biological significance in cancer- and non-cancer pathologies, Carcinogenesis, 33 (2012), 1123-1126. doi: 10.1093/carcin/bgs124
|
| [9] | O. Nakano, M. Sato, Y. Naito, K. Suzuki, S. Orikasa, M. Aizawa, et al., Proliferative activity of intratumoral CD8(+) T-lymphocytes as a prognostic factor in human renal cell carcinoma: clinicopathologic demonstration of antitumor immunity, Cancer Res., 61 (2001), 5132-5136. |
| [10] | K. Liu, K. Yang, B. Wu, H. Chen, X. Chen, L. Jiang, et al., Tumor-infiltrating immune cells are associated with prognosis of gastric cancer, Medicine (Baltimore), 94 (2015), e1631. |
| [11] |
L. Li, Y. Ouyang, W. Wang, D. Hou, Y. Zhu, The landscape and prognostic value of tumor-infiltrating immune cells in gastric cancer, Peer J., 7 (2019), e7993. doi: 10.7717/peerj.7993
|
| [12] |
C. P. Ponting, P. L. Oliver, W. Reik, Evolution and Functions of Long Noncoding RNAs, Cell, 136 (2009), 629-641. doi: 10.1016/j.cell.2009.02.006
|
| [13] | Y. Gu, T. Chen, G. Li, X. Yu, Y. Lu, H. Wang, et al., LncRNAs: Emerging biomarkers in gastric cancer, Future Oncol., 11 (2015), 2427-2441. |
| [14] | Y. Qi, H. S. Ooi, J. Wu, J. Chen, X. Zhang, S. Tan, et al., MALAT1 long ncRNA promotes gastric cancer metastasis by suppressing PCDH10, Oncotarget, 7 (2016), 12693-12703. |
| [15] | M. Qiu, Y. Xu, X. Yang, J. Wang, J. Hu, L. Xu, et al., CCAT2 is a lung adenocarcinoma-specific long non-coding RNA and promotes invasion of non-small cell lung cancer, Tumor Biol., 35 (2014), 5375-5380. |
| [16] | J. Long, J. Xiong, Y. Bai, J. Mao, J. Lin, W. Xu, et al., Construction and Investigation of a lncRNA-Associated ceRNA Regulatory Network in Cholangiocarcinoma, Front Oncol., 9 (2019), 649. |
| [17] | X. Luan, Y. Wang, LncRNA XLOC_006390 facilitates cervical cancer tumorigenesis and metastasis as a ceRNA against miR-331-3p and miR-338-3p, J. Gynecol. Oncol., 29 (2018), e95. |
| [18] |
X. Qi, D. H. Zhang, N. Wu, J. Xiao, X. Wang, W. Ma, ceRNA in cancer: Possible functions and clinical implications, J. Med. Genet., 52 (2015), 710-718. doi: 10.1136/jmedgenet-2015-103334
|
| [19] | X. Chen, Z. Chen, S. Yu, F. Nie, S. Yan, P. Ma, et al., Long noncoding RNA LINC01234 functions as a competing endogenous RNA to regulate CBFB expression by sponging miR-204-5p in gastric cancer, Clin. Cancer Res., 24 (2018), 2002-2014. |
| [20] | H Liu, S. Liu, L. Liu, R. Ma, P. Gao, EGR1-mediated transcription of lncRNA-HNF1A-AS1 promotes cell-cycle progression in gastric cancer, Cancer Res., 78 (2018), 5877-5890. |
| [21] | T. Barrett, R. Edgar, Mining microarray data at NCBI's gene expression omnibus (GEO)*, Methods Mol. Biol., 338 (2006), 175-190. |
| [22] | H. Li, B. Yu, J. Li, L. Su, M. Yan, J. Zhang, et al., Characterization of differentially expressed genes involved in pathways associated with gastric cancer, PLoS One, 10 (2015), e0125013. |
| [23] | H. K. Oh, A. L. Tan, K. Das, C. H. Ooi, N. T. Deng, I. B. Tan, et al., Genomic loss of miR-486 regulates tumor progression and the OLFM4 antiapoptotic factor in gastric cancer, Clin. Cancer Res., 17 (2011), 2657-2667. |
| [24] | J. Y. Lim, S. O. Yoon, S. Y. Seol, S. W. Hong, J. W. Kim, S. H. Choi, et al., Overexpression of miR-196b and HOXA10 characterize a poor-prognosis gastric cancer subtype, World J. Gastroentero., 19 (2013), 7078-7088. |
| [25] | C. H. Kim, H. K. Kim, R. L. Rettig, J. Kim, E. Lee, O. Aprelikova, et al., miRNA signature associated with outcome of gastric cancer patients following chemotherapy, BMC Med. Genom., 4 (2011), 79. |
| [26] | J. Harrow, F. Denoeud, A. Frankish, A. Reymond, C. K. Chen, J. Chrast, et al., GENCODE: Producing a reference annotation for ENCODE, Genome biol., 7 (2006), S4.1-9. |
| [27] |
H. Jiang and W. H. Wong, SeqMap: Mapping massive amount of oligonucleotides to the genome, Bioinformatics, 24 (2008), 2395-2396. doi: 10.1093/bioinformatics/btn429
|
| [28] | G. K. Smyth, Limma: Linear Models for Microarray Data, in: Bioinformatics and computational biology solutions using R and Bioconductor (eds. R. Gentleman and V. J. Carey), Springer, (2005), 397-420. |
| [29] | S. Griffiths-Jones, miRBase: MicroRNA sequences and annotation, Curr. Protoc. Bioinform., 29 (2010), 12.9.1-10. |
| [30] |
B. Chen, M. S. Khodadoust, C. L. Liu, A. M. Newman, A. A. Alizadeh, Profiling tumor infiltrating immune cells with CIBERSORT, Methods Mol. Biol., 1711 (2018), 243-259. doi: 10.1007/978-1-4939-7493-1_12
|
| [31] |
G. Yu, L. Wang, Y. Han, Q. He, clusterProfiler: An R package for comparing biological themes among gene clusters, Omics J. Integrat. Biol., 16 (2012), 284-287. doi: 10.1089/omi.2011.0118
|
| [32] |
H. Dweep, C. Sticht, P. Pandey, N. Gretz, miRWalk-Database: Prediction of possible miRNA binding sites by "walking" the genes of three genomes, J. Biomed. Inform., 44 (2011), 839-847. doi: 10.1016/j.jbi.2011.05.002
|
| [33] | A. J. Enright, B. John, U. Gaul, T. Tuschl, C. Sander, D. S. Marks, MicroRNA targets in Drosophila, Genome Biol., 5 (2003), R1. |
| [34] |
D. C. Lazăr, M. F. Avram, I. Romoșan, M. Cornianu, S. Tăban, A. Goldiș, Prognostic significance of tumor immune microenvironment and immunotherapy: Novel insights and future perspectives in gastric cancer, World J. Gastroentero., 24 (2018), 3583-3616. doi: 10.3748/wjg.v24.i32.3583
|
| [35] | S. Cascio, A. D'Andrea, R. Ferla, E. Surmacz, E. Gulotta, V. Amodeo, et al., miR-20b modulates VEGF expression by targeting HIF-1α and STAT3 in MCF-7 breast cancer cells, J. Cell. Physiol., 224 (2010), 242-249. |
| [36] | A. R. Hallahan, J. I. Pritchard, R. A. S. Chandraratna, R. G. Ellenbogen, J. R. Geyer, R. P. Overland, et al., BMP-2 mediates retinoid-induced apoptosis in medulloblastoma cells through a paracrine effect, Nat. Med., 9 (2003), 1033-1038. |
| [37] |
T. Nagasako, T. Sugiyama, T. Mizushima, Y. Miura, M. Kato, M. Asaka, Up-regulated Smad5 Mediates Apoptosis of Gastric Epithelial Cells Induced by Helicobacter pylori Infection, J. Biol. Chem., 278 (2003), 4821-4825. doi: 10.1074/jbc.M211143200
|
| [38] | Z. Kanaan, H. Roberts, M. R. Eichenberger, A. Billeter, G. Ocheretner, J. Pan, et al., A plasma microRNA panel for detection of colorectal adenomas a step toward more precise screening for colorectal cancer, Ann. Surg., 258 (2013), 400-408. |
| [39] | M. Wang, H. Gu, H. Qian, W. Zhu, C. Zhao, X. Zhang, et al., miR-17-5p/20a are important markers for gastric cancer and murine double minute 2 participates in their functional regulation, Eur. J. Cancer, 49 (2013), 2010-2021. |
| [40] | N. Rohr-Udilova, F. Klinglmüller, R. Schulte-Hermann, J. Stift, M. Herac, M. Salzmann, et al., Deviations of the immune cell landscape between healthy liver and hepatocellular carcinoma, Sci. Rep., 8 (2018), 6220. |
| [41] | B. Jiang, Q. Sun, Y. Tong, Y. Wang, H. Ma, X. Xia, et al., An immune-related gene signature predicts prognosis of gastric cancer, Medicine (Baltimore), 98 (2019), e16273. |
| [42] |
C. Iriyama, S. Matsuda, R. Katsumata, M. Hamaguchi, Cloning and sequencing of a novel human gene which encodes a putative hydroxylase, J. Hum. Genet., 46 (2001), 289-292. doi: 10.1007/s100380170081
|
| [43] | D. Li, J. Zhang, W. Li, J. Cui, Y. Pan, S. Liu, et al., MAWBP and MAWD inhibit proliferation and invasion in gastric cancer, World J. Gastroentero., 19 (2013), 2781-2792. |
| [44] | J. Zhang, B. Kang, X. Tan, Z. Bai, Y. Liang, R. Xing, et al., Comparative analysis of the protein profiles from primary gastric tumors and their adjacent regions: MAWBP could be a new protein candidate involved in gastric cancer, J. Proteome Res., 6 (2007), 4423-4432. |
| [45] | Q. Wu, G. Luo, Z. Yang, F. Zhu, Y. An, Y. Shi, et al., miR-17-5p promotes proliferation by targeting SOCS6 in gastric cancer cells, FEBS Lett., 588 (2014), 2055-2062. |
| [46] | M. Seifert, R. Küppers, Human memory B cells, Leukemia, 30 (2016), 2283-2292. |
| [47] |
N. Hosen, Multiple myeloma-initiating cells, Int. J. Hematol., 97 (2013), 306-312. doi: 10.1007/s12185-013-1293-0
|

Figures(8) / Tables(2)

Jie Chen, Jinggui Chen, Bo Sun, Jianghong Wu, Chunyan Du. Integrative analysis of immune microenvironment-related CeRNA regulatory axis in gastric cancer[J]. Mathematical Biosciences and Engineering, 2020, 17(4): 3953-3971. doi: 10.3934/mbe.2020219


 DownLoad: