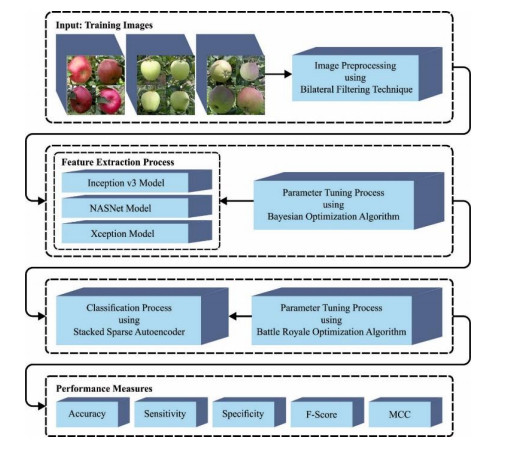
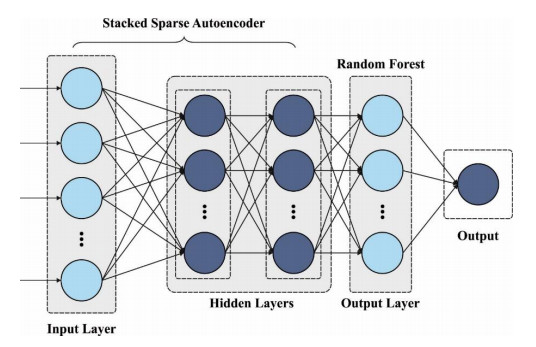
Fruit Disease Detection (FDD) using Computer Vision (CV) techniques is a powerful strategy to accomplish precision agriculture. Because, these techniques assist the farmers in identifying and treating the diseased fruits before it spreads to other plants, thus resulting in better crop yield and quality. Further, it also helps in reducing the usage of pesticides and other chemicals so that the farmers can streamline their efforts with high accuracy and avoid unwanted treatments. FDD and Deep Learning (DL)-based classification involve the deployment of Artificial Intelligence (AI), mainly the DL approach, to identify and classify different types of diseases that affect the fruit crops. The DL approach, especially the Convolutional Neural Network (CNN), has been trained to classify the fruit images as diseased or healthy, based on the presence or absence of the disease symptoms. In this background, the current study developed a new Battle Royale Optimization with a Feature Fusion Based Fruit Disease Grading and Classification (BROFF-FDGC) technique. In the presented BROFF-FDGC technique, the Bilateral Filtering (BF) approach is primarily employed for the noise removal process. Besides, a fusion of DL models, namely Inception v3, NASNet, and Xception models, is used for the feature extraction process with Bayesian Optimization (BO) algorithm as a hyperparameter optimizer. Moreover, the BROFF-FDGC technique employed the Stacked Sparse Autoencoder (SSAE) algorithm for fruit disease classification. Furthermore, the BRO technique is also employed for optimum hyperparameter tuning of the SSAE technique. The proposed BROFF-FDGC system was simulated extensively for validation using the test database and the outcomes established the enhanced performance of the proposed system. The obtained outcomes emphasize the superior performance of the BROFF-FDGC approach than the existing methodologies.
Citation: S. Rama Sree, E Laxmi Lydia, C. S. S. Anupama, Ramya Nemani, Soojeong Lee, Gyanendra Prasad Joshi, Woong Cho. A battle royale optimization with feature fusion-based automated fruit disease grading and classification[J]. AIMS Mathematics, 2024, 9(5): 11432-11451. doi: 10.3934/math.2024561
Fruit Disease Detection (FDD) using Computer Vision (CV) techniques is a powerful strategy to accomplish precision agriculture. Because, these techniques assist the farmers in identifying and treating the diseased fruits before it spreads to other plants, thus resulting in better crop yield and quality. Further, it also helps in reducing the usage of pesticides and other chemicals so that the farmers can streamline their efforts with high accuracy and avoid unwanted treatments. FDD and Deep Learning (DL)-based classification involve the deployment of Artificial Intelligence (AI), mainly the DL approach, to identify and classify different types of diseases that affect the fruit crops. The DL approach, especially the Convolutional Neural Network (CNN), has been trained to classify the fruit images as diseased or healthy, based on the presence or absence of the disease symptoms. In this background, the current study developed a new Battle Royale Optimization with a Feature Fusion Based Fruit Disease Grading and Classification (BROFF-FDGC) technique. In the presented BROFF-FDGC technique, the Bilateral Filtering (BF) approach is primarily employed for the noise removal process. Besides, a fusion of DL models, namely Inception v3, NASNet, and Xception models, is used for the feature extraction process with Bayesian Optimization (BO) algorithm as a hyperparameter optimizer. Moreover, the BROFF-FDGC technique employed the Stacked Sparse Autoencoder (SSAE) algorithm for fruit disease classification. Furthermore, the BRO technique is also employed for optimum hyperparameter tuning of the SSAE technique. The proposed BROFF-FDGC system was simulated extensively for validation using the test database and the outcomes established the enhanced performance of the proposed system. The obtained outcomes emphasize the superior performance of the BROFF-FDGC approach than the existing methodologies.

| [1] |
C. C. Ukwuoma, Q. Zhiguang, M. B. B. Heyat, L. Ali, Z. Almaspoor, H. N. Monday, Recent advancements in fruit detection and classification using deep learning techniques, Math. Probl. Eng., 2022 (2022), 9210947. https://doi.org/10.1155/2022/9210947 doi: 10.1155/2022/9210947

|
| [2] | A. Khattak, M. U. Asghar, U. Batool, M. Z. Asghar, H. Ullah, M. Al-Rakhami, et al., Automatic detection of citrus fruit and leaves diseases using deep neural network model, IEEE Access, 9 (2021), 112942–112954. https://doi.org/10.1109/ACCESS.2021.3096895 |
| [3] |
Y. Gulzar, Fruit image classification model based on MobileNetV2 with deep transfer learning technique, Sustainability, 15 (2023), 1906. https://doi.org/10.3390/su15031906 doi: 10.3390/su15031906
|
| [4] | X. Liu, L. Wei, C. Miao, Q. Zhang, J. Yan, S. Li, et al., Application of exogenous phenolic compounds in improving postharvest fruits quality: Classification, potential biochemical mechanisms and synergistic treatment, Food Rev. Int., 2023. https://doi.org/10.1080/87559129.2023.2233599 |
| [5] | B. Güven, İ. Baz, B. Kocaoğlu, E. Toprak, D. E. Barkana, B. S. Özdemir, Smart farming technologies for sustainable agriculture: From food to energy. In: A sustainable green future: Perspectives on energy, economy, industry, cities and environment, Springer, Cham, 2023,481–506. https://doi.org/10.1007/978-3-031-24942-6_22 |
| [6] | F. Li, Y. Zheng, S. Liu, F. Sun, H. Bai, A multi-objective apple leaf disease detection algorithm based on improved TPH-YOLOV5, Appl. Fruit Sci., 2024. 1–17. https://doi.org/10.1007/s10341-024-01042-7 |
| [7] |
H. Li, Y. Jin, J. Zhong, R. Zhao, A fruit tree disease diagnosis model based on stacking ensemble learning, Complexity, 2021 (2021), 6868592. https://doi.org/10.1155/2021/6868592 doi: 10.1155/2021/6868592
|
| [8] | P. Dhiman, V. Kukreja, P. Manoharan, A. Kaur, M. M. Kamruzzaman, I. B. Dhaou, et al., A novel deep learning model for detection of severity level of the disease in citrus fruits, Electronics, 11 (2022), 495. https://doi.org/10.3390/electronics11030495 |
| [9] | V. Ashok, D. S. Vinod, A novel fusion of deep learning and android application for real-time mango fruits disease detection, In: Intelligent system design, Singapore: Springer, 2020,781–791. https://doi.org/10.1007/978-981-15-5400-1_74 |
| [10] | M. S. Hossen, I. Haque, M. S. Islam, M. T. Ahmed, M. J. Nime, M. A. Islam, Deep learning based classification of papaya disease recognition. In: 2020 3rd International Conference on Intelligent Sustainable Systems (ICISS), 2020,945–951. https://doi.org/10.1109/ICISS49785.2020.9316106 |
| [11] |
S. Thite, K. Patil, R. Jadhav, Y. Suryawanshi, P. Chumchu, Empowering agricultural research: A comprehensive custard apple (Annona squamosa) disease dataset for precise detection, Data Brief, 53 (2024), 110078. https://doi.org/10.1016/j.dib.2024.110078 doi: 10.1016/j.dib.2024.110078
|
| [12] | A. Majid, M. A. Khan, M. Alhaisoni, M. Asfand E. yar, U. Tariq, N. Hussain, et al., An integrated deep learning framework for fruits diseases classification, CMC Comput. Mater. Con., 71 (2022), 1387–1402. https://doi.org/10.32604/cmc.2022.017701 |
| [13] | F. A. Shah, M. A. Khan, M. Sharif, U. Tariq, A. Khan, S. Kadry, et al., A cascaded design of best features selection for fruit diseases recognition, CMC-Comput. Mater. Con., 70 (2022), 1491–1507. https://doi.org/10.32604/cmc.2022.019490 |
| [14] |
A. M. Mostafa, S. A. Kumar, T. Meraj, H. T. Rauf, A. A. Alnuaim, M. A. Alkhayyal, Guava disease detection using deep convolutional neural networks: A case study of guava plants, Appl. Sci., 12 (2022), 239. https://doi.org/10.3390/app12010239 doi: 10.3390/app12010239
|
| [15] |
S. F. Syed-Ab-Rahman, M. H. Hesamian, M. Prasad, Citrus disease detection and classification using end-to-end anchor-based deep learning model, Appl. Intell., 52 (2022), 927–938. https://doi.org/10.1007/s10489-021-02452-w doi: 10.1007/s10489-021-02452-w
|
| [16] |
C. Senthilkumar, M. Kamarasan, An effective classification of citrus fruits diseases using adaptive gamma correction with deep learning model, Int. J. Eng. Adv. Technol., 9 (2020), 2618–2629. https://doi.org/10.35940/ijeat.B4066.129219 doi: 10.35940/ijeat.B4066.129219
|
| [17] | M. Nikhitha, S. R. Sri, B. U. Maheswari, Fruit recognition and grade of disease detection using inception v3 model. In: 2019 3rd International conference on Electronics, Communication and Aerospace Technology (ICECA), 2019, 1040–1043. https://doi.org/10.1109/ICECA.2019.8822095 |
| [18] | A. Adeel, M. A. Khan, T. Akram, A. Sharif, M. Yasmin, T. Saba, et al., Entropy‐controlled deep features selection framework for grape leaf diseases recognition, Expert Syst., 39 (2022), e12569. https://doi.org/10.1111/exsy.12569 |
| [19] | S. Kejriwal, D. Patadia, V. Sawant, Apple leaves diseases detection using deep convolutional neural networks and transfer learning, In: Computer vision and machine learning in agriculture, Singapore: Springer, 2022,207–227. https://doi.org/10.1007/978-981-16-9991-7_13 |
| [20] |
T. Bahraini, T. Hamedani, S. M. Hosseini, H. S. Yazdi, Edge preserving range image smoothing using hybrid locally kernel-based weighted least square, Appl. Soft Comput., 125 (2022), 109234. https://doi.org/10.1016/j.asoc.2022.109234 doi: 10.1016/j.asoc.2022.109234
|
| [21] |
T. Saba, A. S. Mohamed, M. El-Affendi, J. Amin, M. Sharif, Brain tumor detection using fusion of hand crafted and deep learning features, Cogn. Syst. Res., 59 (2020), 221–230. https://doi.org/10.1016/j.cogsys.2019.09.007 doi: 10.1016/j.cogsys.2019.09.007
|
| [22] |
A. Gupta, Anjum, S. Gupta, R. Katarya, InstaCovNet-19: A deep learning classification model for the detection of COVID-19 patients using Chest X-ray, Appl. Soft Comput., 99 (2021), 106859. https://doi.org/10.1016/j.asoc.2020.106859 doi: 10.1016/j.asoc.2020.106859
|
| [23] |
A. Altamimi, F. Alrowais, H. Karamti, M. Umer, L. Cascone, I. Ashraf, An improved skin lesion detection solution using multi-step preprocessing features and NASNet transfer learning model, Image Vision Comput., 144 (2024), 104969. https://doi.org/10.1016/j.imavis.2024.104969 doi: 10.1016/j.imavis.2024.104969
|
| [24] | Q. Liang, A. E. Gongora, Z. Ren, A. Tiihonen, Z. Liu, S. Sun, et al., Benchmarking the performance of Bayesian optimization across multiple experimental materials science domains, npj Comput. Mater., 7 (2021), 188. https://doi.org/10.1038/s41524-021-00656-9 |
| [25] |
H. Bai, X. Zhan, H. Yan, L. Wen, Y. Yan, X. Jia, Research on diesel engine fault diagnosis method based on stacked sparse autoencoder and support vector machine, Electronics, 11 (2022), 2249. https://doi.org/10.3390/electronics11142249 doi: 10.3390/electronics11142249
|
| [26] |
H. Wu, X. Zhang, L. Song, C. Su, L. Gu, A hybrid improved BRO algorithm and its application in inverse kinematics of 7R 6DOF robot, Adv. Mech. Eng., 2022. https://doi.org/10.1177/16878132221085125 doi: 10.1177/16878132221085125
|
| [27] | The CASC IFW Database, Available from: https://engineering.purdue.edu/RVL/Database/IFW/index.html. |
| [28] |
N. Ismail, O. A. Malik, Real-time visual inspection system for grading fruits using computer vision and deep learning techniques, Inform. Process. Agric., 9 (2022), 24–37. https://doi.org/10.1016/j.inpa.2021.01.005 doi: 10.1016/j.inpa.2021.01.005
|

Figures(14) / Tables(4)

S. Rama Sree, E Laxmi Lydia, C. S. S. Anupama, Ramya Nemani, Soojeong Lee, Gyanendra Prasad Joshi, Woong Cho. A battle royale optimization with feature fusion-based automated fruit disease grading and classification[J]. AIMS Mathematics, 2024, 9(5): 11432-11451. doi: 10.3934/math.2024561


 DownLoad: